
SLS-130 · Lesson 2 of 12 · 18 min
The customer journey and moments of truth
▶ Video coming soon A video version of this lesson is on the way.
Bev Halvorsen keeps a roll of brown paper in her office. In the second week of October 2026 she unrolled three meters of it along the staff-room wall at Juniper & Pine and drew a long horizontal line. "This is what it's like to buy a refrigerator from us," she told Aiden and two other new associates. "Start from the very first moment someone thinks about it, and finish when they've stopped thinking about us. Every place you can name where they touch the store, write it on a sticky note." Within twenty minutes the line was covered: an online search, the product page, a phone call about sizes, the drive to the store, finding parking, being greeted, measuring the kitchen, paying, choosing a delivery date, the reminder text, the delivery crew, the old fridge being taken away, the first time the ice maker failed, the call about it, and the survey email afterwards.
What Bev had drawn is the beginning of a customer journey map: a picture of the steps a customer goes through to reach a goal, the touchpoints they meet along the way, and how they feel at each one. This lesson explains how journey maps are built, how to find the moments that matter most, and how the same idea works for a business customer like Riverbend Dental Group at Ridgeline.
Touchpoints, stages and channels
A touchpoint is any point where a customer comes into contact with the organization: an advertisement, a web page, a salesperson, a delivery driver, an invoice, a recorded phone message. Some touchpoints are controlled by the business, such as its website and its staff. Others are not, such as a review site or a friend's comments, but they still shape the experience.
Touchpoints are grouped into stages, the broad phases of the journey. Many maps use five: becoming aware of a need, researching and comparing options, buying, receiving and using the product, and getting help or buying again. The names vary between organizations; what matters is that the stages follow the customer's goals rather than the company's departments. A customer does not experience "marketing" and then "fulfillment". They experience "finding a fridge that fits" and then "getting it into the kitchen".
Each touchpoint happens in a channel: in person, by phone, by email, through a website or app, by text message, by chat, or by post. Many journeys cross channels. A customer might research on a phone, visit the store, buy at the counter, receive a delivery text and then call about a problem. Lesson 8 looks at how to keep service consistent across channels; for now, the point is that a journey map should show the channel at each step, because customers' expectations differ between them.
Mapping feelings, not just steps
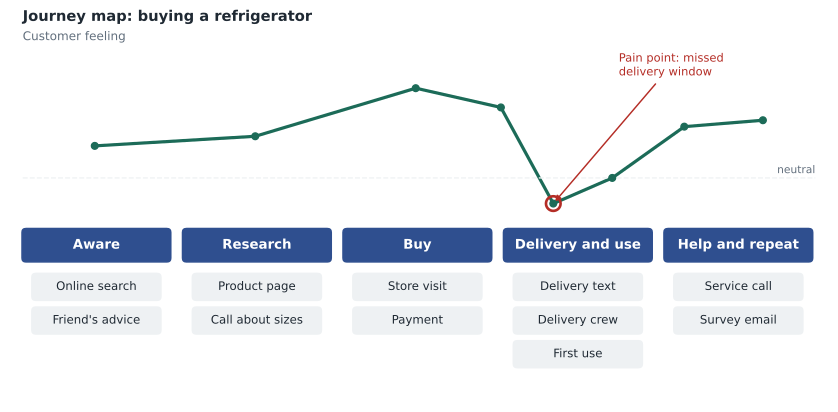
The most useful part of a journey map is usually the line that shows how the customer feels. Bev asked each associate to place a dot above every touchpoint: high if the customer was likely to feel pleased or confident, low if they were likely to feel anxious, confused or annoyed. Joined up, the dots made a line that rose during the store visit, when associates were helpful and the showroom was bright, and then fell sharply at the delivery stage. The store gave four-hour delivery windows, sent a reminder only the evening before, and offered no way to see where the truck was. Customers took half a day off work and then waited.
That low point is a pain point: a place where the experience causes frustration, effort or worry. Pain points are where most complaints come from, and they are often where customers decide not to come back. Bev's map made one fact obvious that the sales reports had hidden: the store's biggest risk to repeat business was not the selling, which was strong, but the delivery.
Feelings on a map should come from evidence, not guesses. Good sources include complaints and their reasons, survey comments, online reviews, recordings or notes from service calls, and simply asking customers. Staff who handle service know where the pain is, but they see mostly the people who complain. Customers who were annoyed and said nothing are invisible unless someone asks them. Lesson 5 discusses this silent group.
Moments of truth
In 1987 Jan Carlzon, who had turned around the Scandinavian airline SAS, published a short book called Moments of Truth. He argued that each of the airline's customers had about five contacts with staff on a typical trip, each lasting perhaps fifteen seconds, and that in those brief moments customers decided whether SAS was a good airline. He called them moments of truth. His conclusion was that front-line staff needed the authority to solve problems on the spot, because those short contacts were where the company won or lost its customers.
The phrase is now used for any touchpoint that has an unusually large effect on how customers judge an organization. Not every touchpoint is a moment of truth. Being handed a receipt rarely changes anyone's view of a store. A delivery crew that scratches a new floor, or an associate who stays late to help a family choose a crib, can change it permanently. Moments of truth tend to share some features: something important to the customer is at stake, the customer feels uncertain or exposed, and the outcome depends heavily on how one person or one process behaves.
Common moments of truth include the first contact, when the customer forms an impression; the moment of paying, when they commit; the first use of the product; the first problem; and the response to a complaint. The first problem is often the most powerful. It is the first time the customer finds out whether the promises made during the sale were real.
| Touchpoint at Juniper & Pine | Moment of truth? | Why |
|---|---|---|
| Being greeted on entering the store | Often | First impression; a shopper who feels ignored may leave |
| Reading the product page | Sometimes | Decides whether the store is shortlisted, but feelings are mild |
| Paying at the counter | Sometimes | Commitment; surprise fees here damage trust |
| The delivery crew arriving | Yes | The product enters the home; damage or rudeness is felt personally |
| Receiving the receipt by email | Rarely | Expected and low stakes |
| Calling about a fault in the first month | Yes | The first test of whether the store stands behind what it sold |
Journeys in business-to-business service
Maya tried the same exercise for Riverbend Dental Group's managed print contract. The journey had more people in it. The clinic's office manager, Helen Park, chose the contract and booked repairs. Nurses and reception staff used the printers every day. The finance clerk checked Ridgeline's monthly bill, which charged for the number of pages printed. The clinic director signed the contract and would decide on renewal. Each of them had a different journey through the same contract.
A business-to-business journey map therefore usually has a row for each important stakeholder, or at least notes on whose experience each touchpoint affects. Maya's map showed that the clinic's most painful moment was not the printer breaking down, which happened only twice in the year, but the monthly invoice. Ridgeline's bills listed page counts by device serial number, which meant nothing to the finance clerk, who had to email Janet every month to ask which printer was which. Janet found this irritating, and Janet would advise the director on renewal. A small change, printing the room name next to each serial number, removed a monthly frustration.
Business journeys also have a clearer structure of stages, because contracts create them: onboarding when the service starts, routine use, periodic reviews, support incidents, and renewal. Onboarding is often a moment of truth. A business customer who has a confusing first month remembers it at renewal time.
Worked problem
Finding the pain points in a delivery journey
Juniper & Pine records 640 appliance deliveries in September 2026. The store has the following counts: 88 customers phoned to ask when the truck would arrive; 41 deliveries arrived outside the four-hour window; 19 complaints about damage to homes or products; and 12 complaints about the old appliance not being removed. Express each as a number per 100 deliveries and decide which is the biggest pain point by frequency.
Show solution
- "Where is my truck?" calls: 88 ÷ 640 × 100 = 13.75, about 13.8 per 100 deliveries.
- Late arrivals: 41 ÷ 640 × 100 = 6.4 per 100.
- Damage complaints: 19 ÷ 640 × 100 = 2.97, about 3.0 per 100.
- Old appliance not removed: 12 ÷ 640 × 100 = 1.875, about 1.9 per 100.
- Compare: uncertainty about arrival time affects the most customers. Damage is less frequent but much more severe, so it should be weighed by impact as well as frequency.
Answer: Calls about arrival time, at about 13.8 per 100 deliveries, are the most frequent pain point. Damage, at about 3 per 100, is rarer but more serious. A good plan fixes the frequent problem (for example, a text with a one-hour window on the day) and the severe one (better crew training and protective covers).
Building a journey map step by step
Journey maps can be elaborate posters produced by design agencies, but a useful one can be built in an afternoon with sticky notes. The steps are similar wherever it is done.
- Choose one customer type and one goal. "A household buying a large appliance" is a good scope; "all our customers" is too broad.
- Gather evidence: complaints, survey comments, reviews, service records, and short interviews with a few real customers.
- List the stages from the customer's point of view, then the touchpoints within each stage, with the channel for each.
- Add what the customer is trying to do, thinking and feeling at each touchpoint, based on the evidence.
- Mark the pain points and the moments of truth.
- Note who inside the organization owns each touchpoint, because fixing a pain point needs an owner.
- Choose a small number of improvements, decide how to measure them, and revisit the map after they are made.
Two cautions apply. First, a journey map shows the typical journey, and real customers vary. A first-time buyer and a contractor who orders ten appliances a year have very different journeys. It is better to make two simple maps than one that tries to cover everyone. Second, a map is only useful if it leads to change. Many organizations produce impressive maps that hang on a wall and are never used. Bev's rule was that every map session ended with one improvement assigned to a named person with a date.
Service blueprints: what happens behind the scenes
A journey map shows the customer's side. A service blueprint adds the organization's side underneath: what front-line staff do in view of the customer, what happens out of view, and which systems and teams support each step. The idea was introduced by G. Lynn Shostack in the Harvard Business Review in 1984. A horizontal line of visibility separates what customers see from what they do not.
Blueprints are useful for finding the cause of a pain point. When Marcus Dube, Juniper & Pine's operations lead, drew the blueprint below the delivery stage, he found that delivery routes were finalized only at 7 p.m. the evening before, because the warehouse waited for the day's last orders. That was why the store could not give customers a narrower window earlier. The fix was not a nicer reminder message; it was a change to when routes were planned. Lesson 12 uses a blueprint as part of a full redesign.
Common mistakes
MistakeMapping the journey by department instead of by customer goal.
InsteadName stages after what the customer is trying to do, such as finding a fridge that fits or getting it installed.
MistakeFilling in feelings from staff guesses.
InsteadBase feelings on evidence: complaints, survey comments, reviews, service records and customer interviews.
MistakeTreating every touchpoint as equally important.
InsteadIdentify the moments of truth, where stakes and uncertainty are high, and focus there.
MistakeMapping only the decision-maker in a business account.
InsteadShow each stakeholder who experiences the service, such as users, finance staff and the person who books repairs.
MistakeProducing a map and stopping.
InsteadEnd each mapping session with specific improvements, an owner, a date and a measure.
Summary and key terms
- A customer journey map shows the stages a customer goes through, the touchpoints in each stage, the channel used and how the customer feels.
- Pain points are where the experience causes frustration or effort; they generate complaints and lost customers.
- Moments of truth, a term popularized by Jan Carlzon of SAS, are touchpoints with an outsized effect on how customers judge an organization, such as the first problem after a purchase.
- Business-to-business journeys involve several stakeholders and contract stages such as onboarding and renewal.
- Pain points should be ranked by frequency and severity.
- A service blueprint adds the behind-the-scenes steps and systems below a line of visibility, which helps find the real cause of a pain point.
- Customer journey map
- A picture of the stages, touchpoints and feelings a customer goes through to reach a goal.
- Touchpoint
- Any point of contact between a customer and the organization.
- Pain point
- A place in the journey that causes frustration, effort or worry.
- Moment of truth
- A touchpoint with an unusually large effect on how customers judge the organization.
- Service blueprint
- A diagram showing the customer journey together with the front-stage, back-stage and support steps behind it.
- Line of visibility
- The line on a blueprint separating what customers see from what they do not.
Practice problems
Work each problem on paper first, then reveal the answer to check.
Why should journey stages be named from the customer's point of view?
Show answer
Because customers experience goals such as getting a fridge installed, not internal departments; naming stages after goals keeps the map focused on their experience.
Give one feature that makes a touchpoint likely to be a moment of truth.
Show answer
Any of: something important is at stake, the customer feels uncertain or exposed, or the outcome depends heavily on one person or process.
Out of 500 deliveries, 35 customers called to ask about arrival times. How many is that per 100 deliveries?
Show answer
35 ÷ 500 × 100 = 7 per 100 deliveries.
Lesson quiz · 5 questions
Score 60% or more to complete this lesson.
Create a free account to save your progress, take quizzes and earn a certificate.