
PYTH-250 · Lesson 9 of 12 · 22 min
NumPy for fast numeric code
▶ Video coming soon A video version of this lesson is on the way.
Processes gave Kai's roast-curve analysis eight cores, but each core is still running slow Python loops over hundreds of thousands of temperature readings. Python loops are slow for a specific reason: every number is a full Python object, and every addition in a loop means the interpreter looking up types, checking for overflow and creating a new object. For numeric work there is a far better approach than spreading those loops over more cores: stop looping in Python at all, and hand whole arrays of numbers to code written in C that processes them in one go.
That is what NumPy does. It is the foundation of almost all scientific and numeric Python, from pandas to machine learning libraries. This lesson introduces the NumPy array, vectorized arithmetic that replaces explicit loops, aggregations along axes, boolean masks for filtering, broadcasting, and a few tools such as np.diff, np.convolve and np.where that turn Kai's per-reading loops into single expressions. NumPy runs in the browser here: the first run that uses it loads the library, which takes a few extra seconds.
Why Python loops are slow for numbers
A Python list of numbers is really a list of pointers to separate number objects scattered around memory, each carrying its type and reference count. A NumPy array is one contiguous block of raw numbers of a single type, such as 64-bit floats, with a small header describing its shape. Operations on arrays run in compiled C loops over that block, with no per-element interpreter work. The difference is commonly a factor of ten to a hundred for simple arithmetic, and it grows for more complex operations.
import time
import numpy as np

n = 300_000
temps_list = [180 + (i % 840) * 0.05 for i in range(n)]       # a week of readings
temps = np.array(temps_list)

start = time.perf_counter()
fahrenheit_list = [t * 9 / 5 + 32 for t in temps_list]
t_loop = time.perf_counter() - start

start = time.perf_counter()
fahrenheit = temps * 9 / 5 + 32                                 # one vectorized expression
t_numpy = time.perf_counter() - start

print("same values:", np.allclose(fahrenheit, fahrenheit_list))
print(f"loop {t_loop * 1000:.1f} ms, NumPy {t_numpy * 1000:.2f} ms, about {t_loop / t_numpy:.0f}x faster")same values: True loop 38.4 ms, NumPy 1.21 ms, about 32x faster
Creating arrays
np.array(sequence) builds an array from a list. Every element has the same data type, its dtype, chosen automatically or given explicitly. np.zeros, np.ones and np.full make arrays of a given shape filled with one value; np.arange works like range but returns an array; np.linspace(start, stop, num) gives evenly spaced values including both ends. An array's shape is a tuple of its sizes along each dimension: (840,) for one roast of 840 readings, (60, 840) for sixty roasts stored as rows.
import numpy as np

batch = np.array([182.0, 168.5, 160.1, 163.4, 171.2, 180.9])     # first six half-minute readings
print(batch, batch.dtype, batch.shape)
print(np.arange(0, 3, 0.5))
print(np.linspace(0, 14, 5))                 # minutes at five evenly spaced points
week = np.zeros((60, 840))                   # 60 roasts of 840 readings
print(week.shape, week.size, f"{week.nbytes:,} bytes")[182. 168.5 160.1 163.4 171.2 180.9] float64 (6,) [0. 0.5 1. 1.5 2. 2.5] [ 0. 3.5 7. 10.5 14. ] (60, 840) 50400 403,200 bytes
Vectorized arithmetic
Arithmetic between an array and a number, or between two arrays of the same shape, works element by element without a loop. temps * 9 / 5 + 32 converts every reading; green - roasted subtracts matching elements of two arrays. Comparison operators produce arrays of True and False. NumPy also provides universal functions, ufuncs, such as np.sqrt, np.exp, np.log and np.round, that apply to every element. Writing code in this whole-array style is called vectorization.
import numpy as np

green_kg = np.array([12.0, 12.0, 11.5, 12.0, 10.0])
roasted_kg = np.array([10.15, 10.30, 9.70, 10.02, 8.61])

loss = (green_kg - roasted_kg) / green_kg           # element by element
bags = np.floor(roasted_kg / 0.34).astype(int)      # 340 g bags per batch
print("weight loss share:", np.round(loss, 3))
print("bags per batch:  ", bags, "total:", int(bags.sum()))
print("batches losing more than 0.16:", loss > 0.16)weight loss share: [0.154 0.142 0.157 0.165 0.139] bags per batch: [29 30 28 29 25] total: 141 batches losing more than 0.16: [False False False True False]
Try it yourself
Vectorized weight loss
Write loss_shares(green, roasted) that takes two NumPy arrays of batch weights in kilograms and returns an array of the weight lost in roasting as a share of the green weight, rounded to 3 decimal places.
Then write bags(roasted, bag_kg=0.34) returning an integer array of how many whole bags each batch fills. Use array operations, not Python loops.
import numpy as np

def loss_shares(green, roasted):
    return [(g - r) / g for g, r in zip(green, roasted)]

def bags(roasted, bag_kg=0.34):
    return roasted

print(loss_shares(np.array([12.0]), np.array([10.2])))
Aggregations and axes
Aggregation functions reduce an array to fewer numbers: sum, mean, min, max, std, argmin and argmax, available as methods or as np functions. For a two-dimensional array they take an axis argument. axis=0 aggregates down the columns, giving one result per column; axis=1 aggregates across each row, giving one result per row. Kai stores a week of roasts as a two-dimensional array, one row per batch and one column per half-minute, so the peak temperature of every batch is a single expression.
import numpy as np

# 4 batches (rows) x 6 half-minute readings (columns)
curves = np.array([
    [182, 165, 158, 166, 179, 192],
    [185, 167, 160, 168, 181, 195],
    [180, 162, 155, 161, 173, 186],
    [184, 166, 159, 167, 180, 194],
], dtype=float)

print("peak per batch (axis=1):   ", curves.max(axis=1))
print("mean per reading (axis=0): ", curves.mean(axis=0))
print("turning point index per batch:", curves.argmin(axis=1))
print("hottest batch:", int(curves.max(axis=1).argmax()))peak per batch (axis=1): [192. 195. 186. 194.] mean per reading (axis=0): [182.75 165. 158. 165.5 178.25 191.75] turning point index per batch: [2 2 2 2] hottest batch: 1
Boolean masks
A comparison such as temps > 196 produces a boolean array of the same shape. Using it as an index, temps[temps > 196], selects only the elements where the mask is True. Masks combine with & (and), | (or) and ~ (not), with parentheses around each comparison because of operator precedence. np.where(condition, a, b) builds a new array choosing from a where the condition holds and from b elsewhere, and np.count_nonzero or mask.sum() counts the True values.
import numpy as np

temps = np.array([182, 165, 158, 166, 179, 192, 198, 203, 207, 211], dtype=float)
minutes = np.arange(len(temps)) * 0.5

print("readings above 196:", temps[temps > 196])
print("minutes in development window:", minutes[(temps >= 196) & (temps <= 208)])
print("count above 200:", int((temps > 200).sum()))
print("first reading at or above 196 is index", int(np.argmax(temps >= 196)))
print(np.where(temps >= 196, "crack zone", "drying").tolist()[-5:])readings above 196: [198. 203. 207. 211.] minutes in development window: [3. 3.5 4. ] count above 200: 3 first reading at or above 196 is index 6 ['drying', 'crack zone', 'crack zone', 'crack zone', 'crack zone']
Try it yourself
Find first crack
First crack happens when the bean temperature first reaches about 196 degrees Celsius. Write first_reaching(temps, threshold) that returns the index of the first reading greater than or equal to threshold, or -1 if no reading reaches it.
Use a boolean mask with np.argmax or np.flatnonzero, not a Python loop. Careful: np.argmax of an all-False mask is 0.
import numpy as np

def first_reaching(temps, threshold):
    return int(np.argmax(temps >= threshold))

print(first_reaching(np.array([180.0, 190.0, 197.0]), 196))
Broadcasting
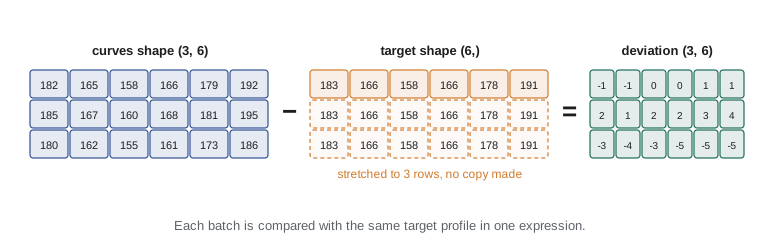
When two arrays of different shapes meet in an operation, NumPy tries to broadcast them: dimensions of size one are stretched to match the other array, without copying data. Subtracting a one-dimensional target profile of 840 readings from a (60, 840) array of roasts subtracts the target from every row. Dividing a (60, 840) array by a (60, 1) column of per-batch values divides each row by its own value. Broadcasting is what lets whole-dataset calculations stay one line long.
import numpy as np

curves = np.array([[182, 165, 158, 166, 179, 192],
                   [185, 167, 160, 168, 181, 195],
                   [180, 162, 155, 161, 173, 186]], dtype=float)
target = np.array([183, 166, 158, 166, 178, 191], dtype=float)      # shape (6,)

deviation = curves - target                    # target is applied to every row
score = np.abs(deviation).mean(axis=1)         # mean absolute deviation per batch
print(deviation)
print("score per batch:", np.round(score, 2), "best batch:", int(score.argmin()))
per_batch_start = curves[:, :1]                # shape (3, 1)
print("rise from the start temperature:\n", curves - per_batch_start)[[-1. -1. 0. 0. 1. 1.] [ 2. 1. 2. 2. 3. 4.] [-3. -4. -3. -5. -5. -5.]] score per batch: [0.67 2.33 4.17] best batch: 0 rise from the start temperature: [[ 0. -17. -24. -16. -3. 10.] [ 0. -18. -25. -17. -4. 10.] [ 0. -18. -25. -19. -7. 6.]]
Rate of rise and smoothing
Roasters judge a roast by its rate of rise, how many degrees the beans gain per minute. With readings every 30 seconds, the rise between neighboring readings is np.diff(temps), and doubling it gives degrees per minute. Real sensor data is noisy, so the rate is smoothed with a moving average. A moving average of width k is a convolution with k equal weights: np.convolve(x, np.ones(k) / k, mode='valid') computes it for the whole array at once, which in a loop would be one Python iteration per reading.
import numpy as np

temps = np.array([182, 165, 158, 160, 166, 172, 178, 183, 188, 192, 196, 199, 202], dtype=float)
ror = np.diff(temps) * 2                       # readings every 30 s -> degrees per minute
smooth = np.convolve(ror, np.ones(3) / 3, mode="valid")
print("rate of rise:", ror)
print("smoothed:    ", np.round(smooth, 1))
print("rate falling after the turning point:", bool(np.all(np.diff(smooth[3:]) <= 0)))rate of rise: [-34. -14. 4. 12. 12. 12. 10. 10. 8. 8. 6. 6.] smoothed: [-14.7 0.7 9.3 12. 11.3 10.7 9.3 8.7 7.3 6.7] rate falling after the turning point: True
Try it yourself
Rate of rise
Readings are taken every interval seconds. Write rate_of_rise(temps, interval=30) returning a NumPy array of degrees gained per minute between neighboring readings: the differences multiplied by 60 / interval.
Then write smoothed(values, k) returning the moving average of width k with np.convolve(..., mode="valid"), rounded to 1 decimal place.
import numpy as np

def rate_of_rise(temps, interval=30):
    return np.diff(temps)

def smoothed(values, k):
    return values

print(rate_of_rise(np.array([160.0, 166.0, 172.0])))
Summaries: quantiles, sorting and counting
Kai rarely needs every reading; he needs summaries. NumPy computes them without loops. np.quantile(a, q) gives the value below which a share q of the data falls, so np.quantile(a, 0.9) is the value that nine readings in ten stay under, which is more robust to a few faulty sensor spikes than the maximum. np.sort returns a sorted copy and np.argsort the order that would sort it, useful for ranking batches. np.unique with return_counts=True counts how often each value occurs, the array version of Counter. And np.histogram sorts values into bins, the basis of any distribution chart.
import numpy as np

roast_minutes = np.array([14.2, 12.8, 15.6, 13.1, 16.0, 14.4, 13.9, 14.1, 15.2, 13.5])
print("median:", round(float(np.median(roast_minutes)), 2), "| 0.9 quantile:", round(float(np.quantile(roast_minutes, 0.9)), 2))
order = np.argsort(roast_minutes)[::-1]            # longest first
print("longest three batches (indexes):", order[:3].tolist())

profiles = np.array(["light", "medium", "dark", "medium", "medium", "light", "dark", "medium"])
names, counts = np.unique(profiles, return_counts=True)
print(dict(zip(names.tolist(), counts.tolist())))

counts, edges = np.histogram(roast_minutes, bins=[12, 13, 14, 15, 16, 17])
for lo, n in zip(edges[:-1], counts):
print(f"{lo:.0f}-{lo + 1:.0f} min: {'#' * int(n)}")median: 14.15 | 0.9 quantile: 15.64
longest three batches (indexes): [4, 2, 8]
{'dark': 2, 'light': 2, 'medium': 4}
12-13 min: #
13-14 min: ###
14-15 min: ###
15-16 min: ##
16-17 min: #Converting results back with tolist() or int() before printing keeps the output plain and avoids NumPy's own number types appearing in lists and dictionaries, whose printed form has changed between NumPy versions.
When NumPy is the right tool
NumPy shines when the same operation applies to many numbers: sensor readings, prices, measurements, pixel values, anything that fits naturally in arrays. It also releases the global interpreter lock during most large operations, so it combines well with threads. It is not a speedup for code that works on small numbers of items, on strings and dictionaries, or with complicated branching per element; converting such data to arrays can cost more than it saves. When a calculation cannot be expressed with array operations, tools such as Numba, which compiles Python functions to machine code, or Cython fill the gap, but for most numeric work, thinking in whole arrays is enough. Kai's weekly analysis, rewritten with NumPy, runs in under a second on one core, so the process pool from lesson 5 is no longer needed at all, a reminder that a better algorithm or library often beats more hardware.
Common mistakes
MistakeLooping over a NumPy array element by element in Python.
InsteadUse vectorized operations, ufuncs and aggregations on the whole array.
MistakeWriting temps > 190 and temps < 200 to combine masks.
InsteadUse (temps > 190) & (temps < 200) with parentheses.
MistakeForgetting which axis is which.
Insteadaxis=0 aggregates down columns; axis=1 aggregates across each row.
MistakeAssuming np.argmax(mask) finds nothing when no element matches.
InsteadAn all-False mask gives 0; check mask.any() or use np.flatnonzero.
MistakeMixing lists and arrays and expecting arithmetic to work on lists.
InsteadConvert with np.array first; list * 2 repeats the list.
MistakeConverting tiny or string-heavy data to arrays for speed.
InsteadNumPy helps with large numeric arrays; for small or mixed data, plain Python may be faster.
Summary and key terms
- Python loops over numbers are slow because each number is a separate object handled by the interpreter.
- A NumPy array stores raw numbers of one dtype in one block, with a shape describing its dimensions.
- Vectorized arithmetic and ufuncs apply operations to whole arrays in compiled code.
- Aggregations such as sum, mean, max and argmin take an axis argument for two-dimensional data.
- Boolean masks select and count elements; combine them with &, | and ~.
- Broadcasting stretches arrays of compatible shapes so operations work across rows or columns.
- np.diff, np.convolve and np.where turn common loops into single expressions.
- NumPy array
- A block of numbers of one type with a shape, processed by compiled code.
- dtype
- The data type of every element in an array, such as float64.
- shape
- A tuple giving an array's size along each dimension.
- vectorization
- Expressing a calculation as operations on whole arrays instead of loops.
- ufunc
- A universal function that applies element by element, such as np.sqrt.
- axis
- The dimension along which an aggregation is computed.
- boolean mask
- An array of True and False used to select elements.
- broadcasting
- Stretching arrays of different but compatible shapes to combine them.
- moving average
- The average of each run of k neighboring values.
Practice problems
Work each problem on paper first, then reveal the answer to check.
What does np.array([1, 2, 3]) * 2 give, and what does [1, 2, 3] * 2 give?
Show answer
array([2, 4, 6]); the list [1, 2, 3, 1, 2, 3].
A (60, 840) array holds 60 roasts. How do you get each roast's peak?
Show answer
curves.max(axis=1), giving 60 values.
Select readings between 196 and 208 inclusive.
Show answer
temps[(temps >= 196) & (temps <= 208)]
Readings every 15 seconds: how do you convert np.diff(temps) to degrees per minute?
Show answer
Multiply by 4.
What shape results from (3, 6) minus (6,)?
Show answer
(3, 6): the second array is broadcast across the rows.
Why can NumPy work well with threads?
Show answer
It releases the GIL during most large operations.
Lesson quiz · 5 questions
Score 60% or more to complete this lesson.
Create a free account to save your progress, take quizzes and earn a certificate.