
PYTH-250 · Lesson 2 of 12 · 23 min
Profiling Python code
▶ Video coming soon A video version of this lesson is on the way.
Timing tells Jordan that the month-end report is slow. It does not tell him why. The report is a few hundred lines spread over a dozen functions, and any of them could be the problem. A profiler answers the question directly: it watches the program run and records how many times each function is called and how much time is spent inside it. Instead of guessing, Jordan gets a ranked list of where the time goes.
This lesson covers deterministic profiling with cProfile, reading its output with the pstats module, the difference between the time spent in a function itself and the time including everything it calls, profiling one part of a program instead of the whole thing, and writing your own lightweight call counters and tracers with decorators and sys.setprofile. It ends with how to turn a profile into a decision about what to change.
What a profiler measures
A profiler is a tool that records what a program does while it runs. Python's standard library includes cProfile, a deterministic profiler: it hooks into the interpreter and records every function call and return, so its call counts are exact. The alternative is a sampling profiler, such as py-spy or Scalene, which interrupts the program many times a second and notes which function is running. Sampling profilers add very little overhead and can attach to a program that is already running; deterministic profilers give exact counts but slow the program down while they watch, sometimes by a factor of two or more.
For every function, cProfile reports four main numbers. ncalls is how many times the function was called. tottime is the total time spent inside the function itself, not counting the functions it called. cumtime is the cumulative time: time inside the function plus everything it called. percall appears twice, as tottime divided by ncalls and as cumtime divided by the number of primitive calls. The distinction between tottime and cumtime is the key to reading a profile, and the next sections come back to it.
Profiling the month-end report
Here is a simplified version of Anita's report. It reads sale lines, looks up each sale's coffee by scanning the product list, adds tax and builds the summary table. The profile is run with cProfile.run(), which takes a statement as a string, and the output is sorted by cumulative time so the most expensive call paths come first.
import cProfile, io, pstats, random

rnd = random.Random(7)
PRODUCTS = [{"sku": f"RC-{n}", "name": f"Coffee {n}", "price": 18 + n % 5} for n in range(101, 701)]
SALES = [(f"RC-{rnd.randint(101, 700)}", rnd.randint(1, 3)) for _ in range(20_000)]

def find_product(sku):
    for p in PRODUCTS:                 # scans the list every time
        if p["sku"] == sku:
            return p

def line_total(sku, qty):
    return round(find_product(sku)["price"] * qty * 1.05, 2)

def build_report(sales):
    totals = {}
    for sku, qty in sales:
        totals[sku] = totals.get(sku, 0) + line_total(sku, qty)
    return totals

profiler = cProfile.Profile()
profiler.enable()
report = build_report(SALES)
profiler.disable()

out = io.StringIO()
pstats.Stats(profiler, stream=out).sort_stats("cumulative").print_stats(5)
print(out.getvalue()[:900]) 80002 function calls in 0.235 seconds
Ordered by: cumulative time
List reduced from 6 to 5 due to restriction <5>
ncalls tottime percall cumtime percall filename:lineno(function)
1 0.009 0.009 0.235 0.235 <string>:15(build_report)
20000 0.011 0.000 0.222 0.000 <string>:12(line_total)
20000 0.203 0.000 0.203 0.000 <string>:7(find_product)
20000 0.007 0.000 0.007 0.000 {built-in method builtins.round}
20000 0.004 0.000 0.004 0.000 {method 'get' of 'dict' objects}The output starts with a total, how many function calls were made and how long they took, then a table. The interesting rows are build_report, line_total and find_product. Each was called a predictable number of times: build_report once, line_total and find_product once per sale. The column that stands out is tottime for find_product: almost all the time is spent inside that one function, scanning the product list. line_total and build_report have large cumtime only because they call find_product.
tottime versus cumtime
Reading a profile means moving between the two time columns. Sorting by cumtime shows the call paths that are expensive overall. The function at the top, often main() or the outermost function, always has the largest cumtime, because everything happens inside it, so cumtime alone does not point at the culprit. Sorting by tottime shows where the processor is actually busy. A function with large tottime is doing heavy work itself; a function with large cumtime but small tottime is merely calling something expensive.
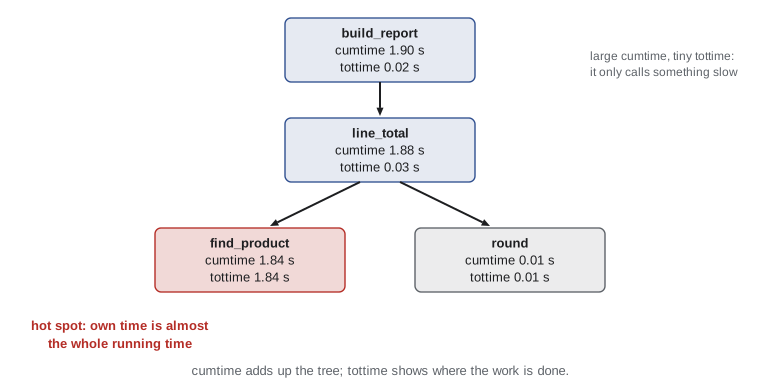
In Jordan's profile, find_product has a tottime close to the whole running time and is called 20,000 times. Two fixes are possible: make each call cheaper, or make fewer calls. Making it cheaper means replacing the list scan with a dictionary lookup built once. Making fewer calls would mean caching results for repeated skus. Both are covered later in the course; the profile has already done its job by pointing at the right place.
import pstats, cProfile, io

def find_product(sku):                                # pretend: an expensive scan
    t = 0
    for i in range(3000):
        t += i
    return t
def line_total(sku, qty): return find_product(sku) * qty
def build_report(sales): return [line_total(s, q) for s, q in sales]

pr = cProfile.Profile()
pr.runcall(build_report, [("RC-101", 2)] * 2000)
stats = pstats.Stats(pr)
rows = []
for (filename, line, func), (cc, nc, tt, ct, callers) in stats.stats.items():
    if func in ("find_product", "line_total", "build_report"):
        rows.append((func, nc, tt, ct))
for func, calls, tottime, cumtime in sorted(rows, key=lambda r: -r[2]):
    share = tottime / max(cumtime, 1e-12)
print(f"{func:13} calls={calls:5} own time is {'most' if share > 0.5 else 'little'} of its cumulative time")find_product calls= 2000 own time is most of its cumulative time line_total calls= 2000 own time is little of its cumulative time build_report calls= 1 own time is little of its cumulative time
Running cProfile from the command line
You do not have to change any code to profile a script. python -m cProfile runs a script under the profiler and prints the table when it finishes; the -s option chooses the sort column and -o saves the raw results to a file for later analysis. Saved profiles can be loaded with pstats, compared between versions, or explored visually with tools such as SnakeViz, which draws the call tree as nested rectangles whose size shows time.
> python -m cProfile -s tottime month_end.py | head -12
         120046 function calls in 1.914 seconds

   Ordered by: internal time

   ncalls  tottime  percall  cumtime  percall filename:lineno(function)
    20000    1.838    0.000    1.838    0.000 month_end.py:9(find_product)
    20000    0.031    0.000    1.882    0.000 month_end.py:14(line_total)
        1    0.019    0.019    1.901    1.901 month_end.py:17(build_report)
    20000    0.009    0.000    0.009    0.000 {built-in method builtins.round}

> python -m cProfile -o report.prof month_end.py
> python -c "import pstats; pstats.Stats('report.prof').sort_stats('cumulative').print_stats(10)"
The header line is worth reading: 120,046 function calls in under two seconds is a large number of calls for a report over 20,000 sales, about six per sale. Excess calls are a common smell in profiles, because every Python function call has a fixed overhead. Tight loops that call a tiny helper function millions of times sometimes speed up just by inlining the helper or using a built-in.
Profiling just one part
Profiling a whole program can bury the interesting part under start-up costs and unrelated work. cProfile.Profile objects can be switched on and off around the code you care about with enable() and disable(), or used as a context manager since Python 3.8. That keeps the profile focused: Jordan profiles the matching loop only, not the file reading and the printing, which he already knows are cheap.
import cProfile, pstats, io

def tidy(names):
    return sorted({n.strip().title() for n in names})

names = [" sunrise blend", "ethiopia guji ", "Sunrise Blend", "decaf swiss water"] * 5000

with cProfile.Profile() as pr:          # profile only this block
    result = tidy(names)

print(result)
s = io.StringIO()
pstats.Stats(pr, stream=s).sort_stats("tottime").print_stats(3)
lines = [l for l in s.getvalue().splitlines() if "function calls" in l]
print(lines[0].strip().split(" in ")[0])['Decaf Swiss Water', 'Ethiopia Guji', 'Sunrise Blend'] 40004 function calls
Counting calls with a decorator
Sometimes you only need to know how often something happens, and an exact count from your own code is simpler than a full profile. A decorator that wraps a function and counts its calls is a few lines, uses the techniques from PYTH-102, and gives the same result on every run and every machine. Jordan uses one to check his suspicion that find_product is called far more often than there are distinct skus.
import functools

def counted(func):
    @functools.wraps(func)
    def wrapper(*args, **kwargs):
        wrapper.calls += 1
        return func(*args, **kwargs)
    wrapper.calls = 0
    return wrapper

PRODUCTS = {f"RC-{n}": 18 + n % 5 for n in range(101, 107)}

@counted
def find_price(sku):
    return PRODUCTS[sku]

sales = [("RC-101", 2), ("RC-104", 1), ("RC-101", 1), ("RC-106", 3)] * 250
total = sum(find_price(sku) * qty for sku, qty in sales)
print("total:", total)
print("find_price calls:", find_price.calls)
print("distinct skus:", len({s for s, _ in sales}))total: 34000 find_price calls: 1000 distinct skus: 3
A thousand calls for three distinct skus means 997 of the calls recompute an answer that was already known. That is a strong hint that caching, the subject of lesson 10, would help here. Counters like this also make good regression tests: a test can assert that a function is called no more than a certain number of times, so a later change that reintroduces a repeated lookup fails the test suite.
Try it yourself
A call-counting decorator
Write a decorator counted that adds a calls attribute to the wrapped function, starting at 0 and increasing by one on every call. The wrapped function must still return the original result and keep its __name__ (use functools.wraps).
Also give the wrapper a reset() function attribute that sets calls back to 0.
import functools

def counted(func):
    return func

@counted
def double(x):
    return 2 * x

print(double(4), double.calls)
Tracing calls with sys.setprofile
Python exposes the same hook that cProfile uses. sys.setprofile(func) installs a function that the interpreter calls on every function call and return, with the frame and an event name such as 'call' or 'return'. A few lines are enough for a custom profiler that counts calls by function name across a whole block of code, without decorating anything. sys.settrace is similar but also fires for every line, which is what debuggers and coverage tools use. Both slow the program down considerably, so they are tools for investigation, not for production.
import sys
from collections import Counter

calls = Counter()

def tracer(frame, event, arg):
    if event == "call":
        calls[frame.f_code.co_name] += 1

def price(sku): return 20
def tax(amount): return round(amount * 0.05, 2)
def line(sku, qty):
    amount = price(sku) * qty
    return amount + tax(amount)

sys.setprofile(tracer)
total = sum(line("RC-101", q) for q in range(1, 101))
sys.setprofile(None)                       # always switch it off again

print("total:", total)
for name in ("line", "price", "tax"):
print(f"{name}: {calls[name]} calls")total: 106050.0 line: 100 calls price: 100 calls tax: 100 calls
Try it yourself
Find the hot spot
A profile has been turned into a list of rows (name, ncalls, tottime, cumtime). Write hot_spot(rows) that returns the name of the function with the largest tottime.
Then write share(rows, name) returning that function's tottime as a fraction of the total tottime of all rows, rounded to 2 decimal places.
ROWS = [
    ('build_report', 1, 0.02, 1.90),
    ('line_total', 20000, 0.03, 1.88),
    ('find_product', 20000, 1.84, 1.84),
    ('round', 20000, 0.01, 0.01),
]

def hot_spot(rows):
    return rows[0][0]

def share(rows, name):
    return 0

print(hot_spot(ROWS))
From profile to decision
A profile is evidence, and evidence needs interpreting. Some findings point straight at a fix: one function with most of the tottime, called far more often than expected. Others need more thought. If time is spread evenly over many small functions, there is no single hot spot and a better algorithm for the whole task may be needed. If most time is in built-in functions such as sorted or json.loads, the fix is to call them less often, not to rewrite them. If most time is spent waiting, in socket reads or file opens, the program is I/O-bound and the cure is concurrency, which the middle of this course covers.
Jordan writes down what the profile tells him before changing anything: find_product takes 97 parts in 100 of the report's time because it scans 600 products for each of 20,000 sales. His plan is to replace the scan with a dictionary built once, which the next lesson does. He also writes down the expected effect, using Amdahl's law from lesson 1: with 97 parts in 100 removed almost entirely, the report should become about thirty times faster, and the measurement afterwards will tell him whether it did.
Common mistakes
MistakeOptimizing the function with the largest cumtime, such as main().
InsteadLook at tottime to find where the work is actually done.
MistakeProfiling with tiny test data.
InsteadProfile with realistic data; hot spots often appear only at scale.
MistakeTreating profiled times as real times.
InsteadA deterministic profiler slows the program; use it to compare parts, then time the real program separately.
MistakeLeaving sys.setprofile or sys.settrace switched on.
InsteadAlways call sys.setprofile(None) when the measurement is done, ideally in a finally block.
MistakeIgnoring call counts.
InsteadA function called far more often than expected is often the real problem.
MistakeChanging several things at once after profiling.
InsteadChange one thing, measure again, and keep the change only if it helps.
Summary and key terms
- A profiler records how often each function runs and how much time it takes.
- cProfile is a deterministic profiler in the standard library; sampling profilers such as py-spy add less overhead.
- tottime is time inside a function itself; cumtime includes everything it calls.
- pstats sorts and prints profile data, and saved profiles can be compared or visualized.
- python -m cProfile -s tottime script.py profiles a script without changing it.
- Decorators and sys.setprofile give exact, deterministic call counts.
- A profile points at the change to make; measurement afterwards confirms it worked.
- profiler
- A tool that records where a program spends its time.
- deterministic profiler
- A profiler that records every call and return, giving exact counts.
- sampling profiler
- A profiler that periodically records which function is running.
- ncalls
- The number of times a function was called.
- tottime
- Time spent inside a function, excluding the functions it called.
- cumtime
- Time spent in a function including all the functions it called.
- hot spot
- The part of a program where most of the time is spent.
- flame graph
- A chart of stacked bars where width shows time spent in each call path.
- sys.setprofile
- A hook that calls a function on every Python function call and return.
Practice problems
Work each problem on paper first, then reveal the answer to check.
main() has cumtime 10 s and tottime 0.01 s. What does that tell you?
Show answer
main itself does almost nothing; the time is in functions it calls.
A helper with tottime 0.2 s is called 2,000,000 times. What might help?
Show answer
Reducing the number of calls, inlining it or using a built-in, since per-call overhead dominates.
How do you profile a script called nightly.py sorted by own time?
Show answer
python -m cProfile -s tottime nightly.py
Why do counting decorators make good regression tests?
Show answer
They give exact counts on every run, so a test can fail if a function is called more often than expected.
Profile results show most time in socket.recv. What kind of slowness is this?
Show answer
I/O-bound waiting on the network; concurrency, not faster code, is the fix.
What is the difference between sys.setprofile and sys.settrace?
Show answer
setprofile fires on calls and returns; settrace also fires for every line.
Lesson quiz · 5 questions
Score 60% or more to complete this lesson.
Create a free account to save your progress, take quizzes and earn a certificate.