
PYTH-250 · Lesson 1 of 12 · 26 min
Measuring before optimizing
▶ Video coming soon A video version of this lesson is on the way.
Ridgeline Coffee Roasters has grown into its software. The tools Jordan Reyes wrote in PYTH-101 and turned into the ridgeline package in PYTH-102 now run every day, and some of them have become slow. Anita Shah's month-end sales report, which took two seconds when the shop sold six coffees to a handful of regulars, now takes several minutes on three years of sales. Kai Nakamura's roaster records a temperature every second, so a busy week produces hundreds of thousands of readings, and the script that draws his roast curves makes him wait. Theo Barnes asks for shipping quotes one order at a time, and on a Monday with two hundred weekend orders that loop runs for well over a minute.
Jordan's first instinct is to start rewriting things to make them faster. This course begins by resisting that instinct. Speeding up a program is an engineering task with a method: decide what fast enough means, measure where the time actually goes, change the one thing that matters most, and measure again. This lesson covers that method: performance goals, timing code properly with time.perf_counter and timeit, counting the work a program does, the big-O vocabulary for how work grows with input size, and Amdahl's law, which tells you how much any single improvement can possibly help.
Fast enough is a requirement, not a feeling
Before changing any code, write down what you are trying to achieve, in numbers. Performance has several dimensions, and improving one can hurt another. Latency is how long one request or task takes: how long Theo waits for one shipping quote, or how long a product page takes to show. Throughput is how much work is done per unit of time: how many orders an hour the shop can process, or how many roast readings a second the analysis can handle. Resource use is how much memory, processor time, disk or network a task consumes. A change that makes one report faster by loading everything into memory can also make it use four times the memory.
A useful performance goal names the task, the size of the input and the limit. Ridgeline's goals, agreed with Rosa Delgado at a Monday meeting, look like this:
- The month-end report must finish in under 10 seconds on three years of sales, about 150,000 sale lines.
- The product page stock check must answer in under 50 milliseconds.
- Monday shipping quotes for 200 orders must finish in under 15 seconds.
- Kai's roast-curve analysis for one week of readings must finish in under 5 seconds.
Look at what these goals leave out. They do not ask for the code to be as fast as possible, which would never end. They say when the work is done. A report that takes 8 seconds meets its goal, and spending a week to get it to 2 seconds is a poor use of Jordan's time when the Monday quotes still take over a minute. Goals also tell you when to stop: once each task meets its limit, the remaining time is better spent on features and correctness.
Why guessing fails
Programmers are notoriously bad at guessing where their programs spend time. The slow part is often not the code that looks complicated but an innocent line inside a loop that runs a million times, or a call to a library function that hides a slow operation. Donald Knuth's often-quoted warning is that premature optimization is the root of much evil in programming: effort spent speeding up code that does not matter makes the program harder to read and maintain, and gains nothing.
Jordan learned this the hard way. Convinced that the month-end report was slow because of the f-string formatting in the final table, he spent an afternoon replacing it with string concatenation. The report took exactly as long as before, because the formatting ran once per coffee, six times in total, while the real problem was elsewhere. The rule for this course is simple: no optimization without a measurement that shows the problem, and no optimization is finished until a second measurement shows the improvement.
Timing code with time.perf_counter
The simplest measurement is wall-clock time: note the time before a piece of code runs, note it after, and subtract. Python's time.perf_counter() returns a high-resolution clock value in seconds, meant exactly for this. Its value on its own means nothing; only the difference between two readings matters. Unlike time.time(), it is not affected by changes to the system clock.
import time

def slow_total(n):
    total = 0
    for i in range(n):
        total += i * i
    return total

start = time.perf_counter()
result = slow_total(200_000)
elapsed = time.perf_counter() - start
print("result:", result)
print(f"took {elapsed:.4f} seconds")result: 2666646666700000 took 0.0097 seconds
Run this a few times and the printed time changes, even though the code does exactly the same work. Timing measurements are noisy. Other programs share the processor, the operating system interrupts your program, caches warm up after the first run, and in a browser the page itself competes for time. One measurement is a rough indication, not a fact. Professional measurement repeats the work many times and looks at the best or the typical result.
There is also a scale problem. A function that takes a few microseconds cannot be timed reliably with one call, because the clock resolution and the overhead of calling perf_counter itself are of the same size. The fix is to run the code many times in a loop and divide.
The timeit module
The standard library's timeit module does careful repeated timing for you. timeit.timeit() runs a statement a given number of times and returns the total time; timeit.repeat() does that several times so you can see the spread. It also switches off the garbage collector during the measurement by default, which removes one source of noise. The usual practice is to take the minimum of the repeated results, because noise only ever adds time: the fastest run is the closest to the true cost of the code.
import timeit

codes = [f"RC-{n}" for n in range(1000)]
as_set = set(codes)

list_times = timeit.repeat(lambda: "RC-999" in codes, number=2000, repeat=5)
set_times = timeit.repeat(lambda: "RC-999" in as_set, number=2000, repeat=5)
best_list = min(list_times) / 2000
best_set = min(set_times) / 2000
print(f"list membership: {best_list * 1e6:.2f} microseconds")
print(f"set membership:  {best_set * 1e6:.3f} microseconds")
print("set is faster:", best_set < best_list)list membership: 6.27 microseconds set membership: 0.030 microseconds set is faster: True
From the command line, python -m timeit runs a quick experiment without writing a script, and in Jupyter notebooks the %timeit magic does the same. Whichever form you use, the comparison is what matters: a list membership test for the last of a thousand codes checks every element, while a set finds it almost instantly. The exact numbers depend on the machine, but the ratio between them is stable and meaningful.
> python -m timeit -s "codes = [f'RC-{n}' for n in range(1000)]" "'RC-999' in codes"
20000 loops, best of 5: 11.2 usec per loop
> python -m timeit -s "codes = {f'RC-{n}' for n in range(1000)}" "'RC-999' in codes"
10000000 loops, best of 5: 22.6 nsec per loop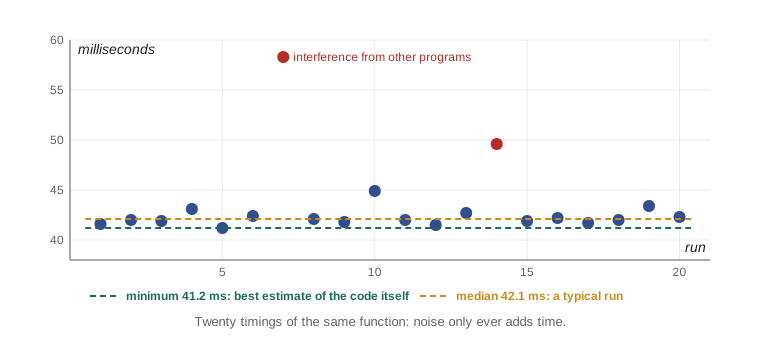
Counting work instead of seconds
Seconds depend on the machine, the load and the phase of the moon. The amount of work an algorithm does does not. Counting operations, such as comparisons, loop iterations or dictionary lookups, gives a measurement that is the same on every run and every computer. It is also how you compare approaches before running them on real data. Here Jordan counts how many comparisons it takes to find a sale's coffee by searching a list, against looking it up in a dictionary.
coffees = [(f"RC-{n}", f"Coffee {n}") for n in range(101, 101 + 600)]

def find_in_list(code, items):
    comparisons = 0
    for c, name in items:
        comparisons += 1
        if c == code:
            return name, comparisons
    return None, comparisons

index = dict(coffees)                    # built once: code -> name

for code in ["RC-101", "RC-400", "RC-700"]:
    name, steps = find_in_list(code, coffees)
    print(f"{code}: list search took {steps} comparisons, dict lookup 1 hash step -> {index[code]}")

sales = 150_000
avg = sum(find_in_list(c, coffees)[1] for c, _ in coffees) / len(coffees)
print(f"average list search: {avg:.1f} comparisons")
print(f"for {sales:,} sale lines: about {sales * avg:,.0f} comparisons vs {sales:,} lookups")RC-101: list search took 1 comparisons, dict lookup 1 hash step -> Coffee 101 RC-400: list search took 300 comparisons, dict lookup 1 hash step -> Coffee 400 RC-700: list search took 600 comparisons, dict lookup 1 hash step -> Coffee 700 average list search: 300.5 comparisons for 150,000 sale lines: about 45,075,000 comparisons vs 150,000 lookups
The count makes the problem plain. Matching each of 150,000 sale lines to its coffee by searching a list of 600 products costs about 45 million comparisons, while a dictionary does 150,000 lookups. No timing noise can hide a factor of three hundred. This is the kind of evidence that should drive an optimization.
Big-O: how work grows
Counting work for one input size is useful; knowing how the count grows as the input grows is better. Big-O notation describes that growth, ignoring constant factors and small terms. A list search is O(n): double the list and the work doubles. A dictionary or set lookup is O(1) on average: the work stays the same no matter how many items there are. Sorting with Python's built-in sort is O(n log n). Checking every pair of items, as a naive duplicate finder does, is O(n²): double the input and the work quadruples.
import math

print(f"{'n':>9} {'log n':>7} {'n':>9} {'n log n':>11} {'n squared':>16}")
for n in [10, 1_000, 100_000, 1_000_000]:
print(f"{n:>9,} {math.log2(n):>7.1f} {n:>9,} {n * math.log2(n):>11,.0f} {n * n:>16,}") n log n n n log n n squared
10 3.3 10 33 100
1,000 10.0 1,000 9,966 1,000,000
100,000 16.6 100,000 1,660,964 10,000,000,000
1,000,000 19.9 1,000,000 19,931,569 1,000,000,000,000The table shows why algorithm choice dominates everything else at scale. At ten items every approach is instant. At a million items, an O(n log n) sort does about twenty million steps, while an O(n²) pairwise check does a trillion, which at a hundred million simple steps a second is close to three hours. Rewriting an O(n²) algorithm as O(n log n) or O(n) is worth more than any amount of fine-tuning of the inner loop.
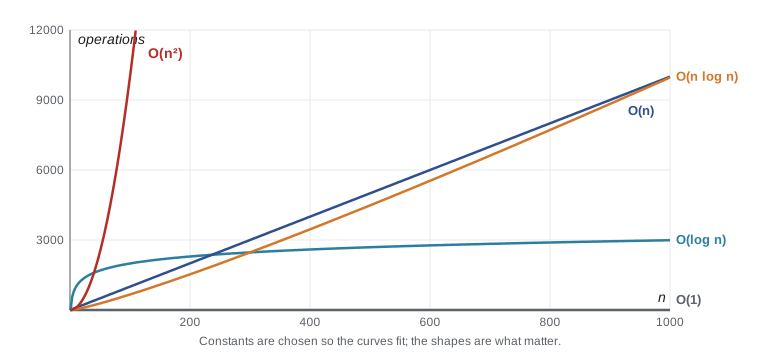
Big-O hides constants, and constants matter at small sizes. A clever O(n log n) algorithm can be slower than a simple O(n²) one for ten items. Python's built-in functions, written in C, also have small constants, which is why sum(), sorted() and set operations usually beat equivalent hand-written loops. Big-O tells you how a program will behave as the data grows; measurement tells you how it behaves today.
Amdahl's law: the limit of any single fix
Suppose Jordan's profiling shows that the month-end report spends 80 parts in 100 of its time matching sales to coffees and the rest reading the file and printing. Even if he made the matching infinitely fast, the report could only become five times faster, because the reading and printing would still take their 20 parts. This is Amdahl's law: the overall speedup from improving one part of a program is limited by the fraction of time that part takes.
If a fraction p of the running time is sped up by a factor s, the new time is (1 - p) + p / s of the old time, and the overall speedup is 1 / ((1 - p) + p / s). The law applies to every kind of optimization, and it is especially important for parallel computing, where s is the number of processors: a program that is 10 parts in 100 sequential can never run more than ten times faster, no matter how many cores it uses.
def amdahl(p, s):
    """Overall speedup when a fraction p of the time is made s times faster."""
    return 1 / ((1 - p) + p / s)

for p in [0.5, 0.8, 0.95]:
    row = [f"{amdahl(p, s):5.2f}" for s in (2, 4, 10, 1000)]
    print(f"p = {p:.2f}: speedups for s = 2, 4, 10, 1000 ->", "  ".join(row))

print("matching 80 of 100 parts, made 50x faster:", round(amdahl(0.8, 50), 2))p = 0.50: speedups for s = 2, 4, 10, 1000 -> 1.33 1.60 1.82 2.00 p = 0.80: speedups for s = 2, 4, 10, 1000 -> 1.67 2.50 3.57 4.98 p = 0.95: speedups for s = 2, 4, 10, 1000 -> 1.90 3.48 6.90 19.63 matching 80 of 100 parts, made 50x faster: 4.63
The numbers show the practical lesson. Speeding up a part that takes half the time by a factor of a thousand gives barely a factor of two overall. Speeding up the part that takes 95 parts in 100 by a factor of ten gives almost seven. Always work on the biggest slice of time first, and expect diminishing returns as each slice shrinks and the others become the bottleneck.
Try it yourself
Amdahl's law calculator
Write amdahl(p, s) returning the overall speedup when a fraction p of the running time is made s times faster: 1 / ((1 - p) + p / s).
Then write max_speedup(p), the limit as s grows without bound, which is 1 / (1 - p). For p == 1 return float("inf").
def amdahl(p, s):
    return p * s

def max_speedup(p):
    return 0

print(round(amdahl(0.8, 50), 2))
Measure the right thing
A measurement is only useful if it reflects real use. Timing the month-end report on a test file of ten sales tells Jordan nothing about three years of sales, because the slow part grows with the data. Good benchmarks use realistic input sizes, include the slow cases as well as the typical ones, and time the whole task a user waits for, not just the function that is easy to time. They also check that the result is still correct: a faster program that gives the wrong total is not an optimization.
It also pays to keep the measurement. A small benchmark script, saved in the repository next to the tests, lets anyone rerun the measurement after a change and catch a performance regression, a change that accidentally makes things slower. Jordan adds bench_report.py to the ridgeline repository: it generates a realistic year of fake sales with a fixed random seed, times the report three times and prints the best time and the total, so the result can be compared before and after every change.
import random

def fake_sales(n, seed=2026):
    """Realistic but reproducible sale lines: (sku, qty)."""
    rnd = random.Random(seed)
    skus = [f"RC-{c}" for c in range(101, 107)]
    weights = [30, 10, 18, 6, 8, 28]          # best sellers sell more
    return [(rnd.choices(skus, weights)[0], rnd.randint(1, 3)) for _ in range(n)]

sales = fake_sales(10_000)
print(len(sales), "sales, first three:", sales[:3])
print("same data every time:", fake_sales(5) == fake_sales(5))
totals = {}
for sku, qty in sales:
    totals[sku] = totals.get(sku, 0) + qty
print(dict(sorted(totals.items())))10000 sales, first three: [('RC-101', 3), ('RC-106', 3), ('RC-106', 1)]
same data every time: True
{'RC-101': 6105, 'RC-102': 2016, 'RC-103': 3453, 'RC-104': 1261, 'RC-105': 1521, 'RC-106': 5531}Try it yourself
Count the comparisons
Write linear_steps(items, target) that searches the list from the start and returns the number of comparisons made before finding target, or len(items) if it is not there.
Then write binary_steps(items, target) for a sorted list: repeatedly compare with the middle item of the remaining range and halve it, counting one comparison per middle item looked at, until found or the range is empty. Return the count.
def linear_steps(items, target):
    return 1

def binary_steps(items, target):
    return 1

data = list(range(0, 2000, 2))
print(linear_steps(data, 1998), binary_steps(data, 1998))
A method for every optimization
The rest of this course follows the same loop for every change, and it is worth stating plainly. First, set a goal in numbers. Second, measure the current behavior with a realistic benchmark. Third, profile to find where the time goes, the subject of the next lesson. Fourth, change the single biggest cost, preferring a better algorithm or data structure over clever tricks. Fifth, check the results are still correct and measure again. Stop when the goal is met.
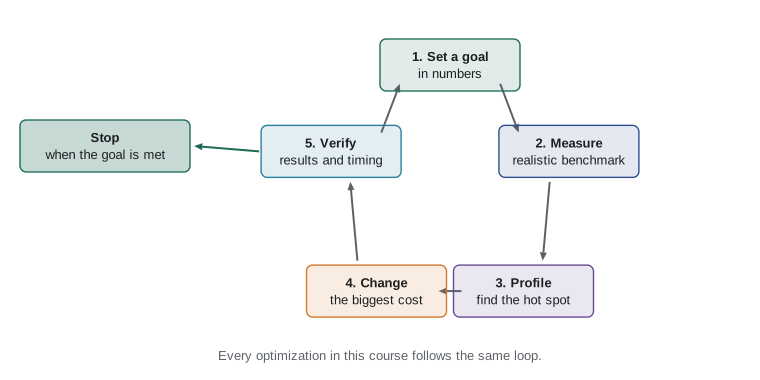
The techniques in later lessons, threads, processes, asyncio, NumPy and caching, are all tools for step four. Each suits a particular kind of slowness. Code that waits for networks and disks needs concurrency; code that crunches numbers needs better algorithms, vectorized libraries or more processors; code that repeats the same work needs caching. Knowing which kind of slowness you have is the job of measurement.
Common mistakes
MistakeOptimizing code that looks slow without measuring first.
InsteadProfile and time the real task, then change the part that takes the most time.
MistakeTrusting a single timing run.
InsteadRepeat the measurement and compare the minimum or median of several runs.
MistakeTiming a few microseconds of code with one call.
InsteadUse timeit to run it many times and divide.
MistakeBenchmarking with tiny test data.
InsteadUse realistic input sizes, because slow parts often grow with the data.
MistakeExpecting a 10-times speedup from improving a part that takes a third of the time.
InsteadApply Amdahl's law: the other two thirds limit the gain to 1.5 times.
MistakeMaking the code faster but forgetting to check the results.
InsteadCompare outputs before and after; a wrong answer is never an optimization.
Summary and key terms
- Performance goals name a task, an input size and a limit, and tell you when to stop optimizing.
- Latency, throughput and resource use are different dimensions; improving one can hurt another.
- time.perf_counter() measures elapsed time; single measurements are noisy.
- timeit runs code many times and repeats the measurement; the minimum is the cleanest estimate.
- Counting operations gives machine-independent measurements and exposes algorithmic problems.
- Big-O describes how work grows: O(1), O(log n), O(n), O(n log n), O(n²).
- Amdahl's law: speeding up a fraction p by s gives an overall speedup of 1 / ((1 - p) + p / s).
- latency
- The time one task or request takes.
- throughput
- The amount of work completed per unit of time.
- benchmark
- A repeatable measurement of a program on realistic input.
- time.perf_counter
- A high-resolution clock for measuring elapsed time.
- timeit
- A standard module that times small pieces of code by running them many times.
- big-O notation
- A description of how the work an algorithm does grows with the input size.
- Amdahl's law
- The limit on overall speedup set by the fraction of time an improvement affects.
- performance regression
- A change that accidentally makes a program slower.
- premature optimization
- Making code faster before knowing that it matters, usually at the cost of clarity.
Practice problems
Work each problem on paper first, then reveal the answer to check.
Why is the minimum of several timeit runs a better estimate than the average?
Show answer
Noise from other programs only adds time, so the fastest run is closest to the cost of the code itself.
A task takes 60 seconds, 15 of them in a function you make 3 times faster. What is the new time?
Show answer
45 + 5 = 50 seconds, a speedup of 1.2.
What is the largest possible speedup for a program that is 25 parts in 100 sequential?
Show answer
1 / 0.25 = 4 times.
Which grows faster, n log n or n squared, and by how much at n = 1,000?
Show answer
n squared: 1,000,000 against about 10,000, so about 100 times more.
Write a performance goal for Mei's loyalty lookup at the till.
Show answer
For example: looking up a customer by phone number must answer in under 200 milliseconds with 20,000 members.
Why does a benchmark use a fixed random seed?
Show answer
So that it generates the same data every run and results can be compared fairly.
Lesson quiz · 5 questions
Score 60% or more to complete this lesson.
Create a free account to save your progress, take quizzes and earn a certificate.