
PHYS-481 · Lesson 11 of 12 · 24 min
The aurora and geomagnetic storms
On the night of 10 May 2024, people across the United States, as far south as Florida and Texas, photographed red and green aurora overhead, many of them for the first time in their lives. A cluster of large sunspots, NOAA active region 3664, had launched a series of coronal mass ejections over the preceding days, and their arrival produced the strongest geomagnetic storm since 2003, reaching the top G5 level on NOAA's scale. This lesson explains how such a storm works: how solar wind energy enters the magnetosphere through magnetic reconnection, how the magnetosphere stores and releases it in substorms, how energetic electrons excite the atoms of the upper atmosphere to produce auroral light, and how storm intensity is measured by the Kp and Dst indices and modeled with a simple equation for the ring current.
Reconnection and the Dungey cycle
In ideal magnetohydrodynamics the magnetic field is frozen into a perfectly conducting plasma, and field lines belonging to the solar wind could never join those of the Earth. In thin current sheets, however, where oppositely directed fields meet, the frozen-in condition breaks down and field lines can break and reconnect, converting magnetic energy into heat and fast flows. James Dungey proposed in 1961 that this happens at the dayside magnetopause when the interplanetary field points southward, antiparallel to the Earth's northward field there. The reconnected field lines, now connected to the solar wind at one end and the Earth at the other, are carried over the poles by the solar wind and stretched into the magnetotail. There they reconnect again, closing the field lines, which return toward the Earth and flow around to the dayside. This circulation, the Dungey cycle, takes a few hours, and it drives a two-cell convection of plasma across the polar ionosphere that the SuperDARN radars observe directly.
The rate of energy transfer depends mainly on the solar wind's speed and the strength of the southward field. The product \(vB_s\), where \(B_s\) is the southward component, is the dawn-to-dusk electric field of the solar wind, \(\mathbf{E} = -\mathbf{v}\times\mathbf{B}\), and a fraction of it maps along open field lines into the polar ionosphere. A solar wind of 400 km/s with a 5 nT southward field gives \(vB_s = 2\) mV/m; a coronal mass ejection at 800 km/s with a 30 nT southward field gives 24 mV/m. When the interplanetary field points north, reconnection at the dayside is weak and the magnetosphere is quiet, however fast the wind.
Substorms
The magnetotail does not release energy smoothly. During an hour or so of southward field, the tail accumulates magnetic flux and its current sheet thins: this is the growth phase of a substorm. Then, suddenly, reconnection begins near 20 to 30 Earth radii down the tail, field lines snap back toward the Earth, and part of the cross-tail current is diverted along field lines into the ionosphere. On the ground the aurora, quiet arcs until then, suddenly brightens near midnight and expands poleward and westward in bright, rapidly moving forms: the expansion phase. Over the next hour it subsides in the recovery phase. Each substorm releases about \(10^{14}\) to \(10^{15}\) J. During a storm, substorms recur every few hours. NASA's THEMIS mission, launched in 2007 with five spacecraft and a chain of all-sky cameras and magnetometers across Canada and Alaska, was designed to time the onset of substorms and find where in the tail they begin.
How the aurora glows
Auroral light is produced by electrons, typically of 1 to 10 keV, accelerated downward along field lines above the auroral zone by electric fields parallel to the magnetic field, at a few thousand kilometers altitude. As they plunge into the thermosphere, they collide with atoms and molecules, ionizing and exciting them. Each excited species returns to its ground state by emitting photons at characteristic wavelengths. The program lists the main emissions.
import math, random
h = 6.62607015e-34; c = 2.99792458e8; eV = 1.602176634e-19
for name, lam, alt in [("atomic oxygen, green", 557.7, "about 100-150 km"), ("atomic oxygen, red", 630.0, "above about 200 km"),
                       ("ionized nitrogen molecule, blue-violet", 427.8, "about 100 km"), ("nitrogen molecule, deep red lower border", 670.0, "below about 100 km")]:
    print(f"{name:40s} {lam:6.1f} nm  {h * c / (lam * 1e-9) / eV:4.2f} eV  {alt}")

# How far away an aurora can be seen: horizon distance for an emission at height H
RE = 6371.0
for H in (100, 200, 300, 400):
    d = RE * math.acos(RE / (RE + H))
    print(f"aurora at {H} km is above the horizon out to {d:5.0f} km ({d / 111.2:.1f} deg of latitude)")

# Rule of thumb for the equatorward edge of the night-side oval: about 66 - 2 Kp degrees magnetic latitude
for kp in (0, 3, 5, 7, 9):
    edge = 66 - 2 * kp
    print(f"Kp {kp}: overhead edge near magnetic latitude {edge} deg, visible on the northern horizon to about {edge - 6} deg")

# Burton model of the ring current index: dDst*/dt = Q(VBs) - Dst*/tau
def Q(VBs):           # VBs in mV/m, result in nT per hour
    return -4.4 * (VBs - 0.5) if VBs > 0.5 else 0.0
def storm(peak_VBs, hours_on, tau=7.7, seed=481):
    rnd = random.Random(seed)
    dst, out = 0.0, []
    for hr in range(72):
        drive = peak_VBs * math.exp(-((hr - 12 - hours_on / 2) / (hours_on / 2)) ** 2) + rnd.uniform(-0.5, 0.5)
        dst += Q(max(drive, 0.0)) - dst / tau
        out.append(dst)
    return out
for label, vbs, dur in [("moderate storm", 8.0, 6), ("large storm", 20.0, 10), ("extreme storm", 26.0, 14)]:
    d = storm(vbs, dur)
    i = min(range(72), key=lambda j: d[j])
    rec = next((j for j in range(i, 72) if d[j] > d[i] / 2), None)
print(f"{label:15s} peak VBs {vbs:4.0f} mV/m: minimum Dst {d[i]:6.0f} nT at hour {i}; half recovered after {rec - i} h")atomic oxygen, green 557.7 nm 2.22 eV about 100-150 km atomic oxygen, red 630.0 nm 1.97 eV above about 200 km ionized nitrogen molecule, blue-violet 427.8 nm 2.90 eV about 100 km nitrogen molecule, deep red lower border 670.0 nm 1.85 eV below about 100 km aurora at 100 km is above the horizon out to 1121 km (10.1 deg of latitude) aurora at 200 km is above the horizon out to 1576 km (14.2 deg of latitude) aurora at 300 km is above the horizon out to 1918 km (17.2 deg of latitude) aurora at 400 km is above the horizon out to 2201 km (19.8 deg of latitude) Kp 0: overhead edge near magnetic latitude 66 deg, visible on the northern horizon to about 60 deg Kp 3: overhead edge near magnetic latitude 60 deg, visible on the northern horizon to about 54 deg Kp 5: overhead edge near magnetic latitude 56 deg, visible on the northern horizon to about 50 deg Kp 7: overhead edge near magnetic latitude 52 deg, visible on the northern horizon to about 46 deg Kp 9: overhead edge near magnetic latitude 48 deg, visible on the northern horizon to about 42 deg moderate storm peak VBs 8 mV/m: minimum Dst -107 nT at hour 17; half recovered after 6 h large storm peak VBs 20 mV/m: minimum Dst -382 nT at hour 20; half recovered after 8 h extreme storm peak VBs 26 mV/m: minimum Dst -586 nT at hour 23; half recovered after 9 h
The bright green line at 557.7 nm comes from atomic oxygen in an excited state that lives about 0.7 s before radiating. Below about 100 km, collisions de-excite the atoms before they can emit, so the green aurora has a fairly sharp lower edge near 100 km. The red line at 630.0 nm comes from a different oxygen state that lives about 110 s; it can radiate only where collisions are rare enough, above about 200 km, and so red aurora appears at the tops of tall rays and in the great high-altitude red glows of strong storms, which are visible from far away. Blue and violet light at 427.8 nm comes from ionized molecular nitrogen, and a pink or deep red fringe at the bottom of bright, energetic aurora comes from neutral molecular nitrogen. The height of the emission depends on the electrons' energy: more energetic electrons penetrate deeper before losing their energy. The color of an aurora is therefore a kind of spectrometer for the precipitating particles. During the May 2024 storm, many people saw mostly red and pink aurora, because at mid-latitudes they were looking at high-altitude emission near their northern horizon, and because phone cameras record red more sensitively than the eye does in dim light.
The auroral oval
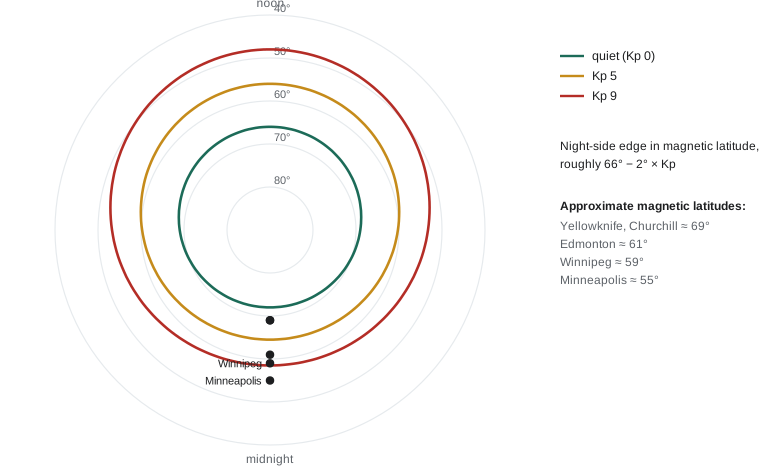
Seen from space, the aurora forms an oval around each magnetic pole, centered a few degrees toward the night side, at about 65 to 70° magnetic latitude near midnight and 75 to 80° near noon. Its footprint marks the boundary between closed field lines and the open polar cap, and the plasma sheet in the magnetotail maps along field lines to its night side. The oval was mapped first from ground observations during the International Geophysical Year of 1957 and 1958 and seen whole by the Canadian ISIS-II satellite in 1971 and by later satellite imagers. As activity increases the oval thickens and expands toward the equator. A rough rule of thumb puts its night-side equatorward edge near \(66° - 2°\times\mathrm{Kp}\) in magnetic latitude, which the program tabulates. Because the aurora is high, it can be seen near the northern horizon from several degrees of latitude farther south: emission at 200 km is above the horizon out to about 1600 km, or 14° of latitude.
The geography follows. The quiet oval lies over northern Canada and central Alaska, at magnetic latitudes near 69°. Minneapolis, at about 55° magnetic latitude, sees aurora overhead only near Kp 6 and above, but on its northern horizon in moderate storms. During the May 2024 storm, with Kp 9, the oval reached about 48° magnetic latitude, and red emission high above it was visible from magnetic latitudes near 40°, in places such as Onawa, Iowa, near 42° geographic latitude, and much farther south on photographs.
Measuring storms: Kp and Dst
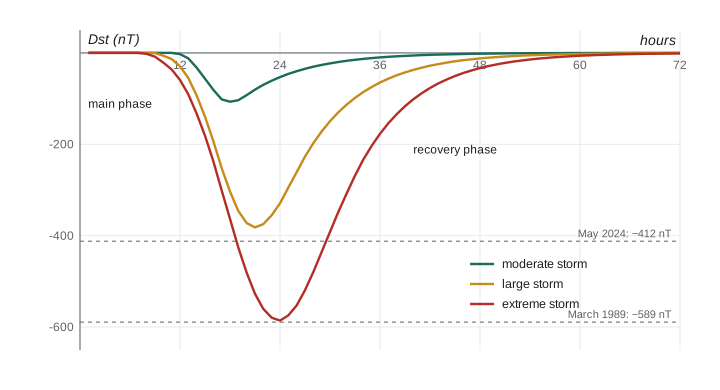
Geomagnetic activity is measured by ground magnetometers. The Kp index, introduced by Julius Bartels in 1949, is a quasi-logarithmic number from 0 to 9 computed every three hours from the range of horizontal-field disturbances at a network of mid-latitude observatories, including stations in Canada. NOAA's G-scale for geomagnetic storms maps Kp 5 to G1 (minor), 6 to G2, 7 to G3, 8 to G4 and 9 to G5 (extreme). The Dst index, computed hourly from four low-latitude observatories, measures the depression of the horizontal field at the equator caused mainly by the ring current. A moderate storm has a minimum Dst of about \(-50\) to \(-100\) nT, an intense storm below \(-100\) nT and a great storm below \(-250\) nT. The March 1989 storm reached \(-589\) nT, the lowest of the space age; the May 2024 storm reached about \(-412\) nT.
A storm has three phases. A sudden commencement, a jump of tens of nanotesla, marks the arrival of the shock and the compression of the magnetosphere by the high pressure of the sheath behind it. The main phase, lasting hours to a day, follows as the southward field drives reconnection and the ring current builds, driving Dst down. The recovery phase, lasting a day to several days, follows as ring current ions are lost by charge exchange with the hydrogen of the extended outer atmosphere, the geocorona.
The Burton model
In 1975 Burton, McPherron and Russell fitted a simple equation to the observed Dst:
where \(\mathrm{Dst}^*\) is Dst corrected for the magnetopause currents, \(Q\) is the injection rate and \(\tau\) the decay time of the ring current. This lesson uses \(Q \approx -4.4\,(vB_s - 0.5)\) nT/h for \(vB_s\) in mV/m above a threshold of 0.5 mV/m, from a later refit by O'Brien and McPherron in 2000, and Burton's original decay time \(\tau \approx 7.7\) h. It is a leaky bucket: the solar wind fills the ring current, and charge exchange drains it. The program drives it with idealized pulses of southward field lasting 6 to 14 hours. A peak \(vB_s\) of 8 mV/m gives a moderate storm with a minimum Dst near \(-107\) nT; 20 mV/m sustained for 10 hours gives about \(-380\) nT, comparable to May 2024; and 26 mV/m for 14 hours gives about \(-590\) nT, comparable to March 1989. In each case Dst recovers halfway in 6 to 9 hours once the driver stops. Real recoveries are often slower in their later stages because the oxygen ions that dominate the ring current in great storms are lost more slowly than protons.
Historic storms
The Carrington event of 1859 remains the benchmark extreme storm, with aurora reported in Cuba and Hawaii and telegraph operators able to send messages with their batteries disconnected, powered by induced currents. Estimates of its Dst, from the few magnetometer records available, range from about \(-850\) to \(-1750\) nT. A storm of comparable size in May 1921 set fire to telegraph and railway signaling equipment in New York and Sweden. On 13 March 1989, a storm with Dst reaching \(-589\) nT caused the Hydro-Québec power grid to collapse in 92 seconds, leaving about six million people without power for about nine hours, as lesson 12 describes. In late October 2003, the Halloween storms damaged satellites, forced airlines to reroute polar flights and caused a blackout in Malmö, Sweden. In July 2012 a coronal mass ejection as fast as Carrington's crossed the Earth's orbit but missed the Earth by about nine days of orbital motion; the STEREO-A spacecraft measured it. The May 2024 storm caused no major grid failure, but it disrupted GNSS-guided farm equipment during spring planting across the northern plains and the Prairies, increased satellite drag and forced many satellites to adjust their orbits. NASA researchers informally named it the Gannon storm in memory of Jennifer Gannon, a space weather scientist who died shortly before it.
Worked problem
Will the aurora be visible?
A forecast calls for Kp 7. Using the rule of thumb, will observers in Minneapolis, at magnetic latitude about 55°, see aurora overhead or only on the northern horizon?
Show solution
- Night-side oval edge: \(66 - 2\times7 = 52°\) magnetic latitude.
- The observer's magnetic latitude, 55°, is poleward of 52°.
- So the oval passes overhead or just south of the observer, and aurora can be seen overhead and across much of the sky, given clear, dark skies.
- For observers 6° or more equatorward of the edge, near 46°, aurora would appear only low on the northern horizon.
Answer: Overhead aurora is likely if the forecast is right and the sky is clear and dark.
Common mistakes
MistakeThinking the aurora is caused by solar wind particles streaming directly into the atmosphere.
InsteadMost auroral electrons come from the magnetosphere and are accelerated along field lines a few thousand kilometers up.
MistakeExpecting a fast solar wind alone to cause a big storm.
InsteadThe interplanetary field must point south for sustained reconnection.
MistakeAssuming red aurora comes from a different kind of particle.
InsteadRed and green both come from atomic oxygen, in different excited states at different heights.
MistakeReading Kp as a linear scale.
InsteadIt is quasi-logarithmic: each step roughly doubles the magnetic disturbance.
MistakeAssuming the aurora is centered on the geographic pole.
InsteadThe oval is centered near the magnetic pole and displaced toward the night side.
Summary and key terms
- Dayside reconnection with a southward interplanetary field drives the Dungey cycle and two-cell polar convection.
- Substorms store energy in the magnetotail and release it suddenly, brightening and expanding the aurora.
- Green (557.7 nm) and red (630.0 nm) aurora come from atomic oxygen at about 100 to 150 km and above 200 km; blue from ionized nitrogen.
- The oval expands equatorward with Kp, roughly \(66° - 2°\,\mathrm{Kp}\) in magnetic latitude on the night side.
- Dst measures the ring current; the Burton equation reproduces storm main and recovery phases; March 1989 reached \(-589\) nT and May 2024 about \(-412\) nT.
- magnetic reconnection
- The breaking and rejoining of field lines in a current sheet, releasing magnetic energy.
- Dungey cycle
- The circulation of magnetic flux and plasma driven by dayside and tail reconnection.
- substorm
- A sudden release of energy stored in the magnetotail that brightens and expands the aurora.
- auroral oval
- The ring of auroral emission around each magnetic pole.
- Kp index
- A three-hourly, quasi-logarithmic 0 to 9 index of global geomagnetic activity.
- Dst index
- An hourly index of the equatorial field depression caused mainly by the ring current.
Practice problems
Work each problem on paper first, then reveal the answer to check.
What photon energy corresponds to the 630.0 nm red line?
Show answer
\(1240/630.0 = 1.97\) eV.
Compute \(vB_s\) for a 600 km/s wind with a 15 nT southward field.
Show answer
\(6\times10^5\times1.5\times10^{-8} = 9\times10^{-3}\) V/m = 9 mV/m.
In the Burton model with constant \(Q\), what is the equilibrium Dst?
Show answer
Setting the derivative to zero, \(\mathrm{Dst} = Q\tau\); for \(Q = -40\) nT/h and \(\tau = 7.7\) h, about \(-308\) nT.
How far away can an aurora at 300 km height be seen on the horizon?
Show answer
About 1900 km, or 17° of latitude.
Why does the green aurora have a sharp lower edge near 100 km?
Show answer
Below that, collisions de-excite the long-lived oxygen state before it can radiate.
At what Kp does the rule of thumb put the oval edge at 55° magnetic latitude?
Show answer
\(66 - 2\,\mathrm{Kp} = 55\) gives Kp \(\approx 5.5\).
Lesson quiz · 5 questions
Score 60% or more to complete this lesson.
Create a free account to save your progress, take quizzes and earn a certificate.