
MSAZ-281 · Lesson 8 of 12 · 21 min
Dynamic management views
▶ Video coming soon A video version of this lesson is on the way.
On the second Tuesday of December, during a StockLine replay on the test Managed Instance, the till simulation stalls. Transactions that normally take 50 milliseconds are taking 30 seconds, and some time out. CPU is low and nothing in the metrics looks alarming. Walt's instinct from the old server is right: when everything waits and nothing works hard, look at what the sessions are waiting for. The tools for that are the dynamic management views, and this session is the one Walt has been looking forward to.
What dynamic management views are
Dynamic management views and functions, usually called DMVs, expose the engine's internal state as queryable rows: current sessions and requests, what each request is waiting for, which locks are held, what is in the plan cache, how indexes are used, how memory is divided. Their names start with sys.dm_ and a prefix tells you the area: dm_exec for execution, dm_os for the operating system layer, dm_tran for transactions, dm_db for database-scoped information, dm_io for input and output. Most show the current moment or totals since the last restart, so they are the place to look while a problem is happening, and Query Store is the place to look afterwards.
Reading most DMVs requires VIEW SERVER STATE on SQL Server and Managed Instance, or VIEW DATABASE STATE in Azure SQL Database, where the database is the unit and server-wide views are scoped to it. SQL Server 2022, Managed Instance and Azure SQL Database also have the narrower VIEW SERVER PERFORMANCE STATE and VIEW DATABASE PERFORMANCE STATE permissions, which allow performance views without security-related ones. The monitoring identity at Harrow & Finch gets the performance-state permissions, following lesson 2's least-privilege rule, rather than the broader ones.
| DMV | What it shows | Typical question |
|---|---|---|
| sys.dm_exec_sessions | One row per session, with login, host and program | Who is connected? |
| sys.dm_exec_requests | Currently running requests, with wait type and blocking session | What is running and what is it waiting for? |
| sys.dm_exec_sql_text(handle) | The text of a batch from its handle | What statement is this? |
| sys.dm_exec_query_stats | Totals for cached query plans since they entered the cache | Which cached queries cost the most? |
| sys.dm_os_wait_stats / sys.dm_db_wait_stats | Accumulated waits by type, for the instance or the database | What does this system spend its time waiting for? |
| sys.dm_tran_locks | Locks held and requested | Who holds the lock that others want? |
| sys.dm_db_resource_stats | Resource use every 15 seconds for about an hour (Azure SQL Database) | How close are we to the limits right now? |
| sys.dm_db_missing_index_details | Indexes the optimizer wished it had | Is an index missing? |
Finding blocking
Blocking happens when one session holds a lock that another session needs. A little blocking is normal and lasts milliseconds. A problem starts when a session holds locks for a long time, usually because a transaction was opened and not finished, and others queue behind it. sys.dm_exec_requests shows each waiting request's blocking_session_id. Following those numbers leads to the head blocker: the session at the front of the chain, which is itself not blocked by anyone and is often not even running, just sitting with an open transaction.
SELECT r.session_id, r.blocking_session_id, r.wait_type, r.wait_time / 1000 AS wait_s,
       r.status, DB_NAME(r.database_id) AS db, t.text AS running_sql
FROM sys.dm_exec_requests AS r
CROSS APPLY sys.dm_exec_sql_text(r.sql_handle) AS t
WHERE r.blocking_session_id <> 0
ORDER BY r.wait_time DESC;

-- The head blocker may not have a request at all; look at its session
SELECT s.session_id, s.login_name, s.host_name, s.program_name,
       s.open_transaction_count, s.last_request_end_time
FROM sys.dm_exec_sessions AS s
WHERE s.session_id = 87;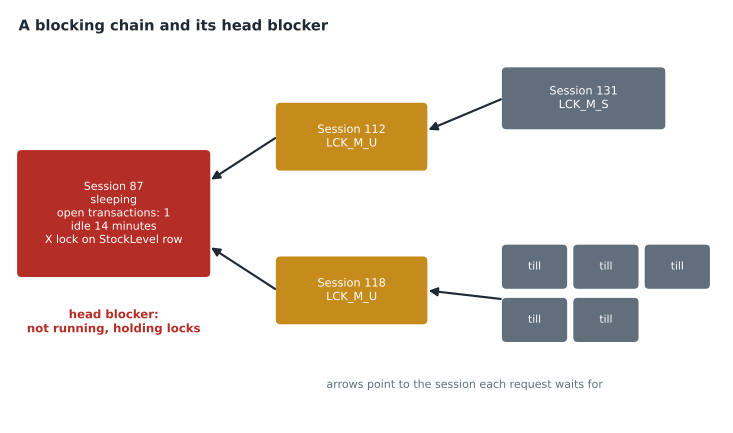
In Walt's stall, the head blocker is session 87: an inventory adjustment tool opened by a store-support analyst who started a transaction, updated one row of stock.StockLevel for SKU PNT-114 at store 12, and then went to lunch without committing. Every till that sold that paint, and every process that read the row with a lock, queued behind it. The immediate fix is to end the session with KILL 87, which rolls back its uncommitted change. The lasting fix is in the tool, which should never leave a transaction open while waiting for a person.
Isolation levels and row versioning
Readers and writers block each other less when the database uses row versioning. Under read committed snapshot isolation, a read sees the last committed version of each row instead of waiting for a writer's lock. Azure SQL Database turns read committed snapshot on by default for new databases, so plain SELECT statements there rarely wait for writers. Managed Instance and SQL Server keep the traditional locking behavior unless the option is switched on, and the StockLine test copy, restored from the old server, has it off. Elena and Walt add a task to the migration plan: test StockLine with read committed snapshot on, because it would have prevented half of the waits in this stall, but check first that no code depends on readers waiting for writers.
DP-800 asks developers to preserve data integrity with isolation levels and concurrency controls, so Hana joins this part of the discussion. Snapshot isolation, read committed snapshot, read committed with locking, repeatable read and serializable trade consistency against concurrency in different ways. The higher the level, the more locks are held for longer. Her rule for the Finch Rewards API is short transactions, read committed snapshot for reads, and explicit UPDLOCK hints only in the redemption procedure, where two requests must not spend the same points twice.
Wait statistics
Every time a request cannot proceed, the engine records why and for how long. Accumulated wait statistics tell the story of a system: whether it mostly waits for disk, for locks, for CPU, for memory grants or for the network. In Azure SQL Database, sys.dm_db_wait_stats shows waits for the database; on Managed Instance and SQL Server, sys.dm_os_wait_stats shows the instance. Many wait types are benign background waits and should be filtered out. The interesting ones are familiar to any SQL Server DBA.
| Wait type or family | Usually means | First thing to check |
|---|---|---|
| LCK_M_* | Waiting for a lock held by another session | Blocking chains and long transactions |
| PAGEIOLATCH_* | Waiting to read data pages from storage | Missing indexes, scans, storage limits |
| WRITELOG | Waiting for log writes to be hardened | Log write rate against the tier's limit |
| SOS_SCHEDULER_YIELD | Waiting for CPU time | CPU-heavy queries, the compute size |
| RESOURCE_SEMAPHORE | Waiting for a memory grant | Queries with large sorts or hashes |
| ASYNC_NETWORK_IO | The client is slow to read results | Applications pulling rows one by one |
| LOG_RATE_GOVERNOR / INSTANCE_LOG_RATE_GOVERNOR | Log generation capped by the service tier | Lesson 12: resource governance |
SELECT TOP (8) wait_type, waiting_tasks_count,
       wait_time_ms / 1000 AS wait_s,
       CAST(100.0 * wait_time_ms / SUM(wait_time_ms) OVER () AS decimal(5,1)) AS share
FROM sys.dm_os_wait_stats
WHERE wait_type NOT IN ('SLEEP_TASK', 'BROKER_TASK_STOP', 'XE_TIMER_EVENT', 'LAZYWRITER_SLEEP',
                        'SQLTRACE_INCREMENTAL_FLUSH_SLEEP', 'CHECKPOINT_QUEUE', 'REQUEST_FOR_DEADLOCK_SEARCH',
                        'HADR_FILESTREAM_IOMGR_IOCOMPLETION', 'DIRTY_PAGE_POLL', 'SP_SERVER_DIAGNOSTICS_SLEEP')
ORDER BY wait_time_ms DESC;
Expensive queries in the plan cache
sys.dm_exec_query_stats holds totals for every query plan currently cached: executions, total and last CPU time, elapsed time, logical reads and writes. Joining it to sys.dm_exec_sql_text and sys.dm_exec_query_plan shows the text and the plan of the costliest statements. Its limit is that it knows only what is in the cache now; a plan evicted an hour ago, or lost when the instance restarted, has vanished. That is why Walt uses it for a quick look during an incident and Query Store for anything historical. A query whose total CPU is high because it runs a million times a day at one millisecond each needs a different fix from one that runs ten times at a hundred seconds each, so he always looks at executions next to totals.
Deadlocks
A deadlock is a special case: two sessions each hold a lock the other needs, so neither can continue. The engine detects it within seconds, chooses one session as the victim, rolls back its transaction and returns error 1205 to its client. The other continues. Deadlocks are captured automatically in the system_health Extended Events session on SQL Server and Managed Instance, and in Azure SQL Database they can be sent to Log Analytics through the deadlock resource log or captured with an Extended Events session of your own. The deadlock graph shows the two sessions, the resources and the statements, which usually reveals two procedures that touch the same tables in opposite orders. Hana's redemption procedure and Walt's nightly points expiry job turn out to be exactly that pair in an early test; making both update Member before PointsLedger removes the deadlock.
Capturing evidence before acting
When a production incident is in progress, the temptation is to fix it at once. Elena's rule is to capture evidence for one minute first, because after a KILL or a failover the DMVs forget everything. Walt's incident script saves the output of the blocking query, the top waits, the current requests with their plans and the open transactions into a table in a small administration database, with a timestamp. The script runs in under five seconds. After the incident, the saved rows show what was happening, which is what the post-incident review needs and what the DMVs can no longer tell anyone.
The script also records sys.dm_tran_active_transactions and sys.dm_tran_session_transactions, which show how long each transaction has been open. A transaction open for 14 minutes on a system whose normal transactions last milliseconds is the clearest sign of a session that will become a head blocker. Walt adds an alert to the test instance for any transaction older than five minutes, using an Agent job that checks every minute, so the next stall will be caught before the tills notice.
Extended Events for the rare event
Some problems happen once a day or once a week and are gone before anyone can look. Extended Events sessions catch them. A session defines events to capture, such as sql_statement_completed with a duration filter over five seconds, or blocked_process_report, which fires when a request has been blocked for longer than a threshold set by the blocked process threshold option. In Azure SQL Database, sessions are database-scoped and write to a ring buffer in memory or to an event file in Azure Blob Storage; on Managed Instance and SQL Server they are server-scoped. Walt creates one session on the test instance for long statements and blocked process reports and leaves it running, because its overhead with those filters is negligible.
Worked problem
Which queries deserve attention first?
Walt pulls four statements from sys.dm_exec_query_stats on the test instance after one replay hour: (A) 3,600,000 executions at an average of 0.4 ms CPU; (B) 120 executions at 1,500 ms CPU each; (C) 40,000 executions at 30 ms; (D) 6 executions at 45,000 ms. Rank them by total CPU, and say which might be the cheapest to fix.
Show solution
- Total CPU is executions × average.
- \[A: 3{,}600{,}000 \times 0.4 = 1{,}440{,}000 \text{ ms}\]
- \[B: 120 \times 1{,}500 = 180{,}000 \text{ ms}\]
- \[C: 40{,}000 \times 30 = 1{,}200{,}000 \text{ ms}\]
- \[D: 6 \times 45{,}000 = 270{,}000 \text{ ms}\]
- Ranking by total CPU: A (1,440 s), C (1,200 s), D (270 s), B (180 s).
- A is already fast per call; the saving would come from calling it less often, for example by caching in the application. C at 30 ms per call is often a missing index away from 1 ms. D is rare but each run takes 45 seconds and may hold locks or memory a long time.
Answer: By total CPU the order is A, C, D, B. C is usually the cheapest big win, an index or a rewrite, while A is a conversation with the developers about how often the query is called.
Common mistakes
MistakeIf CPU is low, the database is not the problem.
InsteadLow CPU with slow responses often means waiting: on locks, IO, log writes or the client. Check waits and blocking.
MistakeThe head blocker is always a long-running query.
InsteadIt is often an idle session with an open transaction; check open_transaction_count and last_request_end_time.
Mistakesys.dm_exec_query_stats shows every query that ran today.
InsteadIt shows only plans still in the cache; use Query Store for history.
MistakeVIEW SERVER STATE is required for any performance DMV.
InsteadThe narrower VIEW SERVER or DATABASE PERFORMANCE STATE permissions are enough for performance views on current versions.
Summary and key terms
- DMVs expose live engine state; names start with sys.dm_ and prefixes show the area.
- Blocking chains are traced with blocking_session_id to the head blocker, often an idle session with an open transaction.
- Read committed snapshot, on by default in Azure SQL Database, lets readers avoid waiting for writers.
- Wait statistics show what a system waits for: locks, IO, log, CPU, memory grants or the client.
- sys.dm_exec_query_stats ranks cached queries by cost; compare executions with totals before choosing a fix.
- Deadlocks are resolved by the engine with error 1205 and are investigated through deadlock graphs.
- Dynamic management view
- A system view that exposes current internal state of the database engine.
- Head blocker
- The session at the front of a blocking chain, which blocks others but is not itself blocked.
- Wait statistics
- Accumulated counts and times of the reasons requests could not proceed.
- Read committed snapshot isolation
- An option under which reads see the last committed row version instead of waiting for locks.
- Deadlock
- Two or more sessions each waiting for a lock the other holds, resolved by rolling one back.
- Plan cache
- Memory where compiled query plans are kept for reuse.
Practice problems
Work each problem on paper first, then reveal the answer to check.
Which column in sys.dm_exec_requests shows who is blocking a request?
Show answer
blocking_session_id.
Why might the head blocker not appear in sys.dm_exec_requests?
Show answer
It may be idle with an open transaction, so it has a session but no running request.
What does a high share of PAGEIOLATCH waits suggest?
Show answer
Queries reading many pages from storage, often because of scans or missing indexes.
Which error does the deadlock victim receive?
Show answer
Error 1205.
Which permission lets a monitoring account read performance DMVs without broader security information?
Show answer
VIEW SERVER PERFORMANCE STATE or VIEW DATABASE PERFORMANCE STATE.
Lesson quiz · 5 questions
Score 60% or more to complete this lesson.
Create a free account to save your progress, take quizzes and earn a certificate.