
MSAZ-281 · Lesson 12 of 12 · 21 min
Resource governance
▶ Video coming soon A video version of this lesson is on the way.
The last clinic session before the holidays begins with a puzzle from Hana. During a load test on the Finch Rewards test database, the API slowed down sharply although CPU never went above 60 in 100. Walt looks at the waits and finds LOG_RATE_GOVERNOR at the top. "The database is not busy," Elena says. "It is being held back on purpose." Every Azure SQL service enforces limits that come with the size and tier you pay for, and understanding those limits, and the tools for setting your own, is the subject of this final lesson.
Limits come with the service objective
In Azure SQL Database, each service objective comes with a published set of resource limits: the number of vCores or DTUs, memory, maximum data size, maximum log size, tempdb size, maximum data IO operations per second, maximum log write rate, maximum concurrent workers and sessions, and more. The engine enforces these with resource governance, built on the same Resource Governor technology as SQL Server, plus controls on IO and log generation. When a workload reaches a limit, it does not fail; it waits. CPU limits show as scheduler waits, IO limits as IO waits, the log rate limit as LOG_RATE_GOVERNOR, and the worker limit as errors when too many requests are running at once.
The limits differ by tier and size, and by hardware. Business Critical databases use local storage and have higher IO and log rates than General Purpose databases of the same vCore count, which use remote storage. Hyperscale has its own architecture with a high log rate. Serverless databases have limits tied to their maximum vCores. The DP-300 skill of configuring compute and storage for scaling comes down to knowing which limit a workload is hitting, then choosing the size, tier or design change that lifts that specific limit. Raising vCores helps a CPU limit; it may or may not help a log rate limit, depending on the tier.
| Limit | Wait or symptom when reached | Usual remedies |
|---|---|---|
| CPU (vCores) | SOS_SCHEDULER_YIELD; CPU near 100 in 100 | Tune queries; scale up vCores |
| Data IO | PAGEIOLATCH waits; data IO near 100 | Indexes to read less; Business Critical or more vCores |
| Log write rate | LOG_RATE_GOVERNOR waits; log write near 100 | Batch smaller transactions; reduce index count; another tier |
| Workers | Error 10928 when the limit is reached | Shorter queries, less blocking, connection pooling; bigger size |
| Sessions | New connections refused at the limit | Fix connection leaks; pooling |
| tempdb size | Errors when tempdb is full | Fix spills and large sorts; bigger size |
| Maximum data size | Writes fail when the database is full | Raise the maximum; archive data |
Seeing the limits and the usage
Two DMVs make the limits visible. sys.dm_user_db_resource_governance shows the configured limits for the current database, including its service objective, the maximum log rate in bytes per second and the maximum workers. sys.dm_db_resource_stats shows usage every 15 seconds for about an hour, as a share of each limit: avg_cpu_percent, avg_data_io_percent, avg_log_write_percent, max_worker_percent and others. In master, sys.resource_stats keeps five-minute averages for about two weeks. Azure Monitor metrics show the same shares in the portal for 93 days.
SELECT database_name, slo_name, primary_max_log_rate, max_db_max_size_in_mb,
       primary_group_max_workers
FROM sys.dm_user_db_resource_governance;

SELECT TOP (20) end_time, avg_cpu_percent, avg_data_io_percent,
       avg_log_write_percent, max_worker_percent
FROM sys.dm_db_resource_stats
ORDER BY end_time DESC;
In Hana's load test, avg_log_write_percent sat at 100 for eleven minutes while CPU was around 60. The test inserted points for 200,000 simulated purchases, one row per transaction, and each insert also updated four indexes. The fix was in the design rather than the size. Hana changed the load to commit in batches of 500, and Walt removed two indexes on PointsLedger that no query used, which reduced the log generated per row. The same load then ran in four minutes without touching the limit.
# 15-second samples from sys.dm_db_resource_stats during the load test (share of each limit, 0-100)
samples = [
    {"cpu": 58, "data_io": 22, "log": 100, "workers": 31},
    {"cpu": 61, "data_io": 25, "log": 100, "workers": 34},
    {"cpu": 57, "data_io": 21, "log": 99,  "workers": 30},
    {"cpu": 63, "data_io": 27, "log": 100, "workers": 36},
    {"cpu": 60, "data_io": 24, "log": 100, "workers": 33},
]
for name in ["cpu", "data_io", "log", "workers"]:
    values = [s[name] for s in samples]
    avg = sum(values) / len(values)
    print(f"{name:8s} average {avg:5.1f} of 100, peak {max(values)}")
limiting = max(["cpu", "data_io", "log", "workers"],
               key=lambda n: sum(s[n] for s in samples))
print("limiting resource:", limiting)cpu average 59.8 of 100, peak 63 data_io average 23.8 of 100, peak 27 log average 99.8 of 100, peak 100 workers average 32.8 of 100, peak 36 limiting resource: log
What this code does
The program takes five readings from the load test. Each reading shows how close the database was to four of its limits, on a scale of 0 to 100. It averages each resource across the readings, notes the highest reading, and names the resource that was closest to its limit overall. The output shows the log write rate pinned at or near its limit while processing time was only around the middle of the scale, which is why adding processors alone would not have fixed the slowdown.
Elastic pools: sharing within limits
An elastic pool shares a set of resources among several databases, and it has its own governance. The pool has limits like a single database, and each database in it has a per-database minimum and maximum. Setting a minimum reserves resources for a database even when it is idle; setting a maximum stops one busy database from taking the whole pool. For Harrow & Finch's planned pool of small departmental databases, Elena sets a per-database maximum of half the pool's vCores and a minimum of zero, so that no single department's month-end can starve the others, and idle databases cost nothing extra.
Managed Instance limits
A Managed Instance has limits at the instance level: vCores, memory, maximum storage, IO and log rate depending on the tier, number of databases, and tempdb. In General Purpose, data and log files live on remote storage, and IO performance depends on file size, so pre-growing files to larger sizes can raise their IO limits; Microsoft documents this behavior for the General Purpose tier, and the newer Next-gen General Purpose option lets IO be configured more directly. Instance-level log rate governance shows as INSTANCE_LOG_RATE_GOVERNOR. Because many databases share one instance, a busy database can slow the others, which is where Resource Governor helps.
Resource Governor on Managed Instance and VMs
SQL Server's Resource Governor, available on Managed Instance and SQL Server on VMs, lets the DBA divide the instance's resources among workloads. It has three parts. Resource pools set minimum and maximum shares of CPU, memory and IO. Workload groups sit inside pools and set limits for requests, such as maximum memory grant, degree of parallelism and request timeouts. A classifier function, a user-defined function in master, runs at each connection and assigns the session to a workload group, usually based on the login name, the application name or the host. Sessions not classified go to the default group.
On the StockLine test instance, the reports that Keiko's team runs still compete with the tills, the problem Walt has fought every winter morning for years. Elena designs a simple split: a pool for reporting with a maximum of 30 in 100 of CPU and a cap on memory grants, and everything else in the default pool. Reports still run, just more slowly when the tills are busy, and tills no longer wait for reports. The cap on CPU only applies when there is contention, unless a hard cap is set, so overnight the reports can still use the whole instance.
CREATE RESOURCE POOL ReportingPool
    WITH (MAX_CPU_PERCENT = 30, MAX_MEMORY_PERCENT = 30);
CREATE WORKLOAD GROUP ReportingGroup
    WITH (REQUEST_MAX_MEMORY_GRANT_PERCENT = 15, MAX_DOP = 4)
    USING ReportingPool;
GO
CREATE FUNCTION dbo.fn_rg_classifier() RETURNS sysname
WITH SCHEMABINDING
AS
BEGIN
    IF APP_NAME() LIKE N'Nightly Sales Report%' OR SUSER_SNAME() = N'svc-reporting'
        RETURN N'ReportingGroup';
    RETURN N'default';
END;
GO
ALTER RESOURCE GOVERNOR WITH (CLASSIFIER_FUNCTION = dbo.fn_rg_classifier);
ALTER RESOURCE GOVERNOR RECONFIGURE;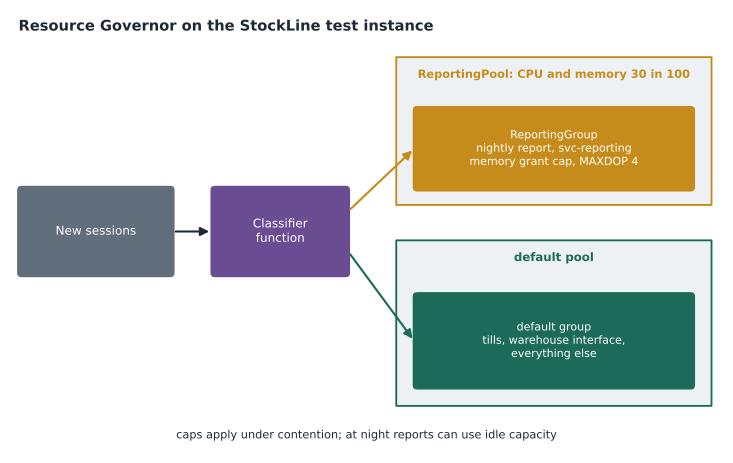
Azure SQL Database does not expose Resource Governor to customers, because the service uses it internally to enforce the tier's limits. The equivalents there are choosing the right size, separating workloads into different databases or elastic pools, and, for reporting, sending read-only work to a readable secondary replica with ApplicationIntent=ReadOnly in the connection string, which Business Critical and Hyperscale offer at no extra compute cost for the built-in replica. The Finch Rewards plan for 2027 uses that last option for its monthly loyalty statements.
Putting the course together
Over twelve sessions, Walt and Hana have taken two empty test environments to a state Sunil is prepared to review. Identities come from Entra, with groups and managed identities. Permissions follow least privilege through roles on schemas. Data is encrypted at rest, in transit and, for one column, end to end. Sensitive columns are masked and rows filtered by store. Audits flow to storage and Sentinel, and Defender for SQL watches for threats. A baseline exists, Query Store is configured, and the team knows what to do about database watcher's retirement. Indexes have been reviewed, the report query has been rewritten, automatic tuning has a policy, and the tills are protected from the reports. MSAZ-282 takes the same environments on to automation, high availability and disaster recovery.
Serverless and auto-pause
Serverless databases add one more kind of governance. Compute scales automatically between a minimum and a maximum number of vCores, and the limits in the documentation are those of the maximum; memory can be reclaimed when the database is quiet, which can empty the buffer cache and make the first queries after a quiet period slower. If auto-pause is on, a database with no activity for the configured delay pauses, and the first connection after that waits while it resumes. For the Finch Rewards test database, which developers use in office hours, both behaviors are acceptable and save money. For the production database, which customers use at any hour, the team chose provisioned compute in MSAZ-280.
Worked problem
How long will the load take under the log rate limit?
sys.dm_user_db_resource_governance reports a maximum log rate of 18 MB per second for the Finch Rewards test database's service objective, an illustrative figure for this example. Hana's load of 200,000 purchases generated about 11.5 KB of log per purchase with one row per transaction and six indexes, and about 6 KB per purchase after batching and removing two indexes. If the load is limited only by log rate, how long does each version take?
Show solution
- Original log volume: 200,000 × 11.5 KB = 2,300,000 KB, about 2,246 MB (using 1,024 KB per MB).
- \[2{,}246 \div 18 \approx 125 \text{ s}\]
- New log volume: 200,000 × 6 KB = 1,200,000 KB, about 1,172 MB.
- \[1{,}172 \div 18 \approx 65 \text{ s}\]
- The measured times were longer, about 11 and 4 minutes, because the original load also waited on 200,000 separate commits; batching removed most of those round trips as well.
Answer: At the log rate limit alone, the load needs about 125 seconds before the changes and about 65 after; the real gain was larger because batching also cut the per-commit waits. The figure of 18 MB per second is for illustration; Walt reads the real value from the DMV for each service objective.
Common mistakes
MistakeIf CPU is not at the limit, scaling up will not help.
InsteadAnother limit, such as log rate or IO, may be binding; find which limit is reached before choosing a remedy.
MistakeResource Governor can be configured in Azure SQL Database.
InsteadAzure SQL Database uses it internally; customers configure it on Managed Instance and SQL Server.
MistakeA MAX_CPU_PERCENT of 30 always caps the pool at 30.
InsteadIt applies under contention; use CAP_CPU_PERCENT for a hard cap.
MistakeElastic pool databases can each use as much as they like.
InsteadPer-database minimum and maximum settings govern each database's share of the pool.
Summary and key terms
- Each Azure SQL service objective has published limits for CPU, memory, IO, log rate, workers, sessions, tempdb and size.
- Reaching a limit causes waiting, such as LOG_RATE_GOVERNOR, rather than failure, except for hard limits like workers and size.
- sys.dm_user_db_resource_governance shows limits; sys.dm_db_resource_stats shows usage as shares of each limit every 15 seconds.
- Elastic pools govern each database with per-database minimum and maximum settings.
- On Managed Instance and SQL Server, Resource Governor divides resources with pools, workload groups and a classifier function.
- In Azure SQL Database, separate workloads with sizing, pools and read-only replicas instead.
- Resource governance
- The enforcement of resource limits that come with a service objective.
- Service objective
- The specific size and tier of a database, such as a number of vCores in General Purpose.
- Log rate governance
- A limit on how fast transaction log can be generated, shown as LOG_RATE_GOVERNOR waits.
- Resource pool
- In Resource Governor, a share of CPU, memory and IO for a set of workloads.
- Workload group
- In Resource Governor, a container for sessions with request-level limits, inside a pool.
- Classifier function
- A function that assigns each new session to a workload group.
- Read scale-out
- Sending read-only connections to a readable secondary replica with ApplicationIntent=ReadOnly.
Practice problems
Work each problem on paper first, then reveal the answer to check.
Which DMV shows the configured log rate limit for an Azure SQL database?
Show answer
sys.dm_user_db_resource_governance.
What wait type shows that a database is held back by its log rate limit?
Show answer
LOG_RATE_GOVERNOR (INSTANCE_LOG_RATE_GOVERNOR on Managed Instance).
What does a per-database maximum in an elastic pool prevent?
Show answer
One busy database taking all of the pool's resources.
Name the three parts of Resource Governor.
Show answer
Resource pools, workload groups and a classifier function.
How can Azure SQL Database offload reporting without Resource Governor?
Show answer
Send read-only connections to a readable secondary with ApplicationIntent=ReadOnly, or separate the workload into another database or pool.
Lesson quiz · 5 questions
Score 60% or more to complete this lesson.
Create a free account to save your progress, take quizzes and earn a certificate.