
MSAZ-281 · Lesson 7 of 12 · 20 min
Monitoring with Database Watcher and Query Store
▶ Video coming soon A video version of this lesson is on the way.
Walt's oldest monitoring tool is a laminated card taped to his monitor. It lists what StockLine normally looks like on a winter weekday: CPU around 35 in 100 at 10:00, a spike to 80 at 7:00 when the nightly reports collide with the tills opening, log backups of about 600 MB an hour. When something is wrong, he knows because the numbers are not the ones on the card. Elena tells him the card is the right idea and the wrong medium. In Azure, the baseline should be measured, stored and compared automatically, and this session is about where the numbers come from.
A baseline before a problem
A performance baseline is a record of how a workload normally behaves: resource use by hour and day, the busiest queries, typical waits, normal response times. Without one, every graph looks alarming or reassuring depending on mood. With one, a DBA can say that CPU at 70 is normal for Monday at 7:00 but strange for Sunday at 15:00. A baseline should cover at least a full business cycle, a week for most systems and a month for systems with month-end processing. It should be refreshed after big changes, such as a migration, a new release or a change of service tier, because the old normal no longer applies.
Walt starts the baseline for the test Managed Instance during the first StockLine rehearsal load in December, using a replay of a week of till traffic captured from the old server. He records CPU, data and log IO, memory, worker counts and the top queries by duration and CPU, at five-minute intervals. The numbers will not match production exactly, but they will show whether the instance size chosen in MSAZ-280 has headroom, and they give him something to compare with when the real migration happens.
import statistics

# CPU percentage samples every 5 minutes, 07:00 to 08:00 on five weekday mornings
mornings = {
    "Mon": [61, 66, 72, 78, 81, 79, 74, 69, 64, 60, 58, 55],
    "Tue": [58, 63, 70, 76, 80, 77, 71, 66, 61, 57, 55, 53],
    "Wed": [60, 65, 71, 79, 83, 80, 73, 68, 63, 59, 56, 54],
    "Thu": [57, 62, 69, 75, 79, 76, 70, 65, 60, 56, 54, 52],
    "Fri": [63, 68, 75, 82, 86, 84, 77, 71, 66, 62, 59, 57],
}
samples = [v for day in mornings.values() for v in day]
q = statistics.quantiles(samples, n=20)   # 5th, 10th, ... 95th percentiles
print("samples:", len(samples))
print("median:", statistics.median(samples))
print("95th percentile:", round(q[18], 1))
print("peak:", max(samples))
threshold = round(q[18] + 5)
print("alert if 07:00-08:00 CPU stays above", threshold, "for 15 minutes")samples: 60 median: 66.0 95th percentile: 83.0 peak: 86 alert if 07:00-08:00 CPU stays above 88 for 15 minutes
What this code does
The program takes sixty CPU readings, five weekday mornings of twelve readings each, and works out the middle value, the value that only one reading in twenty exceeds, and the highest reading. It then sets an alert level a little above that high-but-normal value. The output shows that a typical morning hour peaks in the low eighties, so an alert at the printed level would fire only for mornings that are clearly worse than usual.
The point of the threshold is that it comes from data rather than from a round number. An alert at 80 would fire every Friday morning and teach everyone to ignore it. An alert a few points above the 95th percentile of normal mornings fires only when something has genuinely changed, which is what Walt's card did in his head.
Where the numbers come from
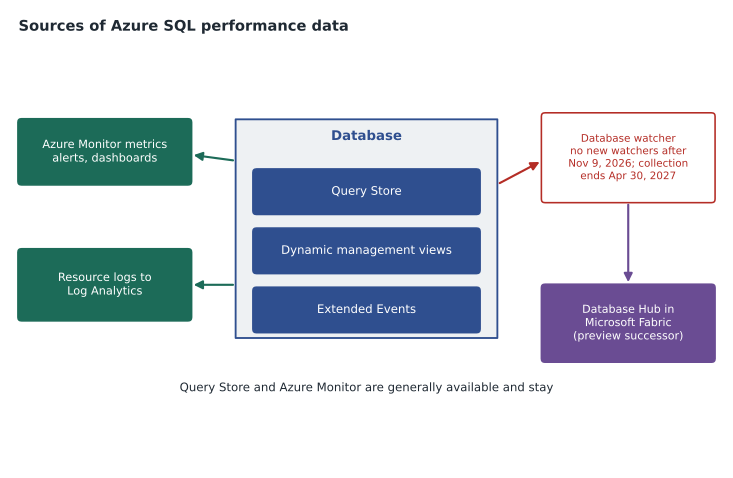
Azure SQL offers several sources of performance data, and the DP-300 outline expects candidates to know which to use. Azure Monitor platform metrics, such as CPU, data IO and log write use, each as a share of its limit, storage used, sessions and workers, are collected automatically and kept for 93 days; they drive portal charts and metric alerts. Diagnostic settings can send resource logs, such as query store runtime statistics, wait statistics, errors and deadlocks, to Log Analytics for longer retention and Kusto queries. Inside the engine, dynamic management views give the most detailed, current information, covered in lesson 8. Extended Events capture individual events, such as a query that runs longer than ten seconds or a deadlock graph, with very low overhead. And Query Store keeps a history of queries, plans and their runtime statistics inside each database.
| Source | Detail | History kept | Good for |
|---|---|---|---|
| Azure Monitor metrics | Resource use as shares of limits, every minute | 93 days | Dashboards, metric alerts, capacity trends |
| Resource logs in Log Analytics | Waits, errors, deadlocks, query statistics | As long as the workspace keeps them | Cross-database queries, long-term trends |
| sys.dm_db_resource_stats | Resource use every 15 seconds | About one hour | Checking right now |
| Dynamic management views | Sessions, requests, waits, plans in cache | Since restart or cache eviction | Live troubleshooting |
| Extended Events | Individual events with chosen fields | As long as the target keeps them | Long queries, deadlocks, errors |
| Query Store | Queries, plans and runtime statistics | Configurable, default 30 days | Regressions and plan history |
Database watcher, and what replaces it
Database watcher was introduced in preview as a managed monitoring solution for Azure SQL Database and Managed Instance. A watcher, created in Azure, collects detailed monitoring data from up to 100 databases, elastic pools and managed instances using a remote collector that connects to them, stores the data in Azure Data Explorer or in Real-Time Analytics in Microsoft Fabric, and shows it in prebuilt dashboards. The DP-300 skills outline, updated on October 27, 2026, still lists monitoring by using database watcher, so candidates should know what it does.
In practice, Microsoft has announced that database watcher will not reach general availability. Since November 9, 2026, new watchers cannot be created or edited, and existing watchers stop collecting data on April 30, 2027. The recommended successor is Database Hub in Microsoft Fabric, in preview as of November 2026, which gives one view of database estates across Azure SQL Database, Managed Instance, SQL Server on VMs and Arc-enabled SQL Server, among others, with performance views and findings. Elena's decision for Harrow & Finch is simple: no new investment in database watcher; a trial of Database Hub in January 2027 alongside Azure Monitor alerts and Query Store, which are generally available and will stay. Walt still learns how database watcher works, because the exam may ask, and because the concepts carry over.
Query Store
Query Store is the most useful single tool for query performance, and it lives inside the database. It records each query's text, the execution plans the optimizer has chosen for it over time, and runtime statistics for each plan in time intervals: executions, duration, CPU, logical reads and writes, memory grants and waits. Because the data is stored in the database, it survives restarts, failovers and plan cache evictions, which the dynamic management views do not. Query Store is on by default in Azure SQL Database and Managed Instance and, since SQL Server 2022, for new databases on SQL Server too.
A few settings decide how useful it is. The operation mode should be READ_WRITE; if Query Store fills its maximum size, it switches to READ_ONLY and stops collecting, which is a common cause of empty reports. The capture mode AUTO ignores queries that run rarely and cheaply, which keeps the store from filling with noise; ALL captures everything. The size-based cleanup removes the oldest data as the store approaches its limit, and the stale query threshold sets how many days of data are kept. The statistics collection interval sets how finely runtime is divided; one hour is the default and fifteen minutes gives better detail for short incidents.
ALTER DATABASE CURRENT SET QUERY_STORE = ON (
    OPERATION_MODE = READ_WRITE,
    QUERY_CAPTURE_MODE = AUTO,
    MAX_STORAGE_SIZE_MB = 2048,
    SIZE_BASED_CLEANUP_MODE = AUTO,
    CLEANUP_POLICY = (STALE_QUERY_THRESHOLD_DAYS = 30),
    INTERVAL_LENGTH_MINUTES = 15);

SELECT actual_state_desc, readonly_reason, current_storage_size_mb, max_storage_size_mb
FROM sys.database_query_store_options;
SQL Server Management Studio shows Query Store through built-in reports: Regressed Queries lists queries whose performance got worse compared with an earlier period, Top Resource Consuming Queries ranks queries by a chosen measure, Queries With Forced Plans shows plans someone has pinned, and Queries With High Variation shows queries whose duration jumps around. The Tracked Queries report follows one query over time with a dot for each plan. When a query gets slower after a change, the first question is whether its plan changed, and Query Store answers it in a single chart.
-- The ten queries with the most total CPU in the last 24 hours
SELECT TOP (10) q.query_id, qt.query_sql_text,
       SUM(rs.count_executions) AS executions,
       SUM(rs.avg_cpu_time * rs.count_executions) / 1000 AS total_cpu_ms
FROM sys.query_store_runtime_stats AS rs
JOIN sys.query_store_runtime_stats_interval AS i ON rs.runtime_stats_interval_id = i.runtime_stats_interval_id
JOIN sys.query_store_plan AS p ON rs.plan_id = p.plan_id
JOIN sys.query_store_query AS q ON p.query_id = q.query_id
JOIN sys.query_store_query_text AS qt ON q.query_text_id = qt.query_text_id
WHERE i.start_time > DATEADD(hour, -24, SYSUTCDATETIME())
GROUP BY q.query_id, qt.query_sql_text
ORDER BY total_cpu_ms DESC;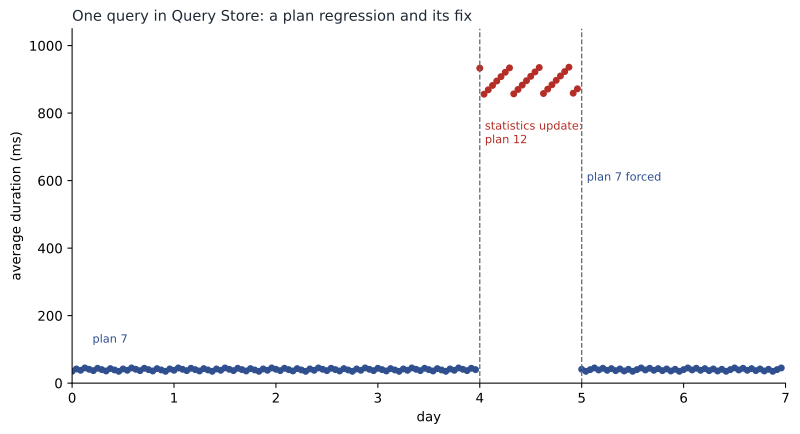
Intelligent Insights and Query Performance Insight
Azure SQL Database also offers Query Performance Insight in the portal, a simplified view built on Query Store that shows the top queries by CPU, duration or execution count for people who do not want to open SQL Server Management Studio. Intelligent Insights, which is in preview, uses built-in analysis to detect performance problems, such as reaching resource limits, increased waits, plan regressions and memory pressure, and writes a diagnostics log with a root-cause description and suggestions to a destination set in diagnostic settings. DP-300 lists monitoring by using Intelligent Insights, so Walt turns on its diagnostics log for the test database and sends it to Log Analytics. Hana notes that DP-800 names Query Performance Insight directly, alongside execution plans, dynamic management views and Query Store, as ways to evaluate query performance.
Worked problem
Will Query Store fill up?
Walt measures Query Store on the StockLine test database after a two-day replay: the store has grown from 40 MB to 136 MB. He expects production to be similar. Query Store's maximum size is set to 2,048 MB with a 30-day stale query threshold, and size-based cleanup is on. Assuming growth stays steady, how many days until the store would reach the limit without cleanup, and will the 30-day threshold keep it below the limit?
Show solution
- Growth over two days: 136 − 40 = 96 MB, so 48 MB a day.
- Days from 136 MB to 2,048 MB: (2,048 − 136) ÷ 48 = 1,912 ÷ 48 ≈ 39.8 days.
- \[40 + 48 \times 30 = 1{,}480 \text{ MB after 30 days}\]
- With a 30-day threshold, data older than 30 days is removed, so the store levels off at about 30 days of data, roughly 1,480 MB, which is below 2,048 MB.
- Size-based cleanup is a safety net if growth speeds up, for example during month-end.
Answer: Without cleanup the store would fill in about 40 days; with the 30-day threshold it levels off at about 1.5 GB, safely under the 2 GB limit. Walt adds an alert on actual_state_desc changing to READ_ONLY anyway.
Common mistakes
MistakeA baseline can be taken once and reused for years.
InsteadRefresh the baseline after migrations, releases and tier changes, because normal behavior changes.
MistakeQuery Store data is lost when the database fails over.
InsteadQuery Store is stored in the database, so it survives restarts and failovers.
MistakeNew database watchers are the recommended way to monitor Azure SQL.
InsteadSince November 9, 2026 new watchers cannot be created; plan on Azure Monitor, Query Store and Database Hub.
MistakeA Query Store in READ_ONLY mode is still collecting new data.
InsteadREAD_ONLY means collection has stopped, often because the store reached its maximum size.
Summary and key terms
- A baseline records normal behavior over a full business cycle, so alerts can be set from data.
- Azure Monitor metrics (93 days), resource logs in Log Analytics, DMVs, Extended Events and Query Store are the main data sources.
- Database watcher collected detailed monitoring data into Azure Data Explorer or Fabric; it will not reach general availability, with no new watchers after November 9, 2026 and collection ending April 30, 2027.
- Database Hub in Microsoft Fabric, in preview, is the recommended successor.
- Query Store keeps queries, plans and runtime statistics in the database and shows regressions; keep it READ_WRITE with AUTO capture.
- Query Performance Insight and Intelligent Insights (preview) give simplified views and automated diagnostics for Azure SQL Database.
- Performance baseline
- A measured record of normal workload behavior used to judge whether current numbers are unusual.
- Azure Monitor metrics
- Platform measurements such as CPU and IO use, collected automatically and kept for 93 days.
- Database watcher
- A preview managed monitoring service for Azure SQL that is being retired.
- Database Hub
- A preview Microsoft Fabric experience for monitoring and managing database estates.
- Query Store
- A database feature that records queries, their plans and runtime statistics over time.
- Plan regression
- A slowdown caused by the optimizer choosing a worse execution plan for a query.
- Intelligent Insights
- A preview Azure SQL Database feature that detects performance problems and logs root-cause analysis.
Practice problems
Work each problem on paper first, then reveal the answer to check.
Why should an alert threshold come from a baseline rather than a round number?
Show answer
A round number may be normal at some times and fire constantly; a threshold from data fires only when behavior has changed.
How long are Azure Monitor platform metrics kept?
Show answer
93 days.
What happens when Query Store reaches its maximum size?
Show answer
It switches to READ_ONLY and stops collecting, unless size-based cleanup frees space.
What is the status of database watcher as of November 2026?
Show answer
Preview only; no new watchers since November 9, 2026, data collection ends April 30, 2027, with Database Hub as the successor.
Which Query Store report shows queries that got slower compared with an earlier period?
Show answer
Regressed Queries.
Lesson quiz · 5 questions
Score 60% or more to complete this lesson.
Create a free account to save your progress, take quizzes and earn a certificate.