
MBA-699 · Lesson 6 of 12 · 20 min
Analysis II: financial and operational
Daniel has been waiting for this part of the engagement. As a plant controller he spends his working life finding where money leaks out of a manufacturing operation, and a grocery store, he tells the team, is a factory with very thin margins and very perishable inventory. This lesson follows his analysis of Meadowlark's grocery economics, which tests H1 on shrink, H3 on losing stores and H5 on private label, and shows how the team turned store data into findings the managers accepted.
The data arrived in the third week as 36 spreadsheet files from three different systems, with store numbers formatted three different ways. Daniel spent most of a weekend cleaning it: matching stores, removing duplicate rows, reconciling department totals to the audited division results, and recording every adjustment in a log. Nobody sees this work in the final presentation, Dr. Mehta tells the cohort, but if you skip it, the first director who finds an error will stop trusting every number you show. Reconciling to audited totals is the minimum standard: if the store data does not add up to the division's reported results, the analysis cannot be relied on.
The profit tree
A profit tree breaks operating profit into its drivers, as the team's issue tree did in lesson 3, and attaches numbers to each branch. For a retailer the natural structure expresses each cost as a share of sales, so stores of different sizes can be compared and benchmarked. Grocery operating profit equals gross margin minus store wages, occupancy, other store costs and allocated support costs. The wholesaler's benchmark survey gives the same measures for similar co-ops.
# Profit tree for the grocery division and the value of moving each driver (millions)
sales = 318.0
drivers = {  # share of sales, fiscal 2026, with a peer benchmark from the co-op wholesaler's survey
    "gross margin":      (0.240, 0.255),
    "store wages":       (0.119, 0.112),
    "occupancy":         (0.040, 0.038),
    "other store costs": (0.035, 0.033),
    "support costs":     (0.035, 0.030),
}
op = sales * (drivers["gross margin"][0] - sum(v[0] for k, v in drivers.items() if k != "gross margin"))
print(f"Operating profit {op:.2f} ({op / sales:.1%} of sales)")
print("Value of closing the gap to the peer benchmark:")
for k, (now, peer) in drivers.items():
    gap = (peer - now) if k == "gross margin" else (now - peer)
    print(f"  {k:18s} now {now:5.1%} peer {peer:5.1%}  worth {gap * sales:5.2f}")
# Inside gross margin: shrink (waste, theft, damage) is 4.1 per cent of sales against 2.7 for peers.
shrink_now, shrink_peer = 0.041, 0.027
print(f"Shrink gap worth {(shrink_now - shrink_peer) * sales:.2f}; closing half of it: {(shrink_now - shrink_peer) / 2 * sales:.2f}")
# Store contribution after occupancy: five of the 22 stores lose money.
losers = {"Store 7": -0.62, "Store 12": -0.48, "Store 15": -0.31, "Store 19": -0.27, "Store 21": -0.22}
print(f"Five losing stores together: {sum(losers.values()):.2f}")Operating profit 3.50 (1.1% of sales) Value of closing the gap to the peer benchmark: gross margin now 24.0% peer 25.5% worth 4.77 store wages now 11.9% peer 11.2% worth 2.23 occupancy now 4.0% peer 3.8% worth 0.64 other store costs now 3.5% peer 3.3% worth 0.64 support costs now 3.5% peer 3.0% worth 1.59 Shrink gap worth 4.45; closing half of it: 2.23 Five losing stores together: -1.90
The code reproduces the division's operating profit of 3.5 million dollars, 1.1 percent of sales, and then asks how much each driver would be worth if Meadowlark matched the peer benchmark. The largest gap is gross margin: 24.0 percent against 25.5 percent for peers, worth 4.8 million dollars. Wages are next, 11.9 percent of sales against 11.2, worth 2.2 million. Support costs, the share of head office, distribution and systems charged to grocery, are worth 1.6 million. Occupancy and other store costs are close to benchmark.
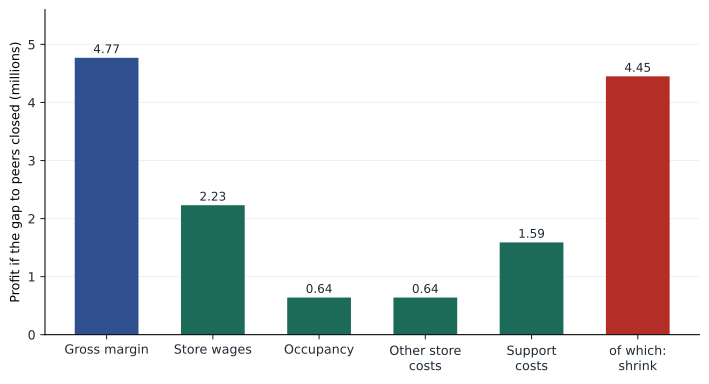
The gaps add up to much more than the 4.45 million the board needs, but Daniel warns the team not to add them up and declare victory. Benchmarks describe the average peer, not what Meadowlark can achieve; some gaps reflect real differences, such as small stores that cannot spread wages over high sales. And some gaps overlap: if the co-op cut shrink, gross margin would rise, so counting both would double count. The profit tree tells the team where to look, not how much it will find.
Testing the shrink hypothesis
Shrink is the difference between the value of goods a store receives and the value it sells, lost to spoilage, damage, theft and errors. In grocery, perishable departments such as produce, bakery, deli and meat account for most of it. Meadowlark's shrink is 4.1 percent of sales against 2.7 percent at peers, a gap worth 4.45 million dollars, which happens to equal the entire gap to the board's target. H1 is clearly supported by the hard data.
Daniel goes further to find the cause. He compares the 7 stores that use the co-op's computer-assisted ordering, which suggests order quantities from sales history, with the 15 that order by hand. Shrink in perishables averages 5.9 percent of perishable sales in hand-ordering stores and 3.8 percent in the others. He also finds that waste peaks in the week after large promotions, when stores have ordered for high demand that did not materialize, and on Mondays, after weekend deliveries arrive for stores closed on Sunday. His observation in the small-town back office, the clipboard of handwritten waste notes that nobody entered, now fits a pattern: stores cannot reduce what they do not measure.
Grace adds a point from her grocery experience: some shrink is a choice. A store that never runs out of fresh bread will throw some away; a store that throws nothing away will disappoint customers. The goal is not zero shrink but the right balance between waste and availability, managed department by department. The team therefore sets a realistic target of closing about half the gap, bringing shrink to 3.4 percent, worth about 2.2 million dollars a year. Dr. Mehta approves the restraint: a target managers believe is achievable is worth more than a heroic one they reject.
Promotions and price
The team's customer analysis showed that promotions confuse members. The financial analysis shows they also cost money. Promotions account for 31 percent of grocery sales, against about 24 percent at peers. Daniel examines the promotion records and finds that about a third of promotions sold no more units than the weeks before and after, once the dip after a promotion is counted: they simply gave margin away to members who would have bought anyway. Many are funded partly by suppliers through the wholesaler, but the co-op still bears part of the cost and the extra waste.
The team estimates that cutting the least effective promotions, simplifying the remaining ones around staples members buy often, and using the savings for clearer everyday prices on those staples would add about 1.0 million dollars of gross margin a year. This finding links the market and financial analyses: the same change that improves members' perception of price also improves margin.
Wages and scheduling
Store wages are 11.9 percent of sales against 11.2 percent at peers. Hana, who manages staffing at Lakeview Health, leads this analysis. She compares hourly sales with hours scheduled and finds a familiar pattern: staffing is set by habit in fixed blocks, so stores are overstaffed on quiet weekday mornings and short on Friday evenings and Saturdays, when queues form. A scheduling tool that matches hours to forecast traffic, as many grocers use, would reduce hours in quiet periods and add them in busy ones.
Hana is careful about how this is presented. The goal is not to cut jobs but to put hours where members need them, and most savings can come through normal turnover and fewer overtime hours. In the eight unionized stores, changes to scheduling practices must be discussed with the union under the collective agreements. The team estimates savings of about 0.3 points of sales, roughly 0.95 million dollars a year, less than half the gap, because small stores need a minimum crew regardless of traffic.
Store portfolio
H3 stated that a few stores drag down results. Daniel calculates each store's contribution after its own costs, including occupancy but before allocated support costs, which would be incurred whether or not a particular store existed. Five of the 22 stores have negative contribution, losing a combined 1.9 million dollars a year. H3 is supported: these five explain a large share of the division's weakness.
But the stores are not alike. Store 7, in a town that has lost its school and half its population, loses 0.62 million and has a discount store 15 minutes away. Store 12 loses 0.48 million but is the only grocery store within 40 minutes; closing it would leave older members without access to fresh food. Stores 15, 19 and 21 are small and share a site or a town with a co-op fuel and convenience station. The analysis therefore points to different answers for different stores: possible closure for one, protection for one that serves a community need, and conversion of three into a smaller format run with the fuel site. These options are developed in lesson 8.
Daniel also checks the allocation of support costs. If a store closes, its share of head office and distribution costs does not disappear; it is reallocated to the remaining stores. A store with positive contribution but negative profit after allocation should usually stay open, because closing it would make the co-op worse off. This point, familiar from relevant cost analysis in MBA-501, surprises two directors, who had been looking at fully allocated store profits.
Private label
H5, from the wholesaler, stated that a larger private label range would raise gross margin. The data refutes it. Meadowlark's private label share is already close to peers, private label items already carry the wholesaler's promotions, and in the survey members said they valued national brands and local products more. Store data also shows that where the private label range was expanded two years ago, gross margin did not rise. The team reports this result plainly. Refuted hypotheses are findings too: they stop the client from spending effort on a lever that will not work.
Checking how support costs are allocated
Support costs of 3.5 percent of sales, against 3.0 percent at peers, raise a question the team cannot answer from benchmarks alone: are grocery's support costs really higher, or are they simply allocated differently? Daniel reviews how head office, distribution and systems costs are charged to the three divisions. Most are allocated by share of revenue, which is simple but crude. Grocery generates 52 percent of revenue but, by Daniel's estimate of the work involved, uses closer to 60 percent of distribution activity because of frequent deliveries of fresh food, and less than half of head office time.
The cohort met this issue in MBA-501, where activity-based costing showed that allocation by revenue can hide which products or units really consume resources. Daniel does not rebuild the allocation, which would take weeks, but he estimates that a fairer method would change grocery's support costs by no more than 0.2 points of sales either way. The conclusion is that support costs are a modest opportunity for the co-op as a whole rather than a grocery problem, and the team leaves them out of its main recommendations, noting the question for Doug's finance team.
Worked problem
Should Store 7 close?
Store 7 has sales of 6.8 million and contribution after its own costs of −0.62 million. It is allocated 0.24 million of support costs, which would be reallocated if it closed. About 25 percent of its members also buy fuel at the co-op site in the same town, worth about 0.12 million a year in fuel margin that would be at risk. Closing would cost about 0.6 million once for severance, lease exit and write-offs. What is the annual effect of closing, and is it worth it?
Show solution
- The annual avoidable loss is the store's own contribution: closing removes −0.62 million, a gain of 0.62 million.
- Allocated support costs of 0.24 million do not disappear; they move to other stores, so they do not count as a saving.
- Lost fuel margin from members who stop coming to town is a cost: about 0.12 million a year.
- Net annual gain: 0.62 − 0.12 = about 0.50 million; the one-time cost of 0.6 million is recovered in a little over a year.
Answer: Closing Store 7 would improve results by about 0.5 million a year after the fuel effect, with a payback of about 14 months, but the board must weigh it against its promise of no more than two closures and the community effect.
Common mistakes
MistakeAdd up all benchmark gaps to find the total opportunity.
InsteadGaps overlap and reflect real differences; use them to locate opportunities, then estimate each one realistically.
MistakeAim for zero shrink.
InsteadSome waste is the cost of good availability; set department targets that balance both.
MistakeClose every store with negative fully allocated profit.
InsteadUse contribution after the store's own costs; allocated support costs do not disappear when a store closes.
MistakeLeave refuted hypotheses out of the report.
InsteadReport them; they stop the client from pursuing levers that will not work.
Summary and key terms
- Clean, reconciled data is the foundation of credible analysis; log every adjustment.
- A profit tree with each cost as a share of sales lets stores and peers be compared; benchmark gaps show where to look.
- Shrink of 4.1 percent against 2.7 for peers is the largest margin leak; hand ordering and promotion timing are major causes; closing half the gap is worth about 2.2 million.
- About a third of promotions gave away margin without lifting sales; simplifying them adds about 1.0 million and improves price perception.
- Scheduling hours to traffic could save about 0.95 million, mainly through turnover and overtime, with union consultation.
- Five stores lose 1.9 million, but they need different answers; decisions should use contribution after the store's own costs.
- Profit tree
- A breakdown of profit into its drivers, with values attached to each branch.
- Shrink
- Goods lost to spoilage, damage, theft and errors, measured as a share of sales.
- Store contribution
- A store's sales minus the costs it directly causes, before allocated support costs.
- Reconciliation
- Checking that detailed data adds up to audited or reported totals.
- Promotion lift
- The extra units a promotion sells beyond the normal level, after any later dip.
- Double counting
- Counting the same benefit twice under different headings.
Practice problems
Work each problem on paper first, then reveal the answer to check.
Grocery sales are 318 million and wages are 11.9 percent of sales. What saving does a 0.3-point reduction produce?
Show answer
0.003 × 318 = about 0.95 million a year.
Why should the team not simply add the shrink gap and the gross margin gap?
Show answer
Shrink is part of gross margin, so the shrink gap is already inside the gross margin gap; adding them double counts.
A store contributes +0.1 million after its own costs but shows −0.2 million after allocated support costs. Should it close on financial grounds?
Show answer
No; closing would lose the +0.1 million contribution, and the support costs would be reallocated to other stores.
What evidence refuted H5?
Show answer
Private label share was already near peers, members preferred national brands and local products, and an earlier expansion did not raise margin.
Lesson quiz · 5 questions
Score 60% or more to complete this lesson.
Create a free account to save your progress, take quizzes and earn a certificate.