
MBA-699 · Lesson 4 of 12 · 20 min
Research: interviews, surveys and secondary data
In the third week the Meadowlark team splits up and goes on the road. Grace spends two days in the co-op's two largest stores, walking the aisles with department managers. Daniel visits four small-town stores with Sunita's regional manager and sits in the back office with store managers while they place orders. Hana interviews members in the café of the largest store, at a farm supply store on a busy Saturday and, by video, in the evenings with young parents who cannot get away during the day. By the end of the fourth week the team has completed 38 interviews, received 1,214 survey responses and assembled three years of store data. This lesson covers how they gathered that evidence and how they judged its quality.
Consulting research draws on three kinds of evidence: primary qualitative evidence, mainly interviews and observation; primary quantitative evidence, such as surveys and the client's own transaction data; and secondary evidence, published by others. Each answers different questions. Interviews explain why things happen and reveal issues the team did not know to ask about. Surveys and data show how often and how much. Secondary sources provide context and benchmarks. Strong conclusions usually rest on more than one kind, a practice researchers call triangulation.
Interviews
Interviews are the consultant's most important research tool and the one most often done badly. A poor interview is a conversation in which the interviewer talks too much, asks leading questions and leaves with impressions rather than evidence. A good one is planned around the team's hypotheses, follows a guide without being bound by it, and produces notes that can be compared across interviews.
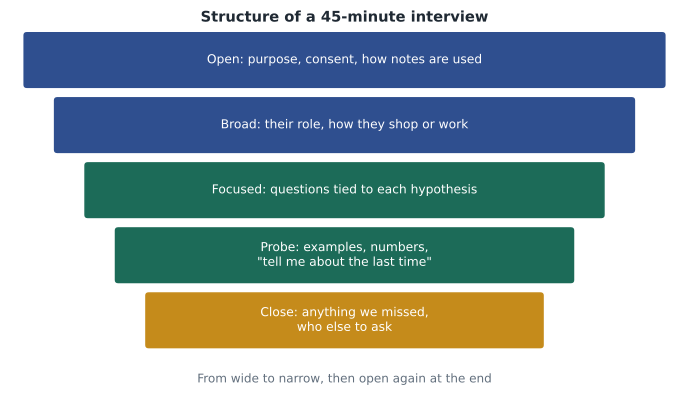
The team's interview guide follows the funnel in the figure. It opens by explaining the purpose of the engagement, how notes will be used and that comments will not be attributed to individuals without permission. It begins with broad questions about the person's role or shopping habits, which let people relax and often surface unexpected issues. It then moves to focused questions tied to the hypotheses, and probes for specific examples. Hana finds the most useful probe is 'Tell me about the last time that happened', because it draws out a real event instead of a general opinion. People's general opinions are often shaped by what they think they should say; their descriptions of specific events are harder to distort. The guide closes by asking what the team should have asked and whom else they should speak to.
Dr. Mehta gives the team several rules for interviewing.
- Ask open questions that begin with what, how or tell me about, not questions that can be answered yes or no.
- Avoid leading questions. 'Don't you think our prices are too high?' invites agreement; 'How do our prices compare with where else you shop?' does not.
- Listen more than you speak. A useful target is to talk for no more than a fifth of the interview.
- Ask for numbers when they exist: how often, how much, how many.
- Separate what you observed from what you were told, and both from your interpretation, in your notes.
- Write up notes within 24 hours, before memory blurs them.
Interviewing staff requires extra care. Store employees may fear that what they say will reach their managers or affect their jobs. In the eight unionized stores, the team informs the union steward about the interviews in advance, as agreed with Sunita, and makes clear that participation is voluntary. The team never asks staff to comment on named colleagues. These steps are both ethical and practical: frightened people give guarded answers.
Daniel's most important interview is not on the schedule. While watching a store manager in a small town place the weekly order for the bakery and produce departments, he notices that she orders by looking at the shelves and adding to last week's quantities, with no record of what was thrown out. When he asks how she knows what was wasted, she shows him a clipboard of handwritten notes that nobody enters into any system. Fifteen of the 22 stores order this way. Observation, Dr. Mehta says later, often finds what interviews miss, because people do not mention things they consider normal.
Surveys
Interviews show what people think and why, but 38 conversations cannot show how common a view is among 86,620 active members. For that, the team designs a member survey. A survey is only as good as its sample and its questions, and both need care.
The sample should represent the population the team wants to understand. The co-op emails an invitation to a random sample of active members, with paper copies at stores for members without email, and offers a small credit to members' accounts for completing it. The team checks the responses against membership records by age band and store; members over 65 are overrepresented, so the team weights the results to match the membership. Weighting corrects for known differences but cannot fix bias the team cannot see, such as the possibility that members who are unhappy with the co-op are less likely to respond.
Questions should be clear, neutral and answerable. The team avoids double-barrelled questions such as 'How satisfied are you with our prices and quality?', which asks two things at once. It uses balanced scales, puts general questions before specific ones so that earlier questions do not sway later answers, and tests the questionnaire on ten members before sending it. It asks members to estimate what share of their grocery spending goes to the co-op, which, although imperfect, can be checked against their actual purchases recorded under their membership number.
How many responses are enough? Daniel calculates the margin of error, the range within which the true population value is likely to fall, for different sample sizes. The calculation includes a finite population correction, which slightly reduces the margin when the sample is a noticeable share of the population.
import math
# Member survey: how many responses are needed, and how precise is the result?
active_members = 86_620
z = 1.96                      # 95 per cent confidence
def margin(n, p=0.5, N=active_members):
    fpc = math.sqrt((N - n) / (N - 1))
    return z * math.sqrt(p * (1 - p) / n) * fpc
def needed(e, p=0.5, N=active_members):
    n0 = z * z * p * (1 - p) / (e * e)
    return math.ceil(n0 / (1 + (n0 - 1) / N))
for e in (0.05, 0.03, 0.02):
    print(f"margin of error {e:.0%}: need {needed(e):5d} responses")
n = 1_214
print(f"actual responses {n}: margin of error {margin(n):.1%}")
# Subgroup: members under 40 were 236 of the responses
print(f"under-40 subgroup (236): margin of error {margin(236):.1%}")
# Interview coding: count how often each theme appears across 38 interviews
codes = {
    "price perception": 23, "fresh quality": 17, "no online ordering": 15,
    "patronage unclear": 19, "staff friendliness (positive)": 26,
    "store too far or hours too short": 9, "local products valued (positive)": 21,
    "out of stock": 14,
}
for theme, k in sorted(codes.items(), key=lambda kv: -kv[1]):
print(f"{theme:34s}{k:3d} of 38 {k / 38:4.0%}")margin of error 5%: need 383 responses margin of error 3%: need 1055 responses margin of error 2%: need 2337 responses actual responses 1214: margin of error 2.8% under-40 subgroup (236): margin of error 6.4% staff friendliness (positive) 26 of 38 68% price perception 23 of 38 61% local products valued (positive) 21 of 38 55% patronage unclear 19 of 38 50% fresh quality 17 of 38 45% no online ordering 15 of 38 39% out of stock 14 of 38 37% store too far or hours too short 9 of 38 24%
The 1,214 responses give a margin of error of about 2.8 percentage points at 95 percent confidence, slightly better than the 3-point target, which needed about 1,055 responses. But the subgroup the board cares most about, members under 40, provided only 236 responses, so results for that group are much less precise, about plus or minus 6.4 points. Hana flags this in every chart about younger members. A difference of 5 points between younger and older members might be real or might be noise; a difference of 19 points, as the team will find for share of spending, is very unlikely to be chance.
Coding qualitative data
The second part of the code counts how often each theme appeared across the 38 interviews. After writing up each interview, the team tagged passages with codes, short labels for themes such as price perception or patronage unclear. Coding turns a pile of notes into evidence that can be compared and counted. Counts must be read carefully: an interview sample is not random, and a theme mentioned by 61 percent of interviewees does not mean 61 percent of members agree. Counts show which themes are widespread among the people interviewed and help decide what the survey should measure.
Two positive themes stand out: 68 percent of interviewees praised the friendliness of staff, and 55 percent valued local products such as beef, honey and baking from nearby farms. Hana insists that these appear in the findings. Consultants often report only problems, which makes the client defensive and hides strengths that the strategy should build on, she says. Dr. Mehta agrees.
AI tools can help with coding. The team uses one, with Colin's permission and under the co-op's data policy, to suggest codes for anonymized interview notes, then reviews every suggestion. They find that the tool is fast and usually sensible but sometimes merges distinct themes, such as price and value, and occasionally attributes a comment to the wrong speaker. Human review remains essential.
Secondary data and benchmarks
Secondary research provides context the team cannot gather itself. The team uses census data on population and age by town, which shows that most small towns in Meadowlark's region are shrinking slowly and aging, while several towns near the larger cities are growing with young families. It uses official price statistics, which show that food bought from stores rose about 1.8 percent in the United States in the year to September 2026, much less than in 2022 and 2023, when grocery inflation was high and shoppers moved to discount stores. It reviews trade press on grocery margins and online ordering in small towns. And it uses the wholesaler's annual benchmark survey of member co-ops, which reports gross margin, shrink, wages and other costs as shares of sales for co-ops of similar size.
Benchmarks need care. The team checks how the survey defines shrink, whether peers include similar store sizes, and whether the figures are averages or medians. A benchmark from much larger urban stores would set an unrealistic target for a store in a town of 1,500 people. Grace's rule is to ask of every benchmark: compared with whom, measured how, and achieved by doing what?
Finally, the team keeps a source log: every fact in its analysis is linked to its source, date and any adjustments. It seems tedious in week four. It proves invaluable in week eleven, when a director asks where a number came from and Daniel can answer in seconds.
Worked problem
Fixing a flawed survey question
A draft survey question reads: 'Do you agree that Meadowlark should offer online ordering and lower prices to compete with big-box stores? Yes / No.' Identify the problems and rewrite it.
Show solution
- It is double-barrelled: it asks about online ordering and prices together, so a member who wants one but not the other cannot answer accurately.
- It is leading: 'to compete with big-box stores' suggests the answer the team expects.
- A yes or no format hides strength of feeling and offers no neutral option.
- Rewrite as two questions: 'How likely would you be to order groceries online for pickup at your Meadowlark store?' with a five-point scale from very unlikely to very likely, and 'Compared with other stores where you buy groceries, how would you rate Meadowlark's prices?' with a five-point scale from much lower to much higher.
Answer: Split the question, remove the leading phrase and use balanced scales so each answer measures one thing.
Common mistakes
MistakeInterview results show how common a view is among all members.
InsteadInterviews explain why; surveys or data are needed to show how common a view is.
MistakeA large total sample means every subgroup is measured precisely.
InsteadSubgroup margins depend on subgroup size; 236 responses give about plus or minus 6.4 points.
MistakeWeighting a survey removes all bias.
InsteadWeighting corrects known differences, such as age, but not unknown ones, such as unhappy members not responding.
MistakeA benchmark is a benchmark.
InsteadAsk who the peers are, how the measure is defined and how the result was achieved before using it as a target.
Summary and key terms
- Evidence comes from interviews and observation, surveys and data, and secondary sources; triangulating across them strengthens conclusions.
- Good interviews follow a guide built on hypotheses, use open, non-leading questions, probe for specific events and are written up quickly.
- Observation often reveals what interviews miss, such as Meadowlark's handwritten ordering in 15 stores.
- Survey quality depends on the sample and the questions; margins of error widen sharply for small subgroups.
- Coding turns interview notes into countable themes; counts describe the interview sample, not the population.
- Benchmarks and other secondary data must be checked for definitions and comparability, and every fact should be logged with its source.
- Triangulation
- Using several kinds of evidence to test the same conclusion.
- Leading question
- A question worded to suggest a particular answer.
- Margin of error
- The range within which the true population value is likely to lie, at a stated confidence level.
- Weighting
- Adjusting survey results so the sample matches known population characteristics.
- Coding
- Tagging qualitative notes with labels for themes so they can be compared and counted.
- Benchmark
- A reference value from comparable organizations used to judge performance.
Practice problems
Work each problem on paper first, then reveal the answer to check.
Rewrite the leading question 'Wouldn't you shop here more if we had an app?' as a neutral one.
Show answer
'What, if anything, would lead you to buy more of your groceries at Meadowlark?' followed later by a specific question about an app with a balanced scale.
Using the formula without the finite population correction, what is the 95 percent margin of error for 400 responses at p = 0.5?
Show answer
1.96 × √(0.25 / 400) = 1.96 × 0.025 = about 4.9 percentage points.
Why does Hana include positive themes in the findings?
Show answer
They are part of the evidence, they reduce client defensiveness and they reveal strengths the strategy should build on.
Give two questions to ask before using a peer benchmark for shrink.
Show answer
How is shrink defined and measured, and are the peers similar in store size, location and range?
Lesson quiz · 5 questions
Score 60% or more to complete this lesson.
Create a free account to save your progress, take quizzes and earn a certificate.