
LVT-320 · Lesson 6 of 12 · 20 min
Wi-Fi site surveys: predictive, passive and active
A Wi-Fi design is a prediction, and a survey is the measurement that tests it. Before St. Brendan's east wing was designed, Frank's team surveyed the shell; after installation, they will survey again to prove the result. At Hartwell, the re-survey after the racks filled found the dead aisles in lesson 4. A survey is also where an installer's habits show: a careless walk, an uncalibrated adapter or a missing floor plan scale can make a good network look bad or hide real problems. This lesson covers the kinds of survey, survey equipment and software, how to prepare and walk a survey, the metrics to collect and how to read heatmaps, the access-point-on-a-stick method, and how to turn survey data into a report.
Kinds of survey
There are three main kinds of Wi-Fi survey, and most projects use all three at different stages. A predictive survey is done in software, before anything is installed: the designer imports a scaled floor plan, draws the walls with their material losses, places virtual access points, and the software predicts coverage, SNR, channel overlap and capacity. A passive survey measures real signals: a survey adapter listens to every access point's beacons while the surveyor walks the space, recording signal strength and noise at each point, without connecting to any network. An active survey connects to the network while walking, measuring throughput, delay, packet loss and roaming, so it shows how a real client experiences the network.
| Survey | When | What it shows | Limits |
|---|---|---|---|
| Predictive | Design stage | Expected coverage, overlap and capacity | Only as good as the wall model |
| Passive | Before design, after installation | Real signal, noise and channel use from every access point | Says nothing about throughput or roaming |
| Active | Validation, troubleshooting | Real client performance: throughput, loss, roaming | Depends on the client used |
| Spectrum analysis | Any time, especially troubleshooting | Non-Wi-Fi interference: radar, video senders, microwave ovens | Shows energy, not networks |
A spectrum analysis survey is often added. Wi-Fi adapters only understand Wi-Fi frames; a spectrum analyzer shows all radio energy in a band, including non-Wi-Fi interference from wireless video senders, old cordless phones, microwave ovens and motion sensors. In a hospital, the clinical engineering team will also want to know about any medical devices transmitting in the Wi-Fi bands.
Equipment and software
Survey software runs on a laptop or tablet with one or more external survey adapters, or on a dedicated handheld survey instrument with its own radios. The software records each measurement against the surveyor's position on the floor plan. Professional tools support all three bands and current Wi-Fi generations, can survey with several adapters at once to capture every channel quickly, and include spectrum analysis. Adapters differ in sensitivity and antenna pattern, so survey software applies an offset to make one adapter's readings comparable with a typical client's. Frank insists the crew uses the same adapter models and offsets on every survey of a building, so before-and-after surveys are comparable.
Equally important is the floor plan. It must be the current architectural plan, scaled correctly in the software by measuring a known distance, a long wall or a column grid, and it must show doors, rooms and room numbers so the report can be read by the owner. A plan scaled wrongly by 20 percent makes every predicted cell 20 percent too big or too small, and every heatmap misleading.
Preparing a survey
Before walking, the surveyor confirms the requirements the network must meet, because a survey measures against targets. St. Brendan's requirements for the east wing, written by its network team and clinical engineering, include: primary signal of at least −67 dBm and secondary signal of at least −70 dBm everywhere staff work, for voice badges and roaming; SNR of at least 25 dB; no more than two other access points on the same channel heard above −85 dBm at any location; and specific checks in patient rooms, stairwells, elevator lobbies and the imaging suite. Different devices set different targets: a laptop browsing the web can manage with −75 dBm, but a voice badge or location tag needs more, and the most demanding device sets the design.
The surveyor also arranges access to every space, including locked rooms, mechanical rooms and staff areas, and plans the route so it covers each room, corridor and stairwell at a steady walking pace. In an occupied hospital, surveys happen with infection control precautions, without entering isolation rooms unless authorized, and at times that avoid clinical activity; patient privacy rules mean no photographs of patients or records.
Walking the survey
In a passive survey, the surveyor walks a planned route, clicking their position on the floor plan at regular intervals, typically every few meters, at each change of direction, and at doors. The software interpolates between clicks, so the surveyor must walk at a steady pace in a straight line between clicks; stopping to chat between clicks puts all the measurements made while standing at a point the software thinks was walked through. Walking into each room, not just past its door, is essential, because a reading in the corridor says little about the far side of a room. The adapter is held at the height where devices are used, about waist to chest height, and the surveyor's own body is part of the measurement, just as a nurse's body is part of every badge call.
Active surveys add a connection to the network. The survey device associates with the production network, or a test network, and runs a continuous test: transfers to a server for throughput, or a stream of small packets to measure delay, jitter and loss like a voice call. Walking the same route shows where throughput falls, where packets are lost, and where and how quickly the device roams between access points. Because results depend on the client, active surveys are best done with the device that matters most; at St. Brendan's, Frank's crew does an additional walk with a nurse badge on a test call while the survey runs.
Metrics and heatmaps
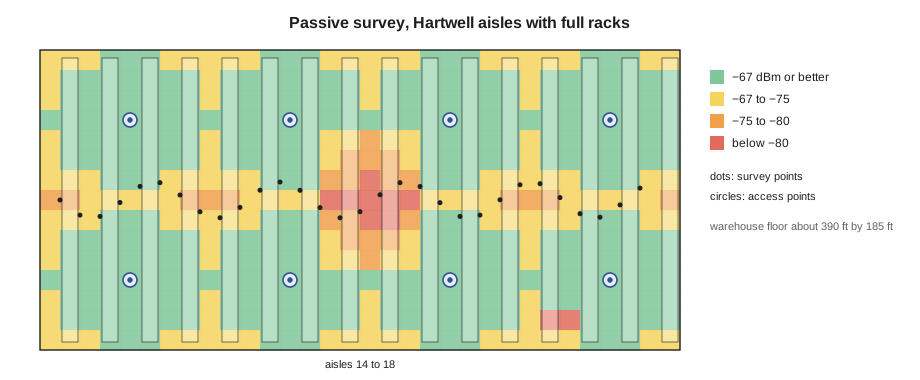
Survey software turns the measurements into heatmaps: colored floor plans showing a metric at every point. The most used are signal strength of the strongest access point, signal strength of the second strongest (the secondary coverage that roaming depends on), SNR, the number of access points on each channel heard at each location (channel overlap), data rate, and, from active surveys, throughput, loss and roaming events. Heatmaps are easy to misread. The color scale must match the requirement, for example green at −67 dBm and above, and the surveyor must check which band and which access points are included; a heatmap showing the strongest signal from all bands can hide a 5 GHz hole covered by 2.4 GHz.
# Survey data analysis: per-point primary and secondary signal, SNR and coverage against the requirement
import csv, io
data = '''x,y,area,primary_dbm,secondary_dbm,noise_dbm
6,13,Aisle 12,-58,-64,-95
6,39,Aisle 12,-61,-66,-95
6,66,Aisle 12,-60,-65,-95
20,13,Aisle 14,-63,-69,-95
20,39,Aisle 14,-78,-83,-94
20,66,Aisle 14,-74,-80,-95
33,39,Aisle 16,-81,-86,-94
33,66,Aisle 16,-76,-82,-95
46,39,Aisle 18,-72,-79,-95
59,39,Shipping,-55,-61,-96
59,66,Shipping,-57,-62,-96
72,39,Office,-52,-60,-96'''
REQ_PRIMARY, REQ_SECONDARY, REQ_SNR = -67, -70, 25
pts = list(csv.DictReader(io.StringIO(data)))
fails = {}
ok = 0
for p in pts:
    pri, sec, noise = float(p["primary_dbm"]), float(p["secondary_dbm"]), float(p["noise_dbm"])
    snr = pri - noise
    good = pri >= REQ_PRIMARY and sec >= REQ_SECONDARY and snr >= REQ_SNR
    ok += good
    if not good:
        fails.setdefault(p["area"], []).append(f"({p['x']},{p['y']}) {pri:.0f}/{sec:.0f} dBm SNR {snr:.0f}")
print(f"points {len(pts)}, meeting all targets {ok} ({100*ok/len(pts):.0f}%)")
for area, items in fails.items():
print(f"{area}: {len(items)} failing -> " + "; ".join(items))points 12, meeting all targets 7 (58%) Aisle 14: 2 failing -> (20,39) -78/-83 dBm SNR 16; (20,66) -74/-80 dBm SNR 21 Aisle 16: 2 failing -> (33,39) -81/-86 dBm SNR 13; (33,66) -76/-82 dBm SNR 19 Aisle 18: 1 failing -> (46,39) -72/-79 dBm SNR 23
Survey software produces this kind of analysis automatically, but writing it out makes the logic clear: each point must meet every requirement at once, and a point with a strong primary signal can still fail because its secondary signal is too weak for roaming. Maya's export from the Hartwell re-survey confirms the aisles 14 to 18 problem in numbers.
Access point on a stick
When a building is not yet built out or the wall model is uncertain, designers validate a predictive design with an access-point-on-a-stick survey, APoS. A single access point, the same model the design uses, is mounted on a tripod or pole at the planned height and position, powered by a battery and a PoE injector, and set to a known channel and power. The surveyor walks around it to measure its real cell in that part of the building, then moves it to the next representative location. The measurements show the real attenuation of walls and floors, which the designer feeds back into the model. Frank's team did APoS in three representative areas of the east wing shell: a patient room cluster, the imaging suite surroundings and a stairwell, and found the concrete stair walls lost about 8 dB more than the model assumed.
# APoS: compare measured cell edge with prediction and derive a wall correction
import math
def fspl(d_m, f_mhz): return 20 * math.log10(d_m) + 20 * math.log10(f_mhz) - 27.55
EIRP = 17.0   # dBm, access point at the design power on 5 GHz channel 40
points = [  # location, distance (ft), predicted wall loss dB, measured dBm
    ("Room 3.20 far wall", 20, 4, -60), ("Room 3.24 far wall", 33, 8, -66),
    ("Stair C landing", 39, 18, -86), ("Stair C half-landing", 46, 18, -90),
]
for loc, dist, pred_wall, meas in points:
    pred = EIRP - fspl(dist * 0.3048, 5200) - pred_wall
print(f"{loc:22s} predicted {pred:6.1f} dBm measured {meas:4d} difference {meas - pred:+5.1f} dB")Room 3.20 far wall predicted -49.5 dBm measured -60 difference -10.5 dB Room 3.24 far wall predicted -57.8 dBm measured -66 difference -8.2 dB Stair C landing predicted -69.3 dBm measured -86 difference -16.7 dB Stair C half-landing predicted -70.7 dBm measured -90 difference -19.3 dB
Reporting
A survey report tells the owner what was measured, against what requirement, and what was found, in language a facilities manager can follow. It includes the scope and requirements; the equipment, adapter offsets and software versions; the dates and conditions, such as stock levels or occupancy; heatmaps for each required metric and band, with legends matching the requirements; a list of areas that do not meet requirements, with cause and recommendation; and the raw survey files, so another surveyor can repeat or check the work. Frank adds photographs of every access point as installed, which the owner's team appreciates when an access point later goes missing above a ceiling.
Worked problem
A survey that looked too good
A trainee's post-installation survey of Brightwater's sixth floor shows −45 dBm or better almost everywhere, much stronger than predicted. Omar Haddad, Brightwater's network engineer, is suspicious. What should Maya check?
Show solution
- First, the floor plan scale: if the plan was scaled at half size, every walked distance is shorter than real and the heatmap is distorted, though that would not raise the levels themselves.
- Next, the adapter offset: an offset of +20 dB entered by mistake would raise every reading.
- Then, the band filter: a heatmap of all bands might be showing 2.4 GHz, which travels farther, while the requirement is for 5 and 6 GHz.
- She finds the offset field set for a different adapter model, corrects it, filters by band and regenerates the heatmaps, which now match the prediction within a few dB.
Answer: Check the scale, adapter offset and band filter before trusting any heatmap; here a wrong adapter offset inflated every reading.
Surveying a building in use
Most surveys after installation happen in buildings full of people, and the surveyor has to work around them. In a hospital, patient rooms are surveyed only with the nurse in charge's permission, clinical areas follow infection control rules for equipment that touches surfaces, and some rooms are entered only when empty. Frank's crew carries a printed list of rooms they could not enter and why, so that the report can show the gaps honestly instead of letting the software interpolate across them. In a warehouse, the surveyor follows the site's traffic rules, wears high-visibility clothing and walks only in marked pedestrian aisles, or surveys during a shift change when the forklifts are parked.
Common mistakes
MistakeSurveying with an unscaled or outdated floor plan.
InsteadScale the current plan from a measured distance before walking.
MistakeWalking past rooms instead of into them.
InsteadEnter each room; corridor readings do not show the far side.
MistakeStopping between position clicks.
InsteadWalk steadily in straight lines between clicks so interpolation is correct.
MistakeJudging a heatmap without checking its band and scale.
InsteadFilter by band and match the color scale to the requirement.
MistakeSurveying only with a laptop when badges are the critical device.
InsteadValidate with the most demanding device, too.
Summary and key terms
- Predictive surveys model coverage in software from scaled plans and wall losses.
- Passive surveys measure every access point's signal and noise while walking; active surveys measure real client performance.
- Spectrum analysis finds non-Wi-Fi interference.
- Consistent adapters, offsets and a correctly scaled plan make surveys comparable.
- Requirements, often −67 dBm primary, −70 dBm secondary and 25 dB SNR for voice, set the targets and the heatmap scale.
- Access-point-on-a-stick surveys measure real wall losses before installation.
- Reports state requirements, methods, results, failing areas and recommendations, with raw files.
- Predictive survey
- A coverage model made in software before installation.
- Passive survey
- A survey that records beacons from all access points without connecting.
- Active survey
- A survey that connects to the network and measures client performance while walking.
- Heatmap
- A colored floor plan showing a measured or predicted metric.
- Secondary coverage
- The signal from the second-strongest access point, needed for roaming.
- APoS
- Access point on a stick: a temporary access point used to measure a real cell.
- Adapter offset
- A correction applied so a survey adapter's readings match a typical client.
Practice problems
Work each problem on paper first, then reveal the answer to check.
What does a passive survey not show?
Show answer
Throughput, packet loss and roaming performance.
Why must the floor plan be scaled before surveying?
Show answer
So measured positions and cell sizes are correct.
What secondary signal does St. Brendan's require for voice?
Show answer
−70 dBm or better.
What did APoS in stairwell C show?
Show answer
The concrete walls lost about 8 dB more than the model assumed.
Lesson quiz · 5 questions
Score 60% or more to complete this lesson.
Create a free account to save your progress, take quizzes and earn a certificate.