
JS-250 · Lesson 2 of 12 · 30 min
Measuring with browser tools
▶ Video coming soon A video version of this lesson is on the way.
On Thursday, August 24, Mira arrives with a plan to start shrinking photos. Gareth asks her to wait one more session. Before changing anything, he wants a set of measurements they can repeat after every fix, taken the same way each time, so that they will know which changes helped and by how much. Today's lesson is about the tools that take those measurements: the browser's own developer tools, Lighthouse, PageSpeed Insights, and the performance timing interfaces that let a page measure itself.
A repeatable test setup
A measurement is only useful if it can be repeated. Gareth writes the studio's test setup into the project's README so that everyone measures the same way. Lab tests use an empty cache unless a test is specifically about repeat visits. They run on two profiles, a fast desktop and a slower phone, and each test is run three to five times with the median result reported, because a single run can be thrown off by anything from a background update to a busy laptop fan.
| Setting | Desktop profile | Phone profile |
|---|---|---|
| Screen | 1,350 × 940 CSS pixels | 412 × 823 CSS pixels at 2× density |
| Network | No throttling (office connection) | About 300 ms round trip, 1.6 Mbps down |
| Processor | No slowdown | Four times slower than the laptop |
| Cache | Empty, unless testing repeat visits | Empty, unless testing repeat visits |
| Runs | Median of five | Median of five |
The phone profile is deliberately pessimistic. It matches the church hall's Wi-Fi on a busy morning and the four-year-old phones many volunteers use, rather than the newest flagship. Gareth's rule is that a page which is fast on the slow profile will be fast for almost everyone, while a page tuned only on the fast profile will surprise its slowest visitors.
The Network panel
Chrome's DevTools opens with F12 or from the browser's menu. The Network panel lists every request the page makes, in the order they started, with the size, the time taken and a waterfall: a bar for each request showing when it started and how long each phase took. Three settings at the top of the panel matter for performance testing. Disable cache makes the browser fetch everything again, as a first-time visitor would. The throttling menu slows the network to one of several presets or a custom profile. And Preserve log keeps the list when the page navigates, so a redirect does not wipe the evidence.
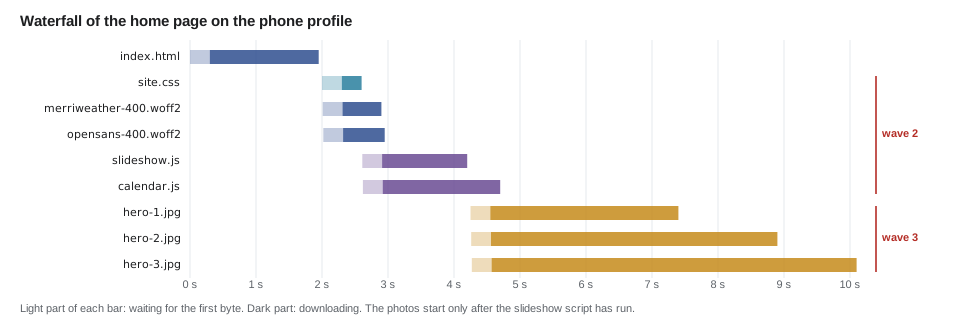
Reading a waterfall is mostly about looking for two shapes. A staircase, where each request starts only after the previous one finishes, means the browser discovered resources late, often because one file refers to another, which refers to a third. A long bar means one request is big or slow. The Food Hub home page shows both. The slideshow script is discovered only after the CSS has loaded, the script then requests the photos, and the first photo starts downloading more than two seconds after the HTML arrived even though it is the most important thing on the page.
Each bar in the waterfall is made of phases, and the browser exposes the same phases to JavaScript through the Resource Timing and Navigation Timing interfaces. Every timestamp is a number of milliseconds since the page started loading. Mira takes the navigation entry from one test run and turns its timestamps into the durations the waterfall shows.
// The Navigation Timing entry from one phone-profile test (rounded to whole milliseconds).
const nav = {
  startTime: 0, domainLookupStart: 3, domainLookupEnd: 305, connectStart: 305,
  secureConnectionStart: 610, connectEnd: 912, requestStart: 913, responseStart: 1688,
  responseEnd: 1950, domInteractive: 2440, domContentLoadedEventEnd: 2510, loadEventEnd: 10170,
};

const phases = [
  ['DNS lookup', nav.domainLookupEnd - nav.domainLookupStart],
  ['TCP connect', nav.secureConnectionStart - nav.connectStart],
  ['TLS', nav.connectEnd - nav.secureConnectionStart],
  ['waiting for first byte', nav.responseStart - nav.requestStart],
  ['downloading HTML', nav.responseEnd - nav.responseStart],
];
for (const [name, ms] of phases) console.log(`${name.padEnd(24)}${String(ms).padStart(6)} ms`);
console.log(`${'time to first byte'.padEnd(24)}${String(nav.responseStart - nav.startTime).padStart(6)} ms`);
console.log(`${'DOM content loaded'.padEnd(24)}${String(nav.domContentLoadedEventEnd).padStart(6)} ms`);
console.log(`${'load event finished'.padEnd(24)}${String(nav.loadEventEnd).padStart(6)} ms`);DNS lookup 302 ms TCP connect 305 ms TLS 302 ms waiting for first byte 775 ms downloading HTML 262 ms time to first byte 1688 ms DOM content loaded 2510 ms load event finished 10170 ms
What this code does
Each phase is the difference between two timestamps in the entry, so the same subtraction works on any page in any modern browser. On the phone profile, DNS, TCP and TLS each cost about one 300 ms round trip before a single byte of HTML arrives. The load event comes almost eight seconds after the DOM is ready, because it waits for the slideshow photos.
Two numbers in that output deserve names. Time to first byte (TTFB) is how long the browser waited from the start of the navigation until the first byte of the HTML arrived. It includes the connection setup and the time the server took to build the page. Here it is 1,688 ms, of which 475 ms was Theo's PHP application building the home page from the database. The load event fires when the page and everything it refers to has finished loading. It is easy to measure but poor at describing what people see, because a page can look finished long before it, or keep shifting long after.
The waterfall also makes waves of requests visible. Mira writes a helper that groups the home page's requests into waves: requests that start before the previous wave has finished belong together, and a request that starts only after everything before it has finished begins a new wave. Each wave costs at least one round trip, so the number of waves is a good measure of how much the page is limited by latency.
// [name, start ms, end ms] from the Resource Timing entries, sorted by start time.
const entries = [
  ['index.html', 0, 1950], ['site.css', 2000, 2600], ['merriweather-400.woff2', 2010, 2900],
  ['opensans-400.woff2', 2020, 2950], ['slideshow.js', 2610, 4200], ['calendar.js', 2620, 4700],
  ['hero-1.jpg', 4250, 7400], ['hero-2.jpg', 4260, 8900], ['hero-3.jpg', 4270, 10100],
];

const waves = [];
for (const [name, start, end] of entries) {
  const current = waves.at(-1);
  if (current && start < current.end) {
    current.items.push(name);
    current.end = Math.max(current.end, end);
  } else {
    waves.push({ items: [name], start, end });
  }
}
waves.forEach((w, i) => console.log(`wave ${i + 1} (${w.start}-${w.end} ms): ${w.items.join(', ')}`));wave 1 (0-1950 ms): index.html wave 2 (2000-10100 ms): site.css, merriweather-400.woff2, opensans-400.woff2, slideshow.js, calendar.js, hero-1.jpg, hero-2.jpg, hero-3.jpg
What this code does
The loop keeps the current wave's end time and adds each request to that wave if it starts before the wave ends; otherwise it opens a new wave. The site.css request starts after index.html finishes, so it begins wave 2, but the two fonts and the two scripts overlap with it and join that wave. The photos form a third wave, because the slideshow script has to load before it asks for them.
Three waves on the phone profile means at least three round trips of pure waiting, about a second, before the first photo even starts downloading. Lesson 5 removes a wave by letting the browser find the first photo in the HTML instead of waiting for the script.
The Performance panel
The Network panel shows what was downloaded. The Performance panel shows what the browser did with it. Recording a page load produces a timeline with the network requests at the top, screenshots of the page as it appeared, and below them the main thread: the single thread on which the browser parses HTML, calculates styles, lays out the page, paints, and runs almost all JavaScript. Work on the main thread is shown as a flame chart, with each function call as a bar under the function that called it.
Since 2024, Chrome's Performance panel opens with a live metrics view that shows the page's Largest Contentful Paint, Cumulative Layout Shift and Interaction to Next Paint as you use it, the three Core Web Vitals that lesson 3 explains, alongside field data for the same page when Google has enough of it. A recording also has an insights sidebar that points at likely problems, such as an image that was discovered late or a font that delayed text. These views change quickly between Chrome versions, so the course describes what to look for rather than exactly where each button is.
- CPU throttling. The panel can slow the processor four or six times to imitate a phone. Without it, JavaScript problems are almost invisible on a developer's laptop.
- Long tasks. Any task on the main thread that runs for more than 50 ms is marked with a red corner. While a long task runs, the page cannot respond to taps.
- Screenshots. The filmstrip shows when each part of the page appeared, which makes late images and jumping text obvious.
- Layout shifts. Elements that moved are highlighted, so the cause of a jump can be found.
On the phone profile, the home page's recording shows a 680 ms long task shortly after the HTML arrives: the calendar script building the whole year of cooking classes before the page has even shown its first photo. Lesson 7 is about breaking up work like that. For now Mira adds it to the list of findings, with a screenshot of the flame chart for the review.
Lighthouse and PageSpeed Insights
Lighthouse is an automated lab test built into Chrome's DevTools and also available as a command-line tool. It loads the page with a simulated phone and network, measures several metrics, scores each one against values collected from real websites, and combines them into a performance score from 0 to 100. It also lists opportunities, such as images that could be smaller, with an estimate of what each would save.
| Metric | What it measures | Weight in the score |
|---|---|---|
| First Contentful Paint | When the first text or image appears | 10 |
| Speed Index | How quickly the visible page fills in | 10 |
| Largest Contentful Paint | When the main content appears | 25 |
| Total Blocking Time | How long the main thread was blocked by long tasks | 30 |
| Cumulative Layout Shift | How much the page jumped while loading | 25 |
Total Blocking Time is a lab stand-in for responsiveness. A lab test has nobody tapping the screen, so Lighthouse cannot measure how quickly the page responds to a real tap. Instead it adds up, for every long task between the first paint and the point the page settles, the part of the task beyond 50 ms. A page with a lot of blocking time is likely to respond slowly when a real person taps it.
// Lighthouse-style Total Blocking Time: the part of each long task beyond 50 ms.
const tasks = [12, 680, 45, 90, 230, 30, 51];   // main-thread tasks in ms, in order

const blocking = tasks.map((ms) => Math.max(0, ms - 50));
const tbt = blocking.reduce((a, b) => a + b, 0);
console.log('long tasks:', tasks.filter((ms) => ms > 50).join(', '), 'ms');
console.log('blocking parts:', blocking.filter(Boolean).join(' + '), '=', tbt, 'ms');

// The performance score is a weighted average of the metric scores (each 0 to 100).
const weights = { fcp: 10, si: 10, lcp: 25, tbt: 30, cls: 25 };
const scores = { fcp: 74, si: 52, lcp: 11, tbt: 38, cls: 41 };
const total = Object.entries(weights).reduce((sum, [k, w]) => sum + w * scores[k], 0) / 100;
console.log('performance score:', Math.round(total));long tasks: 680, 90, 230, 51 ms blocking parts: 630 + 40 + 180 + 1 = 851 ms performance score: 37
What this code does
Each task contributes only its time beyond 50 ms, so the 45 ms task adds nothing and the 51 ms task adds 1 ms. The 680 ms calendar task alone contributes 630 ms of the 851 ms total. The score is a weighted average, which is why a poor LCP and a poor blocking time pull the home page down to 37 even though its first paint is reasonable.
Gareth's advice about the score is to use it as a smoke alarm, not a goal. A score of 37 says the page has serious problems, and the list of opportunities says roughly where. But the score comes from a single simulated run, changes between Lighthouse versions, and can move a few points between identical runs. Decisions should be based on the individual metrics, and on field data when it exists.
PageSpeed Insights, Google's website at pagespeed.web.dev, runs Lighthouse on Google's servers and, above the Lighthouse report, shows field data from the Chrome UX Report (CrUX): measurements collected from real Chrome users who have opted in, published for pages and whole sites that get enough traffic. Mira tries it on the home page and the recipe pages. The home page has field data; the individual recipe pages do not, because each one gets too few visits from opted-in Chrome users to be published. Lesson 11 fills that gap with the studio's own field measurements.
A scripted lab test
Clicking through DevTools is fine for exploring, but the studio needs tests it can repeat exactly, before and after each fix and later in continuous integration. Gareth shows Mira how to script one with Playwright, the browser automation tool they set up for end-to-end tests in JS-210. The script below starts a tiny test server that imitates the phone profile's slow connection, loads a copy of the home page's top section in Chromium with a phone-sized window, and reads the timings from the page itself.
// measure.cjs: load a test copy of the home page on a simulated weak connection and report timings.
const http = require('node:http');
const fs = require('node:fs');
const { chromium } = require('playwright');

const RTT_MS = 300;            // added before every response, like a slow round trip
const BYTES_PER_S = 200_000;   // about 1.6 megabits per second
const photo = fs.readFileSync(process.argv[2] ?? 'hero.jpg');
const html = `<!doctype html><html lang="en"><head><meta charset="utf-8"><title>Test home page</title>
<style>body{font-family:sans-serif;margin:0} img{width:100%;height:auto;display:block}</style></head>
<body><h1>Riverside Community Food Hub</h1>
<img src="/hero.jpg" width="1600" height="800" alt="Volunteers packing hampers"></body></html>`;

// Send a body slowly, in 10 kB slices, to imitate the bandwidth limit.
function sendSlowly(res, body) {
  let i = 0;
  const step = 10_000;
  const timer = setInterval(() => {
    res.write(body.subarray(i, i + step));
    i += step;
    if (i >= body.length) { clearInterval(timer); res.end(); }
  }, (step / BYTES_PER_S) * 1000);
}

const server = http.createServer((req, res) => {
  setTimeout(() => {
    if (req.url === '/hero.jpg') { res.writeHead(200, { 'content-type': 'image/jpeg', 'content-length': photo.length }); sendSlowly(res, photo); return; }
    res.writeHead(200, { 'content-type': 'text/html' }); res.end(html);
  }, RTT_MS);
});

server.listen(0, async () => {
  const browser = await chromium.launch();
  const tab = await browser.newPage({ viewport: { width: 412, height: 823 }, deviceScaleFactor: 2 });
  await tab.goto(`http://127.0.0.1:${server.address().port}/`, { waitUntil: 'load' });
  await tab.waitForTimeout(1000);  // let the photo be decoded and painted
  const r = await tab.evaluate(() => new Promise((resolve) => {
    new PerformanceObserver((list) => {
      const lcp = list.getEntries().at(-1);
      const nav = performance.getEntriesByType('navigation')[0];
      resolve({ ttfb: nav.responseStart, dcl: nav.domContentLoadedEventEnd, load: nav.loadEventEnd, lcp: lcp.startTime, el: lcp.element?.tagName.toLowerCase() });
    }).observe({ type: 'largest-contentful-paint', buffered: true });
  }));
  const s = (ms) => `${(Math.round(ms / 100) / 10).toFixed(1)} s`;
  console.log(`photo ${Math.round(photo.length / 1000)} kB`);
  console.log(`time to first byte   ${s(r.ttfb)}`);
  console.log(`DOM content loaded   ${s(r.dcl)}`);
  console.log(`largest paint (LCP)  ${s(r.lcp)}  <${r.el}>`);
  console.log(`load event           ${s(r.load)}`);
  await browser.close();
  server.close();
});
What this code does
The test server waits 300 ms before every response and sends the photo in small slices at about 1.6 megabits per second, which imitates the phone profile's network without depending on DevTools throttling. In the page, a PerformanceObserver reads the buffered Largest Contentful Paint entries after the photo has had time to be painted, and Navigation Timing supplies the other numbers. The run below is real: on this simulated connection, the 934 kB photo takes about five seconds, and it is the page's largest paint.
$ node measure.cjs hero.jpg
photo 934 kB
time to first byte   0.3 s
DOM content loaded   0.3 s
largest paint (LCP)  5.3 s  <img>
load event           5.3 s
The numbers come from a local test page on a simulated connection, so they are not the real site's numbers. They are, however, measured by a real browser, and they move when the page changes. That is exactly what a regression test needs. In lesson 4, the same script measures the page again after the photo is resized, and in lesson 11 it becomes part of the studio's continuous integration.
Letting the page measure itself
The browser's timing interfaces are not only for test scripts. Any page can read them, which is how field data is collected. Three more interfaces round out the toolkit. User Timing lets code add its own marks and measures, such as when the volunteer portal's shift list finished rendering. PerformanceObserver reports new entries as they happen, including long tasks and the Core Web Vitals entries. And the Server-Timing response header lets the server report how long its own steps took, so that the browser's tools can show the time inside the server next to the network time.
// In the volunteer portal: mark when the shift list is on screen, and watch for long tasks.
performance.mark('shifts-requested');
const shifts = await fetchShifts();
renderShiftList(shifts);
performance.mark('shifts-shown');
performance.measure('shift-list', 'shifts-requested', 'shifts-shown');

new PerformanceObserver((list) => {
  for (const task of list.getEntries()) {
    console.debug('long task', Math.round(task.duration), 'ms');
  }
}).observe({ type: 'longtask', buffered: true });
What this code does
The two marks record timestamps with names, and the measure records the time between them, which then appears in the Performance panel's timings track. The observer is called with every long task the browser records, including those from before the observer was created because of the buffered option. In lesson 11 the measure is sent to the studio's own collector instead of the console.
Theo's PHP application now adds a Server-Timing header to the home page, listing how long the database query, the template and the cache lookup took. DevTools shows these values in the request's Timing tab. Mira writes the parser the studio's collector will use to read them.
// Parse a Server-Timing header into named durations.
function parseServerTiming(header) {
  return header.split(',').map((part) => {
    const [name, ...params] = part.trim().split(';').map((s) => s.trim());
    const metric = { name };
    for (const p of params) {
      const [key, value = ''] = p.split('=');
      metric[key] = key === 'dur' ? Number(value) : value.replace(/^"|"$/g, '');
    }
    return metric;
  });
}

const header = 'db;dur=212.4;desc="Programs and news", tpl;dur=148, cache;desc="miss", total;dur=475';
for (const m of parseServerTiming(header)) {
  console.log(m.name.padEnd(6), m.dur !== undefined ? `${m.dur} ms` : '-', m.desc ?? '');
}db 212.4 ms Programs and news tpl 148 ms cache - miss total 475 ms
What this code does
Each metric in the header is separated by a comma, and each metric's parameters by semicolons, so two levels of split() take it apart. The dur parameter is converted to a number and a quoted desc has its quotes removed. The output shows that 212 ms of the 475 ms the server spent went to the database, which tells Theo where to look first.
Mira's baseline
By the end of the session Mira has a baseline for the three pages the course will work on: the home page, a typical recipe page and the volunteer portal's shift list. Each number is the median of five runs on the phone profile, and every later lesson compares against this table.
| Page | Bytes | Requests | LCP | Total Blocking Time | CLS | Lighthouse |
|---|---|---|---|---|---|---|
| Home page | 9,400 kB | 16 | 7.5 s | 851 ms | 0.31 | 37 |
| Recipe page | 4,300 kB | 11 | 6.4 s | 210 ms | 0.18 | 48 |
| Portal shift list | 1,180 kB | 9 | 5.2 s | 1,340 ms | 0.04 | 41 |
Worked problem
Finding the server's share of the wait
On the phone profile, the home page's HTML request starts at 913 ms and its first byte arrives at 1,688 ms. The round-trip time is 300 ms. The Server-Timing header says the server spent 475 ms in total. How much of the wait for the first byte was the server, and how much was the network? If Theo halves the database time of 212.4 ms, what would the wait become?
Show solution
- The wait for the first byte is 1,688 − 913 = 775 ms.
- The server accounts for 475 ms of it.
- The rest, 775 − 475 = 300 ms, is one round trip: the request traveling to the server and the first byte traveling back.
- Halving the database time saves 212.4 ÷ 2 = 106.2 ms.
- The new wait would be about 775 − 106.2 = 668.8 ms, or about 669 ms.
Answer: The server takes 475 ms and the network 300 ms. Halving the database time would cut the wait to about 669 ms; no server change can remove the 300 ms round trip.
Common mistakes
MistakeMeasuring once and trusting the number.
InsteadRun each test three to five times and use the median, because single runs vary.
MistakeLeaving the cache enabled during a first-visit test.
InsteadTick Disable cache, or use a fresh profile, so the test sees what a new visitor gets.
MistakeTesting JavaScript on an unthrottled laptop processor.
InsteadUse the Performance panel's CPU throttling, or a real mid-range phone.
MistakeChasing the Lighthouse score itself.
InsteadUse the score to find problems, and judge fixes by the individual metrics and by field data.
MistakeExpecting PageSpeed Insights to have field data for every page.
InsteadField data is published only for pages and sites with enough Chrome traffic; collect your own for the rest.
Summary and key terms
- A useful measurement is repeatable: fixed profiles, an empty cache and the median of several runs.
- The Network panel's waterfall shows staircases of late-discovered requests and long bars for big ones.
- Navigation and Resource Timing expose the same phases to JavaScript.
- The Performance panel shows the main thread, long tasks over 50 ms, screenshots and layout shifts, and Chrome's live metrics show the Core Web Vitals as you use a page.
- Lighthouse is a lab test whose score is a weighted average of five metrics, with Total Blocking Time standing in for responsiveness.
- PageSpeed Insights adds Chrome UX Report field data when there is enough traffic.
- Scripted tests with Playwright give exact, repeatable numbers, and User Timing, PerformanceObserver and Server-Timing let pages and servers report their own timings.
- Waterfall
- A chart of a page's requests over time, one bar per request split into its phases.
- Time to first byte (TTFB)
- The time from the start of a navigation until the first byte of the HTML arrives.
- Main thread
- The thread on which the browser parses HTML, runs most JavaScript, calculates styles, lays out and paints.
- Long task
- A task on the main thread lasting more than 50 ms, during which the page cannot respond to input.
- Total Blocking Time
- The sum of the parts of long tasks beyond 50 ms during page load; a lab stand-in for responsiveness.
- Lighthouse
- An automated lab test that measures a page with a simulated device and network and scores it.
- Chrome UX Report (CrUX)
- Google's public dataset of field performance data from opted-in Chrome users.
- Server-Timing
- A response header in which the server reports the durations of its own steps.
Practice problems
Work each problem on paper first, then reveal the answer to check.
What does a staircase pattern in a waterfall usually mean?
Show answer
Resources are discovered late, each only after the one before it has loaded, so the page pays a round trip for every step.
Why does Lighthouse use Total Blocking Time instead of a responsiveness measurement?
Show answer
A lab test has no real person tapping the page, so it estimates responsiveness from how long the main thread was blocked.
A task runs for 120 ms. How much does it add to Total Blocking Time?
Show answer
70 ms, the part beyond 50 ms.
Why do the individual recipe pages have no field data in PageSpeed Insights?
Show answer
The Chrome UX Report publishes only pages with enough visits from opted-in Chrome users, and each recipe page gets too few.
Try it yourself
Phases of a resource
Complete phases(e) so that it returns an object with three durations in milliseconds: wait (from requestStart to responseStart), download (from responseStart to responseEnd) and total (from startTime to responseEnd).
The program prints the phases of two Resource Timing entries.
function phases(e) {
  return { wait: 0, download: 0, total: 0 };
}

const photo = { name: 'hero-1.jpg', startTime: 3950, requestStart: 3955, responseStart: 4262, responseEnd: 7100 };
const css = { name: 'site.css', startTime: 1700, requestStart: 1702, responseStart: 2010, responseEnd: 2300 };
for (const e of [photo, css]) console.log(e.name, JSON.stringify(phases(e)));
Try it yourself
Total Blocking Time
Complete totalBlockingTime(tasks) so that it returns the sum, over all tasks, of the part of each task beyond 50 ms. Tasks of 50 ms or less add nothing.
Also complete longTasks(tasks) so that it returns how many tasks are longer than 50 ms.
function totalBlockingTime(tasks) {
  return 0;
}

function longTasks(tasks) {
  return 0;
}

const portal = [40, 1180, 75, 50, 220, 8];
console.log(totalBlockingTime(portal), 'ms in', longTasks(portal), 'long tasks');
console.log(totalBlockingTime([10, 20, 50]), 'ms in', longTasks([10, 20, 50]), 'long tasks');
Lesson quiz · 5 questions
Score 60% or more to complete this lesson.
Create a free account to save your progress, take quizzes and earn a certificate.