
JS-250 · Lesson 1 of 12 · 28 min
Why performance matters
▶ Video coming soon A video version of this lesson is on the way.
On Tuesday, August 22, 2028, Gareth and Mira start their eleventh block of sessions in the studio. Three weeks earlier the order board went up on the kitchen wall, staff sign-in went live and the partner agencies started getting notifications. Nobody expected the next project to be about speed, but over the summer the complaints arrived from three directions at once, and they all said the same thing in different words: the Food Hub's web pages are slow.
Dev Bhatt sent the first one. Since the public site launched in December 2026 it has grown a News and Recipes section, a photo slideshow at the top of the home page, a donation form from an outside payment service and a calendar of cooking classes. Dev posts photos straight from his phone, and he had noticed that the recipe pages took so long to appear on the bus that he gave up waiting for his own work. Lucy Tran sent the second. Volunteers checking in for shifts at the church hall where the December hamper drive is packed say the volunteer portal sits on a white screen for most of a minute on the hall's Wi-Fi, and sometimes never opens at all. Rosa Delgado sent the third, more briefly: when the kitchen's Wi-Fi drops, the order board goes blank until it comes back.
This course is about those three problems. The first half is about making pages fast: measuring them properly, understanding the metrics Google and the browser vendors use, and fixing images, scripts, caching and rendering. The second half is about making web apps reliable when the network is not: service workers, offline support and installable apps. The capstone, in lesson 12, takes the slow public site and makes it fast, with numbers to prove it. Everything in the course is planned for August and September 2028, with a review on Friday, September 29.
Speed is part of the content
Gareth starts with a question: what is a web page for? The answer for the Food Hub is plain. The home page tells people when the grocery program is open, the recipe pages teach people to cook with what is in their hamper, the donation page raises money and the volunteer portal gets people into shifts. A page that takes ten seconds to show any of that has failed at its job for every visitor who left during those ten seconds, however good the words and pictures are. Speed is not decoration added at the end. It decides whether the content reaches anyone.
Research on how people experience waiting has been stable for decades. A response within about a tenth of a second feels instant, as if the person caused it directly. Within about one second, people notice the delay but keep their train of thought. Beyond about ten seconds, attention wanders and many people leave or switch to something else. These limits come from studies of human attention, not from any particular technology, which is why they still hold on phones in 2028.
| Delay | How it feels | What it means for a page |
|---|---|---|
| Under about 0.1 s | Instant; the person caused it | Taps, typing and toggles should respond this fast |
| About 0.1 to 1 s | A noticeable pause, attention kept | Moving to a new page or opening a panel |
| About 1 to 10 s | Waiting; needs a sign of progress | Loading data or a heavy page |
| Over about 10 s | Attention lost; many people leave | A failure for most visitors |
The table also explains why performance is more than one number. A page can show its main content quickly and still feel slow if a tap on the menu button takes half a second to do anything. It can respond instantly and still annoy people if the text jumps down the screen just as they try to tap a link. Lesson 3 turns these three kinds of experience, loading, responding and staying still, into the three Core Web Vitals.
Who visits the Food Hub
Mira's first instinct is to open the site on the studio's fast laptop and fiber connection, where it seems fine. Gareth stops her. The people the Food Hub serves are more likely than average to be on an older or cheaper phone, on a prepaid plan with a monthly data allowance, or on a shared Wi-Fi network in a library, a shelter or a church hall. A page that loads in one second on a new laptop can take ten on a four-year-old phone on a weak mobile signal, because the phone's processor is several times slower and the network adds long delays to every request.
Data also costs money. A visitor on a small monthly allowance pays, in a very direct way, for every megabyte the home page sends. Dev's photos are a good example. A photo straight from a modern phone camera is often 3 to 5 MB, and the recipe pages send them at full size even though they are shown about as wide as a playing card. Every visit to a recipe page uses up a share of somebody's plan for pictures they cannot see in full detail.
- Performance is accessibility. People using older devices, slow connections or assistive technology are hit hardest by heavy pages. A fast page is usable by more people.
- Performance is fairness. The visitors with the least money and the worst connections are often the ones the Food Hub most wants to reach.
- Performance is findability. Google's search ranking systems use Core Web Vitals as one of many signals, so a slow page can be harder to find, although good content still matters far more.
- Performance is reliability. A page that needs 90 requests has 90 chances to fail on a bad connection. A lean page is more likely to load at all.
What happens when a page loads
To fix a slow page, Mira needs a picture of what the browser is doing while the visitor waits. Gareth draws the main steps on the whiteboard. Each step has its own cost, and each later lesson attacks one or more of them.
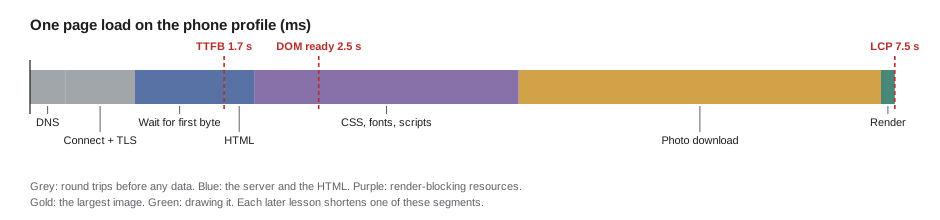
| Step | What happens | Mainly slowed by |
|---|---|---|
| DNS lookup | The browser finds the server's address | Latency; avoided for a cached name |
| Connection and TLS | A secure connection is set up | Round trips; avoided when a connection is reused |
| Request and first byte | The server builds and starts sending the HTML | Server time and latency (time to first byte) |
| HTML download and parse | The browser reads the page and finds other resources | Page size, scripts that block parsing |
| CSS, fonts and scripts | Resources needed before the page can be drawn | Number, size and order of requests |
| First paint | Something appears on the screen | Render-blocking CSS and scripts |
| Main content | The largest text or image appears | Image size, late discovery of the image |
| Usable | The page responds to taps and typing | JavaScript running on the main thread |
Two kinds of cost run through the whole table. The first is latency: the time a message takes to travel to the server and back, called the round-trip time. It is set mostly by distance and by the kind of connection, and no amount of bandwidth reduces it. The second is bandwidth: how many bytes per second the connection can carry once data is flowing. A big photo is limited by bandwidth; a page that needs many small requests, one after another, is limited by latency. On mobile networks latency is often the bigger problem, because each round trip can take a tenth of a second or more.
Mira writes a small model to see the two costs side by side. It is a rough estimate, not a measurement, but it shows how the same page behaves on three connections the studio will use for testing throughout the course.
// A rough model: each step costs round trips (latency) plus bytes (bandwidth).
const profiles = [
  { name: 'office wired', rttMs: 10, kbps: 100000 },
  { name: 'good mobile', rttMs: 70, kbps: 9000 },
  { name: 'weak mobile', rttMs: 300, kbps: 1600 },
];

// Three round trips to connect (DNS, TCP, TLS), then four sequential waves of requests.
const page = { connectTrips: 3, requestWaves: 4, totalKB: 9400 };

function estimate(p) {
  const latencyMs = (page.connectTrips + page.requestWaves) * p.rttMs;
  const transferMs = (page.totalKB * 8) / p.kbps * 1000;
  return { latencyMs, transferMs, totalS: (latencyMs + transferMs) / 1000 };
}

for (const p of profiles) {
  const e = estimate(p);
  console.log(`${p.name.padEnd(12)} latency ${String(e.latencyMs).padStart(5)} ms  transfer ${e.transferMs.toFixed(0).padStart(6)} ms  total ${e.totalS.toFixed(1)} s`);
}office wired latency 70 ms transfer 752 ms total 0.8 s good mobile latency 490 ms transfer 8356 ms total 8.8 s weak mobile latency 2100 ms transfer 47000 ms total 49.1 s
What this code does
Each profile has a round-trip time and a bandwidth, and the estimate adds the time spent waiting for round trips to the time spent moving bytes. On the office connection the 9,400 kB home page costs under a second, but on the weak mobile profile the transfer alone takes about 47 seconds. The model ignores many details, but it shows clearly that this page is limited by its size long before latency matters.
The result explains Lucy's volunteers and Dev's bus ride at once. The home page as it stands sends about 9.4 MB, most of it in photos, so on a weak connection the bytes alone take most of a minute. The fixes in lessons 4 and 5, smaller images and less JavaScript, attack exactly that number. The latency part is smaller here, but it grows quickly as a page adds more waves of requests that wait for each other, which is what lessons 5 and 6 address with preloading, fewer requests and caching.
The first round trips are small
There is one more detail of how connections work that shapes good pages. A new connection does not start at full speed. To avoid flooding the network, the server starts by sending a small amount of data, about ten packets of roughly 1,460 bytes each, and waits for the browser to acknowledge it before sending more. Each round trip after that it can roughly double the amount in flight. This behavior is called slow start, and it means that the first 14 kB or so of a response arrive in the first round trip, the next 28 kB in the second, and so on.
// How many round trips does slow start need to deliver a response?
const SEGMENT = 1460;   // bytes in one TCP segment
const INITIAL = 10;     // segments the server may send at first

function roundTrips(bytes) {
  let window = INITIAL, sent = 0, trips = 0;
  while (sent < bytes) {
    sent += window * SEGMENT;
    window *= 2;
    trips++;
  }
  return trips;
}

for (const kb of [14, 30, 60, 120, 480]) {
  console.log(`${String(kb).padStart(4)} kB -> ${roundTrips(kb * 1000)} round trip(s)`);
}14 kB -> 1 round trip(s) 30 kB -> 2 round trip(s) 60 kB -> 3 round trip(s) 120 kB -> 4 round trip(s) 480 kB -> 6 round trip(s)
What this code does
The loop sends one window of segments per round trip and doubles the window each time, which is a simplified version of what TCP does on a new connection. A response of about 14 kB fits in the first round trip, while 480 kB needs six. Real connections vary, but the pattern explains why the HTML and the CSS needed for the first screen should be small.
This is the reason behind an old piece of advice: keep the HTML and the CSS needed for the first screen small enough that the browser can start drawing after the first round trip or two. Newer protocols change the details. HTTP/2, which Theo's server uses, sends many requests over one connection, and HTTP/3 runs over QUIC, which combines the connection and encryption setup into fewer round trips. But on every protocol the first bytes are the most valuable, so what comes first in the HTML matters.
Lab data and field data
Gareth makes a distinction that runs through the rest of the course. Lab data comes from loading a page in a controlled setting: a chosen device, a chosen network speed, an empty cache. It is repeatable, which makes it good for finding problems and checking fixes. Field data comes from real visitors on their own devices and networks. It is messy and arrives slowly, but it is the truth about what people actually experience.
| Lab data | Field data | |
|---|---|---|
| Comes from | A test run on a chosen device and network | Real visits measured in real browsers |
| Good for | Finding causes, checking a fix before release | Knowing what visitors experience, spotting regressions |
| Weakness | May not match real devices and networks | Slow to collect, needs enough visits, hard to explain |
| Tools in this course | Chrome DevTools, Lighthouse, a Playwright script | The Chrome UX Report, the studio's own measurements |
| Lessons | 2, 4 to 7, 12 | 3, 11, 12 |
The two often disagree, and that is useful. The studio's laptop says the volunteer portal opens in 1.2 seconds. Lucy's volunteers say it takes most of a minute. Both are true; they are measuring different situations. Good performance work uses lab data to understand and fix problems and field data to decide which problems matter and whether the fixes worked.
Mira's first field data comes from somewhere surprising: the volunteer portal itself. Since March, the portal has recorded how long each volunteer waited for the shift list, as part of the error reporting Mira added in JS-220. She has 2,000 of those timings. Gareth shows her why a single average would hide the problem.
// Shift-list wait times in milliseconds (a deterministic sample of 20 from the portal's log).
const waits = [820, 900, 640, 1100, 760, 980, 14200, 870, 690, 1300,
               750, 22000, 910, 880, 1050, 9600, 720, 800, 940, 31000];

const sorted = [...waits].sort((a, b) => a - b);
const mean = waits.reduce((s, x) => s + x, 0) / waits.length;
function percentile(p) {
  const i = Math.ceil((p / 100) * sorted.length) - 1;
  return sorted[Math.max(0, i)];
}

console.log('mean   ', Math.round(mean), 'ms');
console.log('median ', percentile(50), 'ms');
console.log('p75    ', percentile(75), 'ms');
console.log('p95    ', percentile(95), 'ms');
console.log('slowest', sorted.at(-1), 'ms');mean 4546 ms median 900 ms p75 1100 ms p95 22000 ms slowest 31000 ms
What this code does
The sample is sorted once, and percentile() picks the value below which the given share of waits fall, using the nearest-rank method. The median says a typical volunteer waited under a second, but the 95th percentile is 22 seconds, which is the experience of the volunteers at the church hall. The mean of about 4.5 seconds describes nobody, which is why performance work reports percentiles.
The four slow waits in the sample are not random. When Mira looks them up, all four came from the church hall on hamper drive training days. The median says the portal is fine; the slow tail says the portal fails exactly where it is needed most. Lesson 3 explains why Google's Core Web Vitals are judged at the 75th percentile, a compromise that looks past a few unlucky visits but still counts the experience of a large share of real people.
A plan for the course
By the end of the session, Gareth and Mira have turned the three complaints into a plan. Each lesson adds one tool or one fix, and each fix is checked against a measurement before and after.
| Lessons | Topic | What it does for the Food Hub |
|---|---|---|
| 1 to 3 | Why speed matters, measuring, Core Web Vitals | A baseline: what is slow, for whom, and by how much |
| 4 and 5 | Images and assets, code splitting | Smaller photos, fonts and scripts on the public site and the portal |
| 6 and 7 | HTTP caching, rendering | Fast repeat visits, a home page that does not jump or freeze |
| 8 and 9 | Service workers and offline support | The portal and the order board keep working when the Wi-Fi drops |
| 10 | Installable web apps | The portal on the church hall tablets' home screens |
| 11 | Budgets and monitoring | Limits in CI and field measurements, so it stays fast |
| 12 | Capstone | The slow public site made fast, with the numbers before and after |
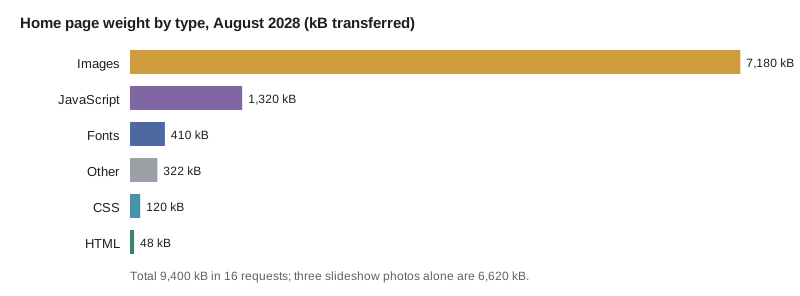
Mira's first job is to find out where the home page's 9.4 MB actually come from. Gareth exports the list of requests from the browser's network panel, which lesson 2 explains in detail, and Mira totals them by type.
// A cut-down export of the home page's requests: [url, type, kB transferred].
const requests = [
  ['/', 'html', 48], ['/css/site.css', 'css', 96], ['/css/slideshow.css', 'css', 24],
  ['/js/slideshow.js', 'js', 310], ['/js/calendar.js', 'js', 420], ['https://pay.giveright.example/widget.js', 'js', 590],
  ['/fonts/merriweather-400.woff2', 'font', 98], ['/fonts/merriweather-700.woff2', 'font', 104],
  ['/fonts/opensans-400.woff2', 'font', 102], ['/fonts/opensans-700.woff2', 'font', 106],
  ['/photos/hero-1.jpg', 'image', 2480], ['/photos/hero-2.jpg', 'image', 2210], ['/photos/hero-3.jpg', 'image', 1930],
  ['/photos/recipe-thumb.jpg', 'image', 560], ['/img/logo.png', 'image', 0], ['/analytics.js', 'other', 322],
];

const byType = new Map();
for (const [, type, kb] of requests) byType.set(type, (byType.get(type) ?? 0) + kb);
const total = [...byType.values()].reduce((a, b) => a + b, 0);
const rows = [...byType].sort((a, b) => b[1] - a[1]);
for (const [type, kb] of rows) console.log(`${type.padEnd(6)} ${String(kb).padStart(5)} kB  share ${(kb / total).toFixed(2)}`);
console.log(`total ${total} kB in ${requests.length} requests`);image 7180 kB share 0.76 js 1320 kB share 0.14 font 410 kB share 0.04 other 322 kB share 0.03 css 120 kB share 0.01 html 48 kB share 0.01 total 9400 kB in 16 requests
What this code does
A Map adds up the kilobytes for each resource type, and the rows are sorted so the biggest type comes first. Images make up about three quarters of the bytes, and three slideshow photos alone are 6,620 kB. The logo shows 0 kB because the browser already had it in its cache, a detail lesson 6 returns to.
The answer is not subtle. Three slideshow photos account for more than two thirds of the page, and only the first is visible when the page opens. JavaScript is the next biggest cost, and lesson 5 explains why a kilobyte of script costs more than a kilobyte of image: it has to be downloaded, parsed, compiled and run on the phone's processor. Fonts are smaller but sit in the way of the text appearing, which lesson 4 addresses.
Worked problem
The cost of one recipe visit
A recipe page sends 4,300 kB, mostly one full-size photo. A volunteer on a weak mobile connection of 1.6 megabits per second opens it. Ignoring latency, how long do the bytes take? If the photo is resized to 180 kB and the rest of the page is 220 kB, how long does it take then?
Show solution
- Convert kilobytes to kilobits: 4,300 kB × 8 = 34,400 kilobits.
- Divide by the bandwidth: 34,400 ÷ 1,600 = 21.5 seconds.
- After resizing, the page is 180 + 220 = 400 kB, or 3,200 kilobits.
- Divide again: 3,200 ÷ 1,600 = 2 seconds.
Answer: The bytes take about 21.5 seconds before the fix and about 2 seconds after it, more than ten times faster for the same recipe.
Common mistakes
MistakeTesting only on the studio's fast laptop and connection.
InsteadTest on a throttled profile and a real mid-range phone, and look at field data from real visitors.
MistakeReporting the average load time.
InsteadReport percentiles such as the median and the 75th or 95th, which show the slow visits an average hides.
MistakeTreating performance as a last step before launch.
InsteadMeasure from the start and check every change, because slow pages are built one addition at a time.
MistakeAssuming more bandwidth fixes everything.
InsteadRemember latency: many small requests that wait for each other are slow on any connection.
MistakeCounting only bytes.
InsteadCount work too: JavaScript must be parsed and run on the visitor's processor, which is often slow on phones.
Summary and key terms
- Performance decides whether a page's content reaches people.
- Delays under about 0.1 s feel instant, about 1 s keeps attention, and over about 10 s loses most visitors.
- Visitors on older phones, slow networks and small data plans are hit hardest by heavy pages.
- A page load costs round trips (latency) and bytes (bandwidth), and slow start makes the first 14 kB or so of a response the fastest to arrive.
- Lab data is repeatable and good for finding causes; field data shows what real visitors experience.
- Percentiles describe performance better than averages.
- The Food Hub home page sends 9.4 MB, mostly in slideshow photos.
- Latency
- The time for a message to travel to the server and back (the round-trip time); set mostly by distance and connection type.
- Bandwidth
- How many bytes per second a connection can carry once data is flowing.
- Slow start
- The way a new TCP connection begins with a small amount of data in flight and roughly doubles it each round trip.
- Lab data
- Performance measured in a controlled test with a chosen device, network and empty cache.
- Field data
- Performance measured in real browsers during real visits; also called real user monitoring data.
- Percentile
- The value below which a given share of measurements fall; the 75th percentile is higher than three quarters of them.
- Page weight
- The total bytes a page transfers, usually broken down by resource type.
Practice problems
Work each problem on paper first, then reveal the answer to check.
Why does a page that loads in one second on the studio's laptop take much longer at the church hall?
Show answer
The hall's devices and Wi-Fi are slower: a phone's processor may be several times slower, and the network adds high latency and low bandwidth to every request.
What does slow start mean for the first response on a new connection?
Show answer
Only about 14 kB arrive in the first round trip, so the HTML and CSS needed for the first screen should be small.
Why are percentiles better than an average for load times?
Show answer
A few very slow visits pull the average to a value that matches nobody, while percentiles show both the typical visit and the slow tail.
Which uses more of a phone's resources per kilobyte, an image or a script?
Show answer
A script, because it must be downloaded, parsed, compiled and run on the main thread, not just decoded and drawn.
Try it yourself
Classify a wait
Complete feel(ms) so that it returns 'instant' for waits under 100 ms, 'noticeable' for 100 ms up to (but not including) 1,000 ms, 'waiting' for 1,000 ms up to (but not including) 10,000 ms, and 'lost' for 10,000 ms or more.
The program prints one line for each wait in the list.
function feel(ms) {
  return 'instant';
}

for (const ms of [40, 100, 850, 1000, 9999, 10000, 31000]) {
  console.log(ms, feel(ms));
}
Try it yourself
The 75th percentile
Complete percentile(values, p) using the nearest-rank method: sort a copy of the values in ascending order, then take the value at position Math.ceil(p / 100 * n) - 1, where n is the number of values.
Do not change the original array.
function percentile(values, p) {
  return values[0];
}

const lcp = [2100, 3400, 1800, 2600, 4100, 2300, 2900, 1900];
console.log(percentile(lcp, 50));
console.log(percentile(lcp, 75));
console.log(percentile(lcp, 100));
console.log(lcp[0]);
Lesson quiz · 5 questions
Score 60% or more to complete this lesson.
Create a free account to save your progress, take quizzes and earn a certificate.