
JS-250 · Lesson 12 of 12 · 25 min
Capstone: speeding up a slow site
▶ Video coming soon A video version of this lesson is on the way.
On Thursday, September 28, Mira puts the whole course together. The task is the one Dev set in August: make the public site fast, and prove it. She has made most of the changes one lesson at a time; today she works through them again as a single, repeatable process, measures the result against the August baseline and prepares the review for Friday, September 29, with Lucy, Dev, Rosa and Paul. The process matters more than any single fix, because it is what the studio will use on the next slow site, and on this one when it slows down again.
A process for a slow site
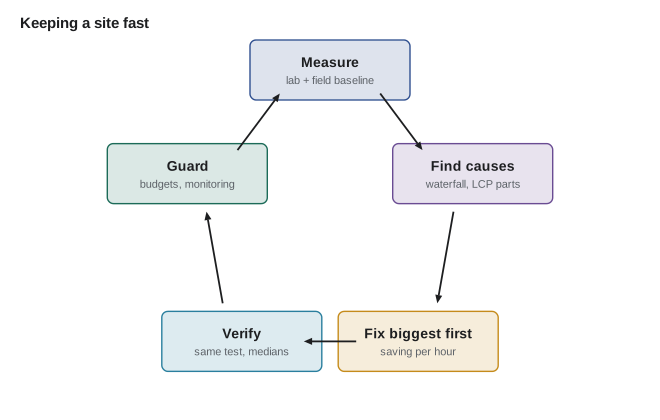
| Step | What Mira did | Lessons |
|---|---|---|
| Measure | A repeatable baseline on two profiles, with field data where it existed | 1 to 3 |
| Find the causes | Waterfalls, LCP parts, long tasks and layout shifts for each page | 2, 3, 7 |
| Fix the biggest first | Images, then render-blocking scripts, then caching, then main-thread work | 4 to 7 |
| Verify | The same measurement after every change, comparing medians | 2, 12 |
| Guard | Budgets in CI, real user monitoring and alerts | 11 |
The order of the fixes is not arbitrary. Gareth's rule is to rank every finding by how much it is expected to save, for how much work, and to start at the top. It is tempting to begin with the most interesting problem, such as the calendar's long task, but on the home page the photos dwarfed everything else, and fixing them first made every later measurement clearer.
// Rank the August findings by expected saving per hour of work.
const findings = [
  { what: 'Resize and re-encode slideshow photos', savesKB: 6400, savesMs: 4800, hours: 3 },
  { what: 'Remove the slideshow script, photo in HTML', savesKB: 310, savesMs: 2200, hours: 2 },
  { what: 'Fix caching headers', savesKB: 2300, savesMs: 1500, hours: 1 },
  { what: 'Load the payment widget only on Donate', savesKB: 590, savesMs: 900, hours: 4 },
  { what: 'Split the calendar into an on-demand module', savesKB: 380, savesMs: 600, hours: 5 },
  { what: 'Fonts: subset, variable font, matched fallback', savesKB: 260, savesMs: 400, hours: 3 },
  { what: 'Replace the analytics script with a smaller one', savesKB: 280, savesMs: 250, hours: 6 },
];

const ranked = findings
  .map((f) => ({ ...f, msPerHour: Math.round(f.savesMs / f.hours) }))
  .sort((a, b) => b.msPerHour - a.msPerHour);
ranked.forEach((f, i) => console.log(`${i + 1}. ${f.what.padEnd(48)} ${String(f.savesMs).padStart(5)} ms in ${f.hours} h  (${f.msPerHour} ms per hour)`));
console.log('total estimated saving on the phone profile:', ranked.reduce((s, f) => s + f.savesMs, 0), 'ms over', ranked.reduce((s, f) => s + f.hours, 0), 'hours');1. Resize and re-encode slideshow photos 4800 ms in 3 h (1600 ms per hour) 2. Fix caching headers 1500 ms in 1 h (1500 ms per hour) 3. Remove the slideshow script, photo in HTML 2200 ms in 2 h (1100 ms per hour) 4. Load the payment widget only on Donate 900 ms in 4 h (225 ms per hour) 5. Fonts: subset, variable font, matched fallback 400 ms in 3 h (133 ms per hour) 6. Split the calendar into an on-demand module 600 ms in 5 h (120 ms per hour) 7. Replace the analytics script with a smaller one 250 ms in 6 h (42 ms per hour) total estimated saving on the phone profile: 10650 ms over 24 hours
What this code does
Each finding has an estimated saving in milliseconds of LCP on the phone profile and an estimate of the hours it will take, and the list is sorted by saving per hour. The photos and the caching headers come out on top, while replacing the analytics script, though worthwhile, is last because it saves little for a lot of work. The estimates overlap, so the total is only a rough upper bound, which is why each fix is measured after it is made.
The core fixes in one test
To show the effect of the main fixes in a single, honest measurement, Mira builds a test that serves two versions of the top of the home page on the same simulated phone connection as lesson 2. The before version reproduces the August page: a blocking slideshow script that does some work and then inserts Dev's original photo, with no dimensions. The after version is the new page: the 800-pixel photo in the HTML with its width, height and a high fetch priority, and no blocking script. The test reads LCP, layout shifts and long tasks from the browser itself.
// capstone.cjs: measure the old and new home page tops on a simulated weak connection.
const http = require('node:http');
const fs = require('node:fs');
const { chromium } = require('playwright');

const RTT_MS = 300, BYTES_PER_S = 200_000;
const big = fs.readFileSync('IMG_2041.jpg');      // Dev's original photo
const small = fs.readFileSync('hero-800.jpg');    // the build's 800-pixel version

// The rest of the page's top: news items that the late photo pushes down.
const news = '<h2>News</h2>' + ['Hamper drive volunteers needed', 'New cooking class times', 'Youth garden harvest'].map((t) => `<h3>${t}</h3><p>Read more about ${t.toLowerCase()} on the news page.</p>`).join('');

const pages = {
  // Before: a blocking script inserts the photo late, the photo is full size and has no dimensions,
  // and a long task runs while the page loads.
  '/before': `<!doctype html><html lang="en"><head><meta charset="utf-8"><title>Before</title>
    <style>body{font-family:sans-serif;margin:0} img{width:100%;display:block}</style>
    <script src="/slideshow.js"></script></head>
    <body><h1>Riverside Community Food Hub</h1><div id="show"></div>
    <p>The grocery program is open Tuesday and Thursday from 10 to 4.</p>${news}</body></html>`,
  // After: the photo is in the HTML, resized, with dimensions and a high fetch priority; no blocking script.
  '/after': `<!doctype html><html lang="en"><head><meta charset="utf-8"><title>After</title>
    <style>body{font-family:sans-serif;margin:0} img{width:100%;height:auto;display:block}</style></head>
    <body><h1>Riverside Community Food Hub</h1>
    <img src="/hero-800.jpg" width="800" height="600" alt="Volunteers packing hampers" fetchpriority="high">
    <p>The grocery program is open Tuesday and Thursday from 10 to 4.</p>${news}</body></html>`,
};
const slideshow = `document.addEventListener('DOMContentLoaded', () => {
  const t = performance.now(); while (performance.now() - t < 400) {}   // stands in for the old script's work
  const img = new Image(); img.src = '/IMG_2041.jpg'; img.alt = 'Volunteers packing hampers';
  document.getElementById('show').append(img);
});`;

function sendSlowly(res, body) {
  let i = 0;
  const step = 10_000;
  const timer = setInterval(() => {
    res.write(body.subarray(i, i + step));
    i += step;
    if (i >= body.length) { clearInterval(timer); res.end(); }
  }, (step / BYTES_PER_S) * 1000);
}

const server = http.createServer((req, res) => {
  setTimeout(() => {
    if (req.url === '/IMG_2041.jpg' || req.url === '/hero-800.jpg') {
      const body = req.url === '/IMG_2041.jpg' ? big : small;
      res.writeHead(200, { 'content-type': 'image/jpeg', 'content-length': body.length });
      sendSlowly(res, body);
    } else if (req.url === '/slideshow.js') {
      res.writeHead(200, { 'content-type': 'text/javascript' }); res.end(slideshow);
    } else {
      res.writeHead(200, { 'content-type': 'text/html' }); res.end(pages[req.url]);
    }
  }, RTT_MS);
});

async function measure(browser, path) {
  const tab = await browser.newPage({ viewport: { width: 412, height: 823 }, deviceScaleFactor: 2 });
  await tab.addInitScript(() => {
    window.__cls = 0; window.__long = 0;
    new PerformanceObserver((l) => { for (const e of l.getEntries()) if (!e.hadRecentInput) window.__cls += e.value; }).observe({ type: 'layout-shift', buffered: true });
    new PerformanceObserver((l) => { for (const e of l.getEntries()) window.__long += Math.max(0, e.duration - 50); }).observe({ type: 'longtask', buffered: true });
  });
  await tab.goto(`http://127.0.0.1:${server.address().port}${path}`, { waitUntil: 'load' });
  await tab.waitForTimeout(1000);
  const r = await tab.evaluate(() => new Promise((resolve) => {
    new PerformanceObserver((list) => resolve({ lcp: list.getEntries().at(-1).startTime, cls: window.__cls, blocking: window.__long }))
      .observe({ type: 'largest-contentful-paint', buffered: true });
  }));
  await tab.close();
  return r;
}

server.listen(0, async () => {
  const browser = await chromium.launch();
  for (const path of ['/before', '/after']) {
    const r = await measure(browser, path);
    console.log(`${path.padEnd(8)} LCP ${(r.lcp / 1000).toFixed(1).padStart(5)} s   CLS ${r.cls.toFixed(2)}   blocking ${String(Math.round(r.blocking / 50) * 50).padStart(3)} ms`);
  }
  await browser.close();
  server.close();
});
What this code does
The test server imitates a slow phone connection by waiting 300 ms before each response and trickling bodies out at about 1.6 megabits per second, and the before page's script stands in for the old slideshow by blocking the main thread for 400 ms before inserting the photo. An init script registered before the page loads collects every layout shift and long task as they happen, and LCP is read from the buffered entries after the page has settled. Both pages are measured in the same browser, one after the other, on the same phone-sized window.
$ node capstone.cjs
/before  LCP  15.9 s   CLS 0.21   blocking 350 ms
/after   LCP   0.8 s   CLS 0.00   blocking   0 ms
What this code does
Both runs are real measurements in Chromium on the simulated connection. The old page's main content appears after about sixteen seconds, it shifts by more than the 0.1 good threshold when the photo arrives without reserved space, and it blocks the main thread; the new page shows its photo in under a second, does not shift and has no long tasks. The numbers come from a local test page, not the live site, but the changes being tested are exactly the ones made to the live site.
Results on the real pages
Mira then repeats the lesson 2 baseline on the real pages, with the same profiles and five runs each. The table compares the medians on the phone profile in August with those on September 28.
| Page | Measure | August 24 | September 28 |
|---|---|---|---|
| Home page | Bytes on first visit | 9,400 kB | 312 kB |
| Home page | Requests | 16 | 9 |
| Home page | LCP | 7.5 s | 2.1 s |
| Home page | Total Blocking Time | 851 ms | 60 ms |
| Home page | CLS | 0.31 | 0.02 |
| Home page | Bytes on a repeat visit | 9,400 kB | 4 kB |
| Recipe page | LCP | 6.4 s | 1.9 s |
| Portal shift list | JavaScript (gzip) | 412 kB | 118 kB |
| Portal shift list | LCP | 5.2 s | 1.8 s |
| Portal shift list | Day tap, slowest interaction | 1,180 ms | 15 ms to first change |
// Summarize the improvements and check them against the lab budgets.
const results = [
  ['home LCP (ms)', 7520, 2100, 2500],
  ['home TBT (ms)', 851, 60, 200],
  ['home CLS', 0.31, 0.02, 0.1],
  ['home bytes (kB)', 9400, 312, 400],
  ['recipe LCP (ms)', 6400, 1900, 2500],
  ['portal JS (kB gzip)', 412, 118, 120],
  ['portal LCP (ms)', 5200, 1800, 2500],
];

for (const [name, before, after, budget] of results) {
  const times = before / after;
  const status = after <= budget ? 'within budget' : 'OVER budget';
  console.log(`${name.padEnd(20)} ${String(before).padStart(5)} -> ${String(after).padStart(4)}  ${times.toFixed(1).padStart(5)} times better  ${status} (${budget})`);
}
const passing = results.filter(([, , after, budget]) => after <= budget).length;
console.log(`${passing} of ${results.length} lab budgets met`);home LCP (ms) 7520 -> 2100 3.6 times better within budget (2500) home TBT (ms) 851 -> 60 14.2 times better within budget (200) home CLS 0.31 -> 0.02 15.5 times better within budget (0.1) home bytes (kB) 9400 -> 312 30.1 times better within budget (400) recipe LCP (ms) 6400 -> 1900 3.4 times better within budget (2500) portal JS (kB gzip) 412 -> 118 3.5 times better within budget (120) portal LCP (ms) 5200 -> 1800 2.9 times better within budget (2500) 7 of 7 lab budgets met
What this code does
For each measure, the ratio of the old value to the new one gives how many times better it is, which is easier for the review to grasp than raw differences. Each new value is also compared with its lab budget from lesson 11. Every budget is met, although the portal's JavaScript is only 2 kB under its 120 kB limit, which tells Mira where the next regression is most likely to appear.
The home page's LCP at 2.1 s is now inside the good threshold even on the deliberately pessimistic phone profile. Its LCP parts tell the story of the course in four numbers.
// The home page's LCP parts on the phone profile, before and after (ms).
const parts = ['time to first byte', 'resource load delay', 'resource load duration', 'element render delay'];
const before = [1688, 2562, 3150, 120];
const after = [940, 310, 760, 90];

parts.forEach((p, i) => {
  const saved = before[i] - after[i];
  console.log(`${p.padEnd(24)} ${String(before[i]).padStart(5)} -> ${String(after[i]).padStart(4)}  saved ${String(saved).padStart(4)} ms`);
});
const total = (a) => a.reduce((s, x) => s + x, 0);
console.log(`${'LCP'.padEnd(24)} ${String(total(before)).padStart(5)} -> ${String(total(after)).padStart(4)} saved ${total(before) - total(after)} ms`);time to first byte 1688 -> 940 saved 748 ms resource load delay 2562 -> 310 saved 2252 ms resource load duration 3150 -> 760 saved 2390 ms element render delay 120 -> 90 saved 30 ms LCP 7520 -> 2100 saved 5420 ms
What this code does
Each part's saving is its old value minus its new one, and the four parts add up to the whole LCP before and after. The biggest saving is in the resource load duration, from resizing the photo, closely followed by the resource load delay, from putting it in the HTML with a high priority. Time to first byte fell too, because Theo added a server-side cache for the home page's database query and turned on HTTP/3, which shortens the connection setup.
Reliability results
The second half of the course is harder to put in a table, so Mira tests it as a script of events at the church hall, run with the tablets in the studio and the Wi-Fi switched off and on at set times.
| Test | Result |
|---|---|
| Open the installed portal with Wi-Fi off | Check-in screen in 0.6 s from the cache, status line says Offline with the time of the saved shift list |
| Check in 12 volunteers with Wi-Fi off | All 12 queued; the icon badge shows 12 |
| Switch Wi-Fi on | All 12 sent within 9 s; server shows 12 check-ins with their original times |
| Drop the connection while sending | Two responses lost; both retried with the same keys; server still shows 12, not 14 |
| Check in a volunteer for a closed shift while offline | Queued, then refused by the server with 409; shown in Lucy's list |
| Order board with kitchen Wi-Fi off for 5 minutes | Last state shown, grayed, with "Offline since 10:42"; caught up from Last-Event-ID within 2 s of reconnecting |
| Deploy a new portal version during a session | Update banner shown; reload moves both tablets to the new worker |
Every result matches what the design in lessons 8 to 10 promised. The one Mira is proudest of is the dropped connection: two check-ins that the server had recorded but whose responses never arrived were sent again, and the server recognized their keys and recorded nothing new. That is exactly the failure that would otherwise have put volunteers in Lucy's records twice.
The review
At the review on Friday, September 29, Mira shows the before and after numbers, plays the two filmstrips side by side, and runs the offline test with the Wi-Fi switch in her hand. The decisions are quick.
- Dev will upload photos through the news editor, which now resizes and re-encodes them automatically, instead of placing files by hand. He agrees to a size check in the editor that warns about anything over 300 kB.
- Lucy will use the installed portal on both church hall tablets for the hamper drive training day on Saturday, October 14, and for the hamper drive itself in December, both plans.
- Rosa keeps the order board as it is, now that it survives outages, and asks for the badge count of waiting orders on the kitchen tablet too, which Mira adds to the list for later.
- Paul asks how the studio will know if the site gets slow again. Mira shows the dashboard and the budget check failing on a test pull request, and he asks for the dashboard link to go in the monthly board report.
The last item on the agenda is field data. Lab results are promising, but the real test is what visitors experience. The studio's own monitoring will have four weeks of reports by late October, and the Chrome UX Report's monthly dataset for the home page will cover a full month of the new site in its November release. Mira puts both dates in the studio's calendar as plans, with the Core Web Vitals assessment for the home page on phones as the measure of success.
Worked problem
How many times faster for a volunteer
In August, a volunteer at the church hall opened the portal on a tablet on the hall's weak Wi-Fi. The first visit transferred 1,180 kB and repeat visits transferred the same. After the course, the first visit transfers 340 kB and later visits are served from the service worker's cache, sending only a 2 kB shift list request. At 1.6 megabits per second, ignoring latency, how long do the bytes take in each case?
Show solution
- August, every visit: 1,180 × 8 = 9,440 kilobits; 9,440 ÷ 1,600 = 5.9 s.
- After, first visit: 340 × 8 = 2,720 kilobits; 2,720 ÷ 1,600 = 1.7 s.
- After, later visits: 2 × 8 = 16 kilobits; 16 ÷ 1,600 = 0.01 s.
- Later visits are about 5.9 ÷ 0.01 = 590 times faster in transfer time, and they work with no network at all.
Answer: About 5.9 s before, 1.7 s for the first visit after and about 0.01 s for later visits, which also work offline.
Common mistakes
MistakeStarting with the most interesting problem.
InsteadRank findings by expected saving per hour and start at the top.
MistakeMaking several changes and measuring once.
InsteadMeasure after each change, so you know which fixes helped and by how much.
MistakeDeclaring success from lab data alone.
InsteadConfirm with field data over several weeks, and keep monitoring.
MistakeLeaving the gains unprotected.
InsteadAdd budgets to CI and alerts to monitoring before moving on.
MistakeTesting offline features only by switching off the network once.
InsteadScript realistic failures: lost responses, flapping connections, refusals and updates mid-session.
Summary and key terms
- A slow site is fixed with a repeatable process: measure, find the causes, fix the biggest first, verify with the same measurement and guard the result with budgets and monitoring.
- Ranking findings by expected saving per hour puts the photos and caching first on the Food Hub home page.
- A real before-and-after test on a simulated phone connection shows the core fixes moving LCP from about sixteen seconds to under one, removing layout shift and long tasks.
- On the real pages, the home page's LCP fell from 7.5 s to 2.1 s, its bytes from 9.4 MB to 312 kB and its CLS from 0.31 to 0.02, and the portal's first-screen JavaScript fell from 412 kB to 118 kB.
- Offline tests show check-ins queued, sent once and never duplicated, and the board surviving outages.
- Field data over the following weeks is the final measure.
- Baseline
- A set of measurements taken before changes, used to judge every later result.
- Filmstrip
- A series of screenshots of a page loading, used to compare versions visually.
- Median of runs
- The middle result of several repeated tests, used because single runs vary.
- Saving per hour
- An estimate of a fix's benefit divided by the work it needs, used to order fixes.
- Verification
- Measuring again in the same way after a change to confirm its effect.
Practice problems
Work each problem on paper first, then reveal the answer to check.
Why does Mira rank findings by saving per hour rather than by saving alone?
Show answer
A large saving that takes days may be worth less than several quick fixes with good savings, so per hour shows where time is best spent.
Why does the capstone test serve both page versions from a local server on the same simulated connection?
Show answer
So the only difference between the two runs is the page itself, which makes the comparison fair and repeatable.
Which LCP part improved most on the home page, and why?
Show answer
The resource load duration, because the photo was resized from megabytes to tens of kilobytes; the resource load delay came a close second.
Why is the review's measure of success the field data, not the lab table?
Show answer
Field data shows what real visitors on their own devices and networks experience.
Try it yourself
Rank the fixes
Complete rank(findings) so that it returns the names of the findings sorted by savesMs / hours, highest first. When two findings have the same value, keep their original order.
Do not change the original array.
function rank(findings) {
  return findings.map((f) => f.name);
}

const findings = [
  { name: 'fonts', savesMs: 400, hours: 4 },
  { name: 'photos', savesMs: 4800, hours: 3 },
  { name: 'caching', savesMs: 1500, hours: 1 },
  { name: 'analytics', savesMs: 300, hours: 3 },
  { name: 'payment widget', savesMs: 900, hours: 4 },
];
console.log(rank(findings).join(', '));
console.log(findings[0].name);
Try it yourself
Before and after
Complete compare(name, before, after) so that it returns a line such as home LCP: 7400 -> 2100 (3.5 times better), using toFixed(1) for the ratio before / after.
If after is greater than before, return home LCP: 2100 -> 2400 (worse) instead.
function compare(name, before, after) {
  return `${name}: ${before} -> ${after}`;
}

console.log(compare('home LCP', 7400, 2100));
console.log(compare('portal JS', 412, 118));
console.log(compare('recipe CLS', 0.18, 0.02));
console.log(compare('home LCP', 2100, 2400));
Lesson quiz · 5 questions
Score 60% or more to complete this lesson.
Create a free account to save your progress, take quizzes and earn a certificate.