
HSE-311 · Lesson 12 of 12 · 27 min
Process safety culture, leadership and metrics, and capstone: a process hazard analysis and safeguard review for a small chemical unit
Every major accident investigation in this course has found technical failures, but behind them lie organizational ones: warnings that were not acted on, budgets that cut maintenance and staff, procedures that drifted from practice, and leaders who measured the wrong things. This final lesson looks at process safety culture and leadership, how to tell whether a process safety program is really working, and how to bring the methods of the course together. It ends with a capstone exercise: a process hazard analysis and safeguard review for a small solvent recovery unit.
What process safety culture means
Process safety culture is the combination of shared values, beliefs and behaviors that determine how an organization treats major accident hazards. A strong culture does not depend on a single champion. It shows up in everyday choices: whether a supervisor stops a startup when a trip is not working, whether an engineer's recommendation to replace corroded piping is funded, and whether a near miss is reported and investigated or quietly forgotten. CCPS describes a set of core principles for a good process safety culture, including establishing process safety as a core value, providing strong leadership, maintaining a sense of vulnerability, empowering people to fulfill their responsibilities, deferring to expertise, ensuring open and effective communication, establishing a questioning and learning environment, fostering mutual trust and responding to concerns in a timely way.
| Sign of a weak culture | Example |
|---|---|
| Normalization of deviance | Leaks during startup are seen as normal, as at Tesoro Anacortes |
| Focus on personal injury rates as the measure of safety | Texas City had low injury rates shortly before the 2005 explosion |
| Production pressure overriding safety decisions | Starting up with a known safeguard out of service to meet a deadline |
| Recommendations left open for years | Chevron Richmond inspection recommendations not acted on |
| Cuts to maintenance, staffing or expertise without review | Reduced crews and training budgets before Texas City |
| Bad news not reaching senior leaders | Concerns raised by staff are filtered out as they move up the organization |
The term normalization of deviance was coined by sociologist Diane Vaughan in her study of the 1986 Challenger space shuttle disaster. It describes how a small departure from the expected standard, once it does not cause harm, gradually becomes the new normal, until the margin of safety has been eroded without anyone deciding to accept the risk. Process plants are vulnerable to it because most deviations, such as a bypassed alarm or a leaking flange, do not lead to an accident immediately.
Leadership
After Texas City, an independent panel led by former US Secretary of State James Baker reviewed process safety at BP's US refineries. Its 2007 report found that BP had emphasized personal safety and had not established a positive, trusting and open process safety culture, and it called for leadership from the board and executive levels down. The lesson applies to any organization handling hazardous materials. Leaders set the culture by what they ask about, what they fund, what they reward and how they respond to bad news.
| Leadership behavior | What it looks like in practice |
|---|---|
| Asking about process safety, not only injuries | Reviewing overdue inspections, bypasses and open recommendations at every management meeting |
| Funding integrity and expertise | Approving replacement of corroded piping and keeping experienced engineers |
| Visible field presence | Walking the unit, asking operators about their concerns |
| Supporting stop-work decisions | Thanking the operator who delayed a startup, even when it cost production |
| Responding to concerns promptly | Closing the loop with the person who raised an issue |
| Learning from others | Reviewing external incidents such as CSB reports and asking could it happen here |
Measuring process safety performance
Lesson 1 introduced lagging indicators, such as Tier 1 and Tier 2 process safety events under API RP 754, and leading indicators, such as Tier 3 challenges to safety systems and Tier 4 measures of operating discipline and management system performance. A good dashboard uses a small number of indicators chosen for the site's major hazards, tracks them over time, and triggers action when they move the wrong way. Each indicator should be linked to a barrier from the site's bow-ties (Lesson 7) so that a change in the indicator says something about the health of a specific safeguard.
| Barrier or system | Leading indicator example |
|---|---|
| Safety instrumented systems | Percentage of SIF proof tests completed on time; number of demands on SIFs |
| Bypass management | Number of active bypasses and total bypass hours |
| Mechanical integrity | Percentage of inspections overdue; deficiencies past due date |
| Management of change | Temporary changes past expiry; MOCs open past close-out date |
| Alarm management | Average alarm rate per console; percentage of time in flood |
| Learning | Near misses reported per month; investigation actions overdue |
# A simple process safety dashboard with red/amber/green status (seeded data).
import random
random.seed(311)
indicators = {
    # name: (value, target, amber limit, higher_is_better)
    "SIF proof tests on time (%)":       (random.randint(85, 100), 100, 95, True),
    "Inspections overdue (%)":           (round(random.uniform(0, 8), 1), 0, 2, False),
    "Active bypasses":                   (random.randint(0, 6), 0, 2, False),
    "Temporary MOCs past expiry":        (random.randint(0, 5), 0, 1, False),
    "Alarm rate (per operator hour)":    (round(random.uniform(4, 14), 1), 6, 12, False),
    "Near misses reported this month":   (random.randint(2, 20), 10, 5, True),
}
for name, (v, target, amber, hib) in indicators.items():
    if hib:
        status = "GREEN" if v >= target else ("AMBER" if v >= amber else "RED")
    else:
        status = "GREEN" if v <= target else ("AMBER" if v <= amber else "RED")
print(f"{name:<34} {v:>6} target {target:>4} {status}")SIF proof tests on time (%) 93 target 100 RED Inspections overdue (%) 2.1 target 0 RED Active bypasses 0 target 0 GREEN Temporary MOCs past expiry 3 target 0 RED Alarm rate (per operator hour) 8.7 target 6 AMBER Near misses reported this month 6 target 10 AMBER
A dashboard like this is only useful if someone acts on it. Each red or amber result should have an owner and an action, and leaders should ask about the trend, not only the current value. A rising number of near miss reports can be a good sign: it often means people trust that reporting leads to learning rather than blame.
Societal risk and F–N curves
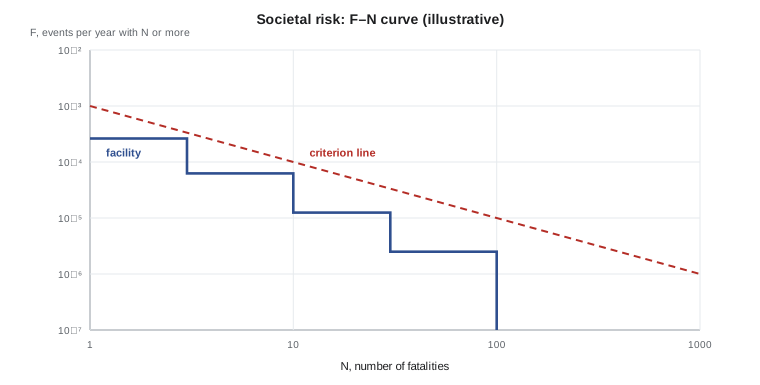
Lesson 7 introduced individual risk. For facilities that could harm many people at once, such as a plant near a residential area, companies and regulators also look at societal risk. An F–N curve plots the cumulative frequency F of events causing N or more fatalities against N on log scales. A criterion line, which slopes downward, shows that larger events must be less frequent to be tolerable. Curves above the line need risk reduction.
# Build F-N points from a list of scenarios (frequency per year, fatalities), illustrative.
scenarios = [(2e-4, 1), (5e-5, 3), (1e-5, 10), (2e-6, 30), (5e-7, 100)]
Ns = sorted({n for _, n in scenarios})
print(" N   F(N or more) /yr   criterion /yr   status")
for N in Ns:
    F = sum(f for f, n in scenarios if n >= N)
    criterion = 1e-3 / N        # illustrative criterion line with slope -1
    status = "above line" if F > criterion else "below line"
print(f"{N:>3} {F:.2e} {criterion:.1e} {status}")N F(N or more) /yr criterion /yr status 1 2.63e-04 1.0e-03 below line 3 6.25e-05 3.3e-04 below line 10 1.25e-05 1.0e-04 below line 30 2.50e-06 3.3e-05 below line 100 5.00e-07 1.0e-05 below line
Capstone: process hazard analysis and safeguard review for a small solvent recovery unit
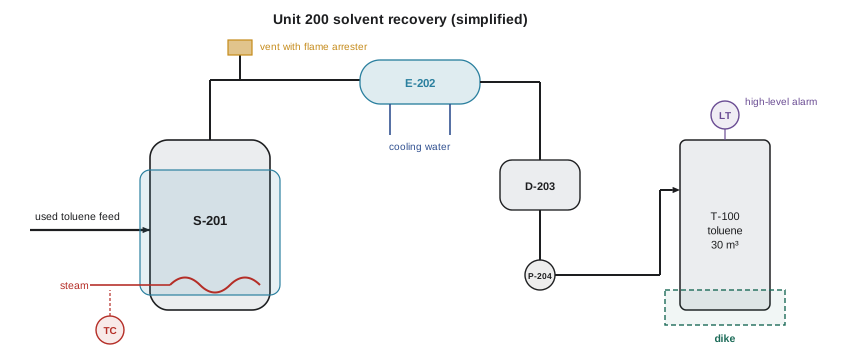
The capstone brings together the methods of the course. Larchmont Specialty Chemicals plans to add a small solvent recovery unit, Unit 200, to recover toluene from used solvent. Used toluene, containing about 10 percent water and dissolved residues, is fed to a 4 m³ steam-heated still, S-201. Vapor passes to a water-cooled condenser, E-202, and the condensed toluene drains to a receiver, then is pumped to the existing 30 m³ storage tank T-100. The still operates near atmospheric pressure with a vent to a flame arrester. Steam to the still reboiler is controlled by a temperature controller. T-100 has a level transmitter and a high-level alarm, and is in a dike.
Step 1: Process safety information and hazards
The team first collects process safety information: material hazards (toluene is flammable with a flash point near 4 °C and a lower flammable limit of about 1.1 percent; Lesson 3), design pressures of the still and receiver, relief device design basis, P&IDs and the operating limits. It then lists the main hazards: fire or explosion from a toluene release, overpressure of the still, overfill of T-100, toxic exposure to toluene vapor, and the hazard of unknown residues in the used solvent, which might include reactive or peroxide-forming impurities.
Step 2: Hazard identification
The team uses a HAZOP on three nodes: the still and reboiler, the condenser and receiver, and the transfer to T-100. Selected deviations and their causes, consequences and existing safeguards are shown below.
| Node | Deviation | Cause | Consequence | Existing safeguards |
|---|---|---|---|---|
| Condenser | No cooling water flow | Cooling water pump trip or valve closed | Toluene vapor vents through the flame arrester; potential flash fire or overpressure if the vent is restricted | Vent with flame arrester; operator rounds |
| Still | More heat | Temperature controller fails with steam valve open | Boil-up exceeds condenser capacity; vapor release | Temperature alarm from the same transmitter |
| Transfer | More level in T-100 | Level transmitter fails or operator does not stop transfer | Overfill and toluene spill into the dike; vapor cloud possible | High-level alarm from the same transmitter; dike |
| Still | Other than (composition) | Peroxides or reactive residue in feed | Decomposition on concentration in still bottoms | None identified |
Step 3: LOPA of the key scenarios
Two scenarios are taken to LOPA: loss of condenser cooling leading to a toluene vapor release and fire with a possible fatality, and overfill of T-100 leading to a spill, vapor cloud and possible fatality. The target for a single-fatality scenario is 1 × 10⁻⁵ per year. The HAZOP listed several safeguards, but the team must check which are valid IPLs.
# LOPA for two Unit 200 scenarios, before and after proposed safeguards.
target = 1e-5
scenarios = {
    "Loss of condenser cooling": {
        "ie": 0.1,                               # cooling water pump trip, per year
        "existing": {},                          # vent arrester does not prevent release; rounds not an IPL
        "conditional": 0.5 * 0.1,                # ignition x occupancy/fatality
        "proposed": {"SIL 1 trip: low CW flow closes steam": 0.1,
                     "operator response to independent high vent temperature alarm": 0.1},
    },
    "Overfill of T-100": {
        "ie": 0.1,                               # level transmitter failure or missed stop
        "existing": {"dike (limits spread)": 0.01},
        "conditional": 0.3 * 0.1,
        "proposed": {"independent high-high level switch trips P-204 (SIL 1)": 0.1},
    },
}
for name, s in scenarios.items():
    f = s["ie"] * s["conditional"]
    for p in s["existing"].values():
        f *= p
    print(f"{name}: existing {f:.1e} /yr ->", "meets" if f <= target else f"gap x{f / target:.0f}")
    for label_, p in s["proposed"].items():
        f *= p
print(f" with proposed safeguards {f:.1e} /yr ->", "meets" if f <= target else f"gap x{f / target:.0f}")Loss of condenser cooling: existing 5.0e-03 /yr -> gap x500 with proposed safeguards 5.0e-05 /yr -> gap x5 Overfill of T-100: existing 3.0e-05 /yr -> gap x3 with proposed safeguards 3.0e-06 /yr -> meets
The analysis shows that the condenser scenario has a gap of a factor of 500 with existing safeguards, because the flame arrester does not stop the release and operator rounds are not an IPL. A SIL 1 trip that shuts off steam on low cooling water flow, plus an independent high vent temperature alarm with operator response, closes the gap to a factor of 5, so a further measure is still needed: the team proposes a SIL 2 design for the trip, giving a further factor of ten, or an inherently safer change to limit steam supply to below the condenser's capacity. The T-100 overfill scenario meets the target once an independent high-high level switch is added; it does not depend on the existing level transmitter that might have caused the overfill, the Buncefield lesson from Lesson 2.
Step 4: Recommendations and the management system
A PHA is only as good as what happens afterwards. The team's recommendations are assigned owners and dates and linked to the management system elements covered in the course.
| Recommendation | Owner | Linked element |
|---|---|---|
| Add a SIL 2 trip closing steam on low cooling water flow, or limit maximum steam supply below condenser capacity | Process engineering | Safeguards and SIS (Lesson 8) |
| Add an independent high-high level switch on T-100 that trips P-204 | Instrument engineering | Safeguards and SIS (Lesson 8) |
| Test each used solvent batch for peroxides and reactive residues before feeding; set a limit on bottoms concentration | Laboratory and operations | Hazards of materials (Lesson 3); procedures (Lesson 11) |
| Confirm the vent and flame arrester are sized for the maximum boil-up rate | Process engineering | Relief and vent design (Lesson 8) |
| Write startup, shutdown and emergency procedures with safe operating limits | Operations | Procedures (Lesson 11) |
| Add new equipment to the inspection and proof test programs | Maintenance and inspection | Mechanical integrity (Lesson 10) |
| Run the project through MOC and carry out a PSSR before startup | Project manager | MOC and PSSR (Lesson 9) |
| Add Unit 200 bypasses, proof tests and alarm rates to the site dashboard | Site process safety lead | Metrics (this lesson) |
Worked problem
Reviewing the capstone
A project manager suggests crediting the existing T-100 high-level alarm as an IPL to avoid buying a new level switch. The alarm uses the same transmitter as the level control. Should the team accept this?
Show solution
- Check independence: the alarm uses the same transmitter whose failure is one of the initiating causes.
- If the transmitter fails reading low, both the control and the alarm fail together, so the alarm provides no protection for that cause.
- The alarm therefore cannot be credited as an IPL for this scenario.
- Explain the decision with reference to Buncefield, where a stuck level gauge defeated both the control and the alarm.
Answer: No. The alarm is not independent of the initiating cause and cannot be credited; an independent high-high level switch is needed.
Common mistakes
MistakeJudging process safety by injury rates.
InsteadUse process safety indicators tied to barriers and major hazards.
MistakeAccepting repeated small deviations because nothing happened.
InsteadRecognize normalization of deviance and restore the standard.
MistakeTreating a near miss increase as bad news.
InsteadRead it as a sign of reporting trust, and act on what is reported.
MistakeEnding a PHA when the report is issued.
InsteadAssign owners and dates and link recommendations to the management system.
MistakeCrediting alarms that share a transmitter with the control loop.
InsteadCredit only independent protection layers.
Summary and key terms
- Process safety culture is shown in everyday decisions about warnings, budgets, recommendations and reporting.
- Normalization of deviance erodes safety margins gradually and is common in process plants.
- Leaders set culture by what they ask about, fund, reward and how they respond to bad news.
- Leading indicators should be tied to specific barriers and lead to action.
- F–N curves show societal risk for facilities that could harm many people.
- A full PHA and safeguard review combines process safety information, HAZOP, LOPA, recommendations and links to MOC, MI, procedures and metrics.
- Process safety culture
- Shared values and behaviors that determine how an organization treats major hazards.
- Normalization of deviance
- Gradual acceptance of departures from standards because nothing bad has happened yet.
- Sense of vulnerability
- Ongoing awareness that a major accident could happen here.
- Deference to expertise
- Letting the most knowledgeable person guide decisions, whatever their rank.
- Leading indicator
- A measure of barrier health or system performance before harm occurs.
- Societal risk
- The relationship between the frequency of events and the number of people harmed.
- F–N curve
- A plot of cumulative frequency against number of fatalities.
- Just culture
- An approach that learns from honest errors while not tolerating reckless behavior.
Practice problems
Work each problem on paper first, then reveal the answer to check.
Give three warning signs of a weak process safety culture.
Show answer
Normalization of deviance, reliance on injury rates, overdue recommendations (also production pressure, cuts without review).
Who coined the term normalization of deviance, and from what study?
Show answer
Diane Vaughan, from her study of the Challenger disaster.
What did the Baker Panel find about BP's safety focus?
Show answer
It emphasized personal safety and lacked a positive, open process safety culture.
Name two leadership behaviors that build process safety culture.
Show answer
Asking about process safety indicators and funding integrity work (also field presence, supporting stop-work).
Why link each leading indicator to a barrier?
Show answer
So the indicator tells you about the health of a specific safeguard.
What does an F–N curve plot?
Show answer
Cumulative frequency of N or more fatalities against N.
In the capstone, why is operator rounds not credited as an IPL?
Show answer
It is not specific, timely, dependable or auditable for the scenario.
Why is the T-100 high-level alarm not an IPL for overfill?
Show answer
It shares the transmitter whose failure is the initiating cause.
What two options close the remaining gap for loss of condenser cooling?
Show answer
A SIL 2 trip or limiting steam supply below condenser capacity.
Which management system steps must the Unit 200 project go through before startup?
Show answer
MOC and a pre-startup safety review.
Lesson quiz · 5 questions
Score 60% or more to complete this lesson.
Create a free account to save your progress, take quizzes and earn a certificate.