
HSE-243 · Lesson 4 of 12 · 29 min
Measuring heat stress
Air temperature alone tells you little about heat stress. A worker in dry shade at 33 °C may be comfortable, while another at 30 °C in full sun, high humidity and no breeze may be heading for heat exhaustion. To judge heat stress properly, you need to account for four environmental factors, plus the work rate and the clothing. This lesson explains the main indices used to do that, how to measure them and what each is good for.
The four environmental factors
Lesson 2 showed that the body exchanges heat by convection, radiation and evaporation. The environment affects each of these through four measurable factors. Air temperature, measured with an ordinary shaded thermometer and called the dry bulb temperature, drives convection. Humidity, the amount of water vapor in the air, controls how fast sweat can evaporate. Radiant heat, from the sun or hot surfaces, is measured with a black globe thermometer. Air speed affects both convection and evaporation. Any good heat stress index must capture all four, either by measuring them or by assuming typical values.
Humidity is usually reported as relative humidity, the percentage of the maximum water vapor the air could hold at that temperature. Because warm air can hold much more water than cool air, the same relative humidity means much more moisture, and much less evaporation, on a hot day. The dew point, the temperature at which the air would become saturated, is a more direct measure of moisture: dew points above about 20 °C feel muggy, and above 24 °C oppressive.
Wet bulb globe temperature
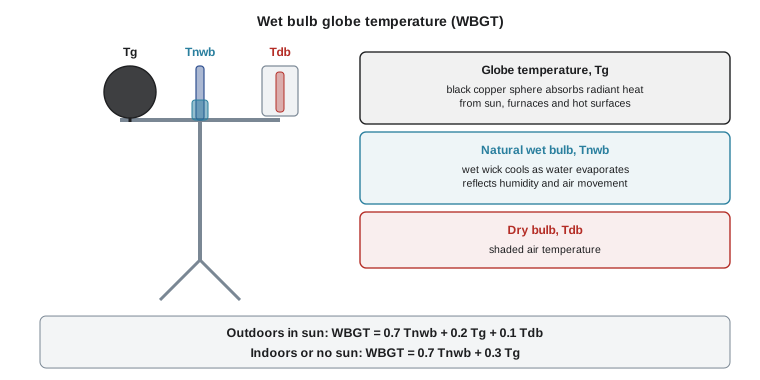
The wet bulb globe temperature, or WBGT, is the index used by the ACGIH heat stress threshold limit values, by ISO 7243, by many Canadian and US regulators, and by militaries and sports bodies around the world. It combines three measurements. The natural wet bulb temperature, Tnwb, is read from a thermometer whose bulb is covered with a wet wick and exposed to natural air movement and radiation; it falls below air temperature as water evaporates from the wick, so it reflects humidity and air movement. The globe temperature, Tg, is read from a thermometer inside a hollow black copper sphere, traditionally 15 cm in diameter, which absorbs radiant heat. The dry bulb temperature, Tdb, is ordinary shaded air temperature.
Outdoors in sunlight, the three are combined as:
Indoors, or outdoors without solar load, the dry bulb term is dropped:
The heavy weighting of the natural wet bulb, 70 percent, reflects how important evaporation is to the body's heat balance. WBGT is always lower than air temperature in normal conditions, so a WBGT of 30 °C is a serious level of heat stress even though 30 °C air temperature might sound moderate. Do not compare WBGT values directly with air temperatures or with humidex.
Measuring WBGT properly
Electronic WBGT meters are now common and much easier to use than the traditional tripod of glass thermometers, but they must be used properly to give meaningful results. The instrument should be placed where the workers actually work, at about chest height, or at head, abdomen and ankle height averaged when conditions vary by height. It needs time to stabilize, typically 10 to 30 minutes for a full-size globe, less for smaller globes, which may read differently from the standard 15 cm globe in some conditions. Readings should be taken during the hottest part of the shift and whenever conditions change. Wet bulb wicks must be kept clean and wet with distilled water.
When work moves between areas with different conditions, such as a furnace area and a cooler break room, a time-weighted average WBGT is calculated over a representative hour or two. Some meters also log data continuously, which is useful for programs that adjust work-rest cycles during the day. Weather services and smartphone apps now provide estimated WBGT forecasts for outdoor locations, which are useful for planning, but they cannot account for local radiant sources or conditions in a specific work area.
# WBGT from three measured temperatures (degrees C)
def wbgt_out(tnwb, tg, tdb): return 0.7 * tnwb + 0.2 * tg + 0.1 * tdb
def wbgt_in(tnwb, tg):       return 0.7 * tnwb + 0.3 * tg

roof  = wbgt_out(tnwb=25.5, tg=52.0, tdb=33.0)    # sunny roof, humid afternoon
shade = wbgt_out(tnwb=24.0, tg=34.0, tdb=31.0)    # nearby shade, no direct sun
foundry = wbgt_in(tnwb=24.0, tg=55.0)             # indoor, near a furnace
print(f"Sunny roof:   WBGT = {roof:.1f} C")
print(f"Shade:        WBGT = {shade:.1f} C")
print(f"Foundry area: WBGT = {foundry:.1f} C")

# Time-weighted average when a worker moves between areas each hour
segments = [(foundry, 40), (wbgt_in(20.0, 24.0), 20)]   # (WBGT, minutes)
twa = sum(w * t for w, t in segments) / sum(t for _, t in segments)
print(f"TWA over the hour (40 min foundry, 20 min break room): {twa:.1f} C")Sunny roof: WBGT = 31.6 C Shade: WBGT = 26.7 C Foundry area: WBGT = 33.3 C TWA over the hour (40 min foundry, 20 min break room): 29.3 C
Radiant heat matters a great deal. Moving from the sunny roof into nearby shade, with air only 2 °C cooler, drops WBGT by about 5 °C, which can mean the difference between continuous work and long rest breaks. Near the furnace, the very high globe temperature drives the WBGT up even though humidity is moderate. The time-weighted average shows the benefit of a cool break area: spending 20 minutes of every hour in the break room brings the hourly average down by about 4 °C.
Humidex
Humidex is a Canadian index developed by Environment Canada in 1965 to describe how hot, humid weather feels to the average person. It combines air temperature and humidity, using the dew point, into a single number read as if it were a temperature in degrees Celsius. It is rarely used in the United States, where the National Weather Service's heat index plays a similar role, but you may see it on equipment or in guidance from Canadian parent companies.
Humidex is calculated from the air temperature T in degrees Celsius and the vapor pressure e in hectopascals, which is derived from the dew point Td:
Environment Canada describes humidex values of 30 to 39 as causing some discomfort, 40 to 45 as great discomfort where exertion should be avoided, and above 45 as dangerous, with heat stroke possible. For workers doing physical work, those general-public bands are not protective enough.
Heat index
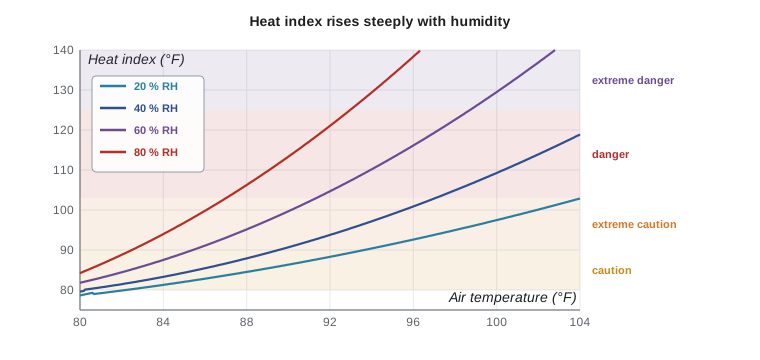
The heat index, used by the National Weather Service, estimates how hot it feels in the shade from air temperature and relative humidity. It is calculated in degrees Fahrenheit using a regression equation developed by Lans Rothfusz, with adjustments for very low or very high humidity. The NWS uses it in its heat advisories and excessive heat warnings, and OSHA and NIOSH guidance has used it to set risk levels for outdoor work. Because it assumes shade and light wind, the NWS notes that full sun can raise the effective heat index by up to about 15 °F.
import math

def humidex(t_c, dewpoint_c):
    e = 6.11 * math.exp(5417.7530 * (1 / 273.16 - 1 / (273.15 + dewpoint_c)))
    return t_c + 0.5555 * (e - 10.0)

def heat_index_f(t_f, rh):
    """NWS heat index (Rothfusz regression with the simple formula below 80 F)."""
    simple = 0.5 * (t_f + 61.0 + (t_f - 68.0) * 1.2 + rh * 0.094)
    if (simple + t_f) / 2 < 80:
        return simple
    hi = (-42.379 + 2.04901523 * t_f + 10.14333127 * rh - 0.22475541 * t_f * rh
          - 6.83783e-3 * t_f**2 - 5.481717e-2 * rh**2 + 1.22874e-3 * t_f**2 * rh
          + 8.5282e-4 * t_f * rh**2 - 1.99e-6 * t_f**2 * rh**2)
    if rh < 13 and 80 <= t_f <= 112:
        hi -= ((13 - rh) / 4) * math.sqrt((17 - abs(t_f - 95)) / 17)
    elif rh > 85 and 80 <= t_f <= 87:
        hi += ((rh - 85) / 10) * ((87 - t_f) / 5)
    return hi

def dewpoint(t_c, rh):                      # Magnus approximation
    a, b = 17.62, 243.12
    g = math.log(rh / 100) + a * t_c / (b + t_c)
    return b * g / (a - g)

for t_c, rh in [(30, 40), (30, 70), (33, 55), (35, 30)]:
    td = dewpoint(t_c, rh)
    t_f = t_c * 9 / 5 + 32
    hi_f = heat_index_f(t_f, rh)
    print(f"{t_c} C, RH {rh:2d}%: dew point {td:4.1f} C, humidex {humidex(t_c, td):4.1f}, "
f"heat index {hi_f:5.1f} F ({(hi_f - 32) * 5 / 9:4.1f} C)")30 C, RH 40%: dew point 14.9 C, humidex 33.9, heat index 85.4 F (29.7 C) 30 C, RH 70%: dew point 23.9 C, humidex 41.2, heat index 95.1 F (35.0 C) 33 C, RH 55%: dew point 22.8 C, humidex 43.0, heat index 100.1 F (37.8 C) 35 C, RH 30%: dew point 14.8 C, humidex 38.9, heat index 94.4 F (34.7 C)
The comparison shows two things. First, humidity matters a great deal: at 30 °C, raising relative humidity from 40 to 70 percent raises the humidex by about 7 points. Second, humidex and heat index give different numbers. At 30 °C and 70 percent, the humidex is about 41 while the heat index is about 35 °C (95 °F). Neither is wrong; they are different scales. A workplace plan must say clearly which index it uses and set its action levels on that scale.
Comparing the indices
| Index | Inputs | Strengths | Limitations |
|---|---|---|---|
| WBGT | Natural wet bulb, globe and dry bulb temperatures | Captures radiant heat and air movement; basis of ACGIH TLVs and ISO 7243; works indoors and outdoors | Needs an instrument on site; must be combined with work rate and clothing |
| Humidex | Air temperature and dew point | Widely available in Canadian forecasts; easy to understand | Assumes shade; ignores radiant heat, wind, work rate and clothing |
| Heat index | Air temperature and relative humidity | Widely available in US forecasts; used in NWS alerts | Assumes shade and light wind; full sun can add up to about 8 °C |
| Physiological monitoring | Heart rate, core or skin temperature | Measures the individual worker's strain directly | Needs equipment and expertise; privacy and interpretation issues |
In practice, many workplaces use two levels. Weather-based indices such as humidex or heat index are used for daily planning and to trigger the heat plan, because they are forecast in advance and easy to communicate. WBGT measurements are used where conditions are severe, where radiant sources or protective clothing are involved, or where the employer needs to compare conditions with ACGIH screening criteria. Physiological monitoring is reserved for high-risk work, such as firefighting, hazmat response or work in encapsulating suits.
Physiological monitoring
Because the indices describe the environment, not the person, they cannot tell how a particular worker is coping. Physiological monitoring measures heat strain directly. The ACGIH guidance suggests that heat strain may be excessive if sustained heart rate exceeds about 180 beats per minute minus age, if core temperature exceeds 38.5 °C in medically selected, acclimatized workers or 38 °C in unselected or unacclimatized workers, if heart rate does not recover to about 120 beats per minute one minute after peak work, or if there are symptoms such as sudden fatigue, nausea, dizziness or light-headedness.
Wearable sensors now estimate core temperature from heart rate and skin temperature, and ingestible temperature pills give direct readings in research and some emergency response work. These tools can be valuable, but they raise questions of accuracy, privacy and who sees the data. They support, but do not replace, environmental assessment, good work planning and trained observation by workers and supervisors.
Worked problem
Calculating outdoor WBGT and checking the effect of shade
A road crew is paving in full sun. The natural wet bulb is 24 °C, the globe is 50 °C and the dry bulb is 32 °C. A tent canopy would reduce the globe reading to 35 °C under it. Calculate WBGT in both cases.
Show solution
- In sun: WBGT = 0.7 × 24 + 0.2 × 50 + 0.1 × 32 = 16.8 + 10.0 + 3.2 = 30.0 °C.
- Under the canopy, with no direct sun on the instrument, use the indoor formula: 0.7 × 24 + 0.3 × 35 = 16.8 + 10.5 = 27.3 °C.
- The canopy reduces WBGT by about 2.7 °C.
- That reduction can allow a substantially longer work period in each hour under ACGIH-style work-rest guidance.
Answer: WBGT is 30.0 °C in sun and about 27.3 °C under the canopy. Shade is one of the cheapest, most effective outdoor heat controls.
Worked problem
Choosing an index for a plan
A municipal works department wants one heat stress plan for park crews and for staff in a water treatment plant boiler room. Which indices should it use?
Show solution
- For park crews, forecast heat index is easy to obtain each morning and can trigger the plan, with adjustments for sun, work rate and acclimatization.
- The boiler room has strong radiant heat that weather indices cannot capture, and conditions do not depend on the forecast.
- For the boiler room, the department should measure WBGT at the work locations and compare it with ACGIH screening criteria for the work rate.
- The plan should state which index applies to which work and set action levels on the correct scale for each.
Answer: Use forecast heat index for outdoor crews and measured WBGT for the boiler room, with action levels set on each scale.
Common mistakes
MistakeComparing a WBGT reading directly with an air temperature or humidex value.
InsteadWBGT, humidex and heat index are different scales; compare each only with its own action levels.
MistakePlacing a WBGT meter in the shade of a truck to measure work in full sun.
InsteadMeasure where workers actually work, at chest height, after the instrument stabilizes.
MistakeRelying on forecast humidex or heat index for work near furnaces or ovens.
InsteadWeather indices ignore radiant sources; measure WBGT at indoor hot work.
MistakeUsing relative humidity alone to judge how muggy it is.
InsteadDew point or vapor pressure is a better measure of moisture, because warm air holds more water.
MistakeAssuming a wearable sensor replaces a heat stress plan.
InsteadPhysiological monitoring supports good planning and observation but does not replace them.
Summary and key terms
- Heat stress depends on air temperature, humidity, radiant heat and air movement, plus work rate and clothing.
- WBGT combines natural wet bulb, globe and dry bulb temperatures and is the basis of the ACGIH TLVs.
- Outdoor WBGT is 0.7 Tnwb + 0.2 Tg + 0.1 Tdb; indoor WBGT is 0.7 Tnwb + 0.3 Tg.
- WBGT must be measured where people work, after stabilizing, during the hottest conditions.
- Humidex (Canada) and heat index (US) estimate how hot it feels in shade from temperature and humidity.
- Humidex, heat index and WBGT are different scales; a plan must state which it uses.
- Physiological monitoring measures individual strain and supports, but does not replace, planning.
- Dry bulb temperature
- Air temperature measured with a shaded thermometer.
- Natural wet bulb temperature
- Temperature from a wetted thermometer exposed to natural air movement, reflecting humidity and air speed.
- Globe temperature
- Temperature inside a black globe, reflecting radiant heat.
- WBGT
- Wet bulb globe temperature, a weighted combination of natural wet bulb, globe and dry bulb temperatures.
- Relative humidity
- The percentage of the maximum water vapor the air can hold at its temperature.
- Dew point
- The temperature at which air becomes saturated with water vapor.
- Humidex
- A Canadian index combining temperature and dew point to describe how hot, humid weather feels.
- Heat index
- A US National Weather Service index combining temperature and relative humidity to describe how hot it feels in shade.
- Time-weighted average WBGT
- The average WBGT over a period, weighted by time spent in each area.
- Physiological monitoring
- Measuring a worker's heart rate, core temperature or other signs of heat strain directly.
Practice problems
Work each problem on paper first, then reveal the answer to check.
Name the four environmental factors that affect heat stress.
Show answer
Air temperature, humidity, radiant heat and air movement.
Write the outdoor and indoor WBGT formulas.
Show answer
Outdoor: 0.7 Tnwb + 0.2 Tg + 0.1 Tdb. Indoor: 0.7 Tnwb + 0.3 Tg.
Why does the natural wet bulb carry 70 percent of the WBGT weighting?
Show answer
Because evaporation of sweat is the most important cooling route in heat.
Calculate indoor WBGT for Tnwb = 26 °C and Tg = 40 °C.
Show answer
0.7 × 26 + 0.3 × 40 = 18.2 + 12.0 = 30.2 °C.
Where should a WBGT meter be placed?
Show answer
At the work location, about chest height, in the same sun or radiant exposure as the workers, after it stabilizes.
What inputs does humidex use?
Show answer
Air temperature and dew point (via vapor pressure).
What is the main limitation of humidex and heat index for indoor hot work?
Show answer
They ignore radiant heat, and also air movement, work rate and clothing.
Why can a time-weighted average WBGT be lower than the WBGT at the work station?
Show answer
Time spent in a cooler area, such as a break room, lowers the hourly average.
Give two physiological signs that heat strain may be excessive.
Show answer
Any two of sustained heart rate above about 180 minus age, core temperature above 38–38.5 °C, slow heart rate recovery, or symptoms such as sudden fatigue, nausea or dizziness.
Why should a heat plan state which index it uses?
Show answer
Different indices give different numbers for the same conditions, so action levels only make sense on their own scale.
Lesson quiz · 5 questions
Score 60% or more to complete this lesson.
Create a free account to save your progress, take quizzes and earn a certificate.