
HSE-108 · Lesson 2 of 12 · 26 min
The scale and impact of violence and harassment
Workplace violence and harassment are difficult to measure. Many incidents are never reported, definitions differ between surveys and laws, and official injury statistics capture only cases that lead to time off work or a compensation claim. Even so, the available data show that the problem is large, that it is concentrated in certain sectors and groups, and that it carries heavy human and financial costs. This lesson looks at what the numbers say, how to calculate and interpret rates for your own workplace, and how to estimate the cost of doing nothing.
What the US data show
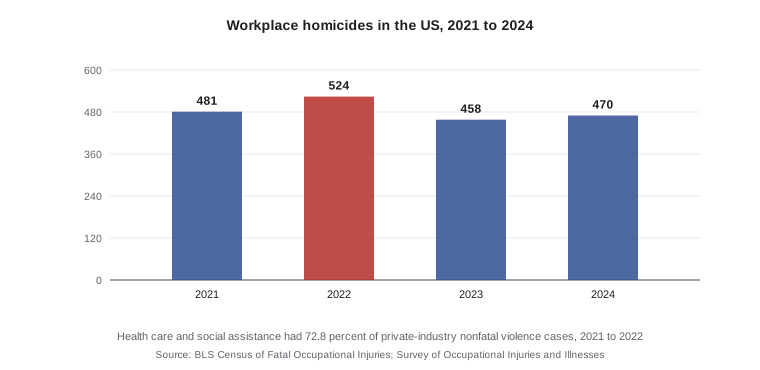
The US Bureau of Labor Statistics (BLS) reports that private industry employers recorded 57,610 cases of intentional injury by another person that required days away from work, job transfer or restriction in 2021 and 2022 combined, an annualized rate of 2.9 cases per 10,000 full-time equivalent workers. Women experienced these injuries at more than three times the rate of men: 5.0 compared with 1.4 per 10,000. Health care and social assistance accounted for 41,960 of the cases, 72.8% of the private-industry total, at a rate of 14.2 per 10,000 full-time workers. The median time away from work was seven days. Workplace homicides, counted by the BLS Census of Fatal Occupational Injuries, reached a series high of 524 in 2022, then numbered 458 in 2023 and 470 in 2024, out of 5,070 fatal work injuries that year.
Beyond these official counts, surveys of nurses, emergency department staff, teachers, retail workers and transit operators consistently report high rates of verbal abuse and threats, much of which never appears in injury statistics. Many workers do not report incidents because they believe violence is part of the job, fear blame or retaliation, or think nothing will be done. Official figures should therefore be treated as a floor, not a ceiling.
Who is most at risk
Risk is not evenly spread. Across both countries, research points to the same groups and settings at higher risk of violence and harassment:
- Workers who provide care, services or enforcement to the public, especially people in pain, distress, crisis or under the influence of alcohol or drugs.
- Workers who handle cash or valuables, work alone or in small numbers, or work late at night or early in the morning.
- Workers who work in the community, in clients' homes or in vehicles, away from immediate help.
- Young and new workers, who may not know their rights, may be less confident about reporting and often work in high-contact service jobs.
- Women, who experience much higher rates of sexual harassment and, in health care and social services, higher rates of client violence.
- Workers who belong to racialized groups, Indigenous workers, 2SLGBTQI+ workers, workers with disabilities and newcomers, who face discriminatory harassment and may face additional barriers to reporting.
- Workers in precarious employment, such as temporary, agency, gig and seasonal workers, who may fear losing work if they complain.
Why so much goes unreported
Under-reporting is one of the biggest obstacles to prevention. Workers often say that reporting takes too long, that nothing changes, that they will be seen as weak or as poor at their job, that management will side with the customer or the harasser, or that they fear retaliation. In health care, a culture of "it's part of the job" has long discouraged staff from reporting assaults by patients. Harassment by a supervisor is especially hard to report when the supervisor controls schedules, evaluations and promotion.
An organization with few reports may simply have a reporting problem, not a safe workplace. One useful check is to compare the number of reports with what workers say in anonymous surveys. If a survey finds that a third of staff were verbally abused in the past year but the incident system shows a handful of reports, the gap tells you that people do not trust or use the system. Improving trust usually increases the number of reports at first. That is a sign of progress, not failure.
Calculating incidence rates
Raw counts are hard to compare between workplaces of different sizes or across years with different staffing. Rates solve this by expressing incidents per unit of exposure, usually per 100 full-time workers per year or per 10,000 full-time equivalents. One full-time worker is taken as 2,000 hours per year, so 100 full-time workers represent 200,000 hours.
The same formula with 20,000,000 in place of 200,000 gives a rate per 10,000 full-time equivalents, the unit used in the US national data. Rates can be calculated for all reported incidents, for incidents causing injury, for incidents requiring time off, or for specific types such as threats or physical assaults. Choose the measure that fits your question and use it consistently.
Worked problem
Comparing two units
A hospital records 18 reported violent incidents in its emergency department, where staff worked 120,000 hours last year, and 9 incidents in its medical ward, where staff worked 150,000 hours. Calculate the rate per 100 full-time workers for each unit and compare them.
Show solution
- \[\text{Emergency} = \frac{18 \times 200\,000}{120\,000} = 30.0\]
- \[\text{Medical ward} = \frac{9 \times 200\,000}{150\,000} = 12.0\]
- Compare: the emergency department's rate is 30.0 ÷ 12.0 = 2.5 times the ward's rate, even though raw counts differ by a factor of only 2.
- Interpret with care: if the ward has weaker reporting habits, its true rate may be higher. Check survey data and near-miss reports before concluding the ward is safe.
Answer: The emergency department has 30.0 incidents per 100 full-time workers per year and the medical ward 12.0. The emergency department's rate is 2.5 times higher, so it should be a priority, while the ward's reporting should also be checked.
Leading and lagging indicators
Incident and injury rates are lagging indicators: they measure harm after it has happened. A good program also tracks leading indicators that show whether prevention is working before people get hurt. Examples include the percentage of staff who have completed violence prevention training, the number of risk assessments completed and reviewed on time, the percentage of flagged high-risk clients with a care plan, the time taken to begin investigations, the number of near misses and threats reported, the proportion of corrective actions completed by their due date, and survey measures of psychological safety and trust in reporting. Lesson 12 explains how to use these measures to evaluate a program.
The human impact
Behind every statistic is a person. Physical assaults cause bruises, bites, fractures, head injuries, scratches that carry infection risk and, in the worst cases, death. Sexual assault and harassment cause profound distress. The psychological effects of violence and harassment include fear, hypervigilance, anxiety, depression, sleep disturbance, loss of confidence, post-traumatic stress and, sometimes, thoughts of suicide. Effects can last long after the incident and can spill over into family life. Witnesses and co-workers are also affected, and repeated exposure to aggression contributes to burnout and moral distress among health care and social services workers.
Harassment that continues over months can be as damaging as a single violent incident. Targets of bullying often report feeling isolated, doubting their own competence and dreading going to work. Many eventually leave, taking their skills and experience with them.
The organizational cost
Violence and harassment also cost organizations money, often far more than they realize. Direct costs include medical care, workers' compensation premiums and claims, wage replacement, legal fees, settlements and fines. Indirect costs are usually larger: absenteeism, overtime and agency staff to cover absences, recruiting and training replacements, lost productivity, management time spent on investigations and grievances, reduced quality of care or service, damage to reputation and difficulty attracting staff. Replacing an experienced employee is commonly estimated to cost from a fraction of a year's salary for entry-level roles to well over a year's salary for specialized professionals; use your own organization's figures where possible.
| Cost category | Examples | Usually measured? |
|---|---|---|
| Direct injury costs | Medical care, compensation claims, premiums | Yes |
| Absence and replacement | Sick leave, overtime, agency staff | Partly |
| Turnover | Recruiting, onboarding, lost expertise | Rarely |
| Productivity and quality | Reduced focus, errors, poorer service | Rarely |
| Legal and regulatory | Investigations, grievances, complaints, fines, settlements | Partly |
| Reputation | Public trust, ability to recruit, client loss | Rarely |
Worked problem
Estimating the cost of a harassment problem
A retail chain with 400 employees finds through exit interviews that 12 employees left last year mainly because of harassment by one district manager and by abusive customers who were not dealt with. The average cost to replace a sales associate is estimated at $6,500, including recruiting, training and lost productivity. Two of those who left also took 15 days of leave each before quitting, at an average cost of $220 per day including replacement. A charge filed with the EEOC and the related legal work cost $18,000. Estimate the annual cost.
Show solution
- \[\text{Turnover} = 12 \times \$6\,500 = \$78\,000\]
- \[\text{Leave} = 2 \times 15 \times \$220 = \$6\,600\]
- \[\text{Legal} = \$18\,000\]
- \[\text{Total} = \$78\,000 + \$6\,600 + \$18\,000 = \$102\,600\]
- Compare with prevention: manager training, a clear policy, customer conduct signage and a prompt investigation process might cost a fraction of this amount, and the estimate excludes harder-to-measure costs such as lost sales and reputation.
Answer: The measurable cost is about $102,600 for one year, and the true cost is likely higher. Even a well-funded prevention program would probably pay for itself.
Using data responsibly
Statistics are useful for setting priorities and persuading decision-makers, but they should be used carefully. Keep the identities of people involved in incidents confidential when sharing data. Avoid using report counts as performance targets for managers, because that creates pressure to discourage reporting. Look at rates alongside qualitative information from workers, committees and investigations. And remember that national averages say little about a specific workplace: a small clinic with one aggressive client may face more risk than a large office with none. Lesson 5 explains how to assess risk in your own setting.
Rates are most useful when tracked over time and compared with similar workplaces. A single year's rate in a small unit can swing widely because of one or two incidents, so look at three-year averages where numbers are small.
Common mistakes
MistakeConcluding that few reports mean little violence or harassment.
InsteadCheck for under-reporting with anonymous surveys and near-miss data; low numbers may signal low trust.
MistakeComparing raw incident counts between units of different sizes.
InsteadCalculate rates per 100 or per 10,000 full-time workers using hours worked.
MistakeSetting targets that reward managers for fewer reports.
InsteadTrack leading indicators and reward prompt reporting and corrective action.
MistakeCounting only injury costs.
InsteadInclude turnover, absence, productivity, legal and reputational costs.
MistakeAssuming national statistics describe your workplace.
InsteadUse them for context and assess your own risks and data.
Summary and key terms
- US private employers recorded 57,610 days-away or restricted cases from intentional injury by another person in 2021 and 2022, 72.8% in health care and social assistance.
- There were 470 workplace homicides in the US in 2024, after a peak of 524 in 2022.
- Health care, social services, retail, hospitality, education, transit and security have elevated risk of violence.
- Under-reporting is widespread; low report numbers can reflect low trust rather than low risk.
- Rate per 100 full-time workers = incidents × 200,000 ÷ hours worked.
- Leading indicators show whether prevention is working before harm occurs.
- Indirect costs such as turnover and lost productivity usually exceed direct injury costs.
- Incidence rate
- Number of incidents per unit of exposure, such as per 100 full-time workers per year.
- Full-time equivalent (FTE)
- A unit of work equal to one full-time worker, about 2,000 hours a year.
- Lagging indicator
- A measure of harm after it has occurred, such as injury rates.
- Leading indicator
- A measure of prevention activity or conditions before harm occurs.
- Under-reporting
- Failure of incidents to be reported, so that records understate the problem.
- Direct cost
- A cost clearly linked to an incident, such as medical care or compensation.
- Indirect cost
- A hidden or secondary cost, such as turnover or lost productivity.
- Turnover cost
- The cost of replacing an employee who leaves, including recruiting and training.
- Moral distress
- Distress when workers cannot act as they believe they should, often linked to repeated aggression and short staffing.
- Near miss
- An event that could have caused harm but did not.
Practice problems
Work each problem on paper first, then reveal the answer to check.
A warehouse records 4 threats and assaults in 80,000 hours. What is the rate per 100 full-time workers?
Show answer
4 × 200,000 ÷ 80,000 = 10.0.
Convert a rate of 2.5 per 100 full-time workers to a rate per 10,000.
Show answer
250 per 10,000 full-time workers.
A unit's reports doubled after a new reporting app was introduced. Is that necessarily bad?
Show answer
No. It may reflect improved trust and easier reporting rather than more violence.
Name three groups at higher risk of workplace harassment.
Show answer
Young workers, women and LGB or 2SLGBTQI+ workers (also racialized workers, newcomers and precarious workers).
Give two leading indicators for a violence prevention program.
Show answer
Percentage of staff trained; percentage of risk assessments reviewed on time (also near-miss reports, corrective actions closed).
Eight employees leave because of bullying. Replacement costs $9,000 each. What is the turnover cost?
Show answer
$72,000.
Why should report counts not be used as manager performance targets?
Show answer
It creates pressure to discourage reporting and hides real problems.
Which sector accounts for most nonfatal workplace violence injuries?
Show answer
Health care and social assistance.
Name two reasons workers do not report harassment.
Show answer
Fear of retaliation and belief that nothing will be done (also stigma, power imbalance).
A clinic with 30,000 hours worked had 6 incidents. A larger clinic with 90,000 hours had 9. Which has the higher rate?
Show answer
The small clinic: 40.0 versus 20.0 per 100 full-time workers.
Lesson quiz · 5 questions
Score 60% or more to complete this lesson.
Create a free account to save your progress, take quizzes and earn a certificate.