
GEOM-340 · Lesson 2 of 12 · 24 min
Scale factors and distortion
Lesson 1 described distortion in words; this lesson measures it. Leah's first exercise for the district's staff was to answer a question from the agronomist: if the GIS reports that a field is 62.50 ha and the lateral beside it is 1,313 m long, how much of each number is the field and how much is the map? The answer needs the scale factor, the single number that converts a length on the reference surface into a length on the projection at a point, and its two-dimensional extension, Tissot's indicatrix, which shows how a projection treats every direction at once.
Point scale factor
The nominal scale of a printed map, such as 1:50,000, is the ratio of map distance to ground distance chosen by the cartographer. It cannot be exact everywhere because the projection distorts. The point scale factor \(k\) describes that departure. If a very short line of length \(ds\) on the ellipsoid becomes a line of length \(dS\) on the projection plane, then
and the scale factor depends both on the location and, in general, on the direction of the line. On a conformal projection it depends only on location: a short line at a point is scaled by the same \(k\) whatever its direction. A scale factor of 0.9996, the value on the central meridian of UTM, means that a 1,000.000 m line on the ellipsoid is 999.600 m on the grid, a reduction of 400 parts per million (ppm). Surveyors often express the departure as \((k - 1) \times 10^6\) ppm, or as a ratio such as 1 part in 2,500. A long line crosses places with different scale factors, so its grid length is found from an average factor, usually computed from the factors at the two ends and the middle, a refinement treated in lesson 8.
Two special directions are used to describe any projection. The scale along the meridian is called \(h\) and the scale along the parallel \(k\). For a sphere of radius \(R\), a short step \(d\varphi\) north covers \(R\,d\varphi\) on the ground, and a short step \(d\lambda\) east covers \(R\cos\varphi\,d\lambda\). If the projection formulas are \(x(\varphi,\lambda)\) and \(y(\varphi,\lambda)\), then
On an ellipsoid the ground steps are \(M\,d\varphi\) and \(N\cos\varphi\,d\lambda\), with \(M\) and \(N\) the radii of curvature from Geodesy I, and the same formulas apply with those radii. Computing \(h\) and \(k\) needs nothing more than the projection formulas and their derivatives, which is how the code in this lesson finds them numerically.
Tissot's indicatrix
In 1859 and 1881 the French cartographer Nicolas Auguste Tissot showed that any projection maps an infinitesimally small circle on the globe into an ellipse on the map (or a circle, as a special case). The ellipse, called the indicatrix, summarizes the distortion at that point. Its semi-major axis \(a\) is the largest scale in any direction, its semi-minor axis \(b\) the smallest. The two axes are always at right angles on the map and correspond to two directions at right angles on the globe. From \(a\) and \(b\) come the measures that matter:
| Measure | Formula | Meaning |
|---|---|---|
| Area scale | \(s = ab\) | How much a small area is enlarged; 1 on an equal-area projection |
| Maximum angular distortion | \(\omega = 2\arcsin\frac{a - b}{a + b}\) | The largest change in any angle at the point; 0 on a conformal projection |
| Linear scale | \(b \le k_{\theta} \le a\) | The scale in direction \(\theta\) lies between the axes |
| Conformal test | \(a = b\), so \(h = k\) | The indicatrix is a circle |
| Equal-area test | \(ab = 1\) | The indicatrix has the area of the original circle |
When the meridians and parallels cross at right angles on the map, as they do on all the normal cylindrical and conic projections, the axes of the indicatrix lie along the meridian and the parallel, so \(a\) and \(b\) are simply the larger and smaller of \(h\) and \(k\). Where the graticule is not orthogonal on the map, as on many oblique and compromise projections, the axes must be found from \(h\), \(k\) and the angle \(\theta'\) between meridian and parallel on the map, using \(a' = \sqrt{h^2 + k^2 + 2hk\sin\theta'}\), \(b' = \sqrt{h^2 + k^2 - 2hk\sin\theta'}\), \(a = (a' + b')/2\) and \(b = (a' - b')/2\). The code uses this general form so that it works for any projection.
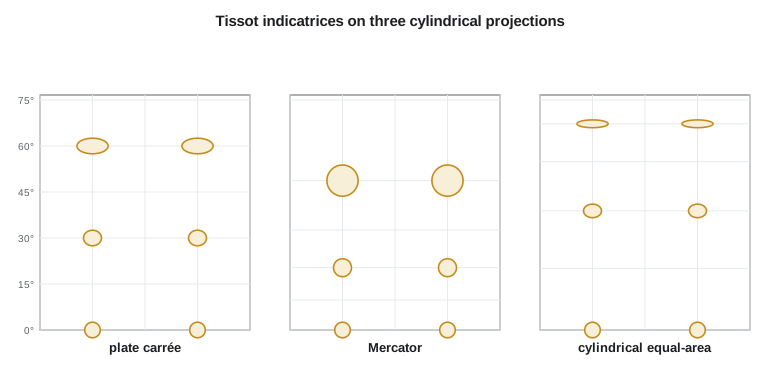
Three cylindrical projections compared
Three normal-aspect cylindrical projections show the possibilities clearly, because all three draw parallels as horizontal lines and meridians as equally spaced vertical lines, with the same east-west scale \(k = \sec\varphi\) on a sphere. They differ only in how the parallels are spaced. The plate carrée spaces them equally, so \(h = 1\) everywhere: distances along meridians are true, but east-west distances are stretched by \(\sec\varphi\). The Mercator projection spaces the parallels so that \(h = k = \sec\varphi\) at every latitude, which makes it conformal at the cost of enlarging areas by \(\sec^2\varphi\). The cylindrical equal-area projection, attributed to Lambert, spaces the parallels by \(R\sin\varphi\), so \(h = \cos\varphi\) and \(hk = 1\): areas are true, but shapes are squashed north-south as they are stretched east-west.
import math
R = 6371000.0

# Projections on a sphere: (latitude, longitude) in radians -> (x, y) in map units (m)
def plate_carree(p, l):  return R * l, R * p
def mercator(p, l):      return R * l, R * math.log(math.tan(math.pi / 4 + p / 2))
def equal_area_cyl(p, l): return R * l, R * math.sin(p)          # Lambert cylindrical equal-area

def tissot(proj, lat, lon=0.0, d=1e-6):
    """Scale along the meridian (h), along the parallel (k), the semi-axes a, b of
    Tissot's indicatrix, the area scale and the maximum angular distortion."""
    p, l = math.radians(lat), math.radians(lon)
    x0, y0 = proj(p, l)
    xp, yp = proj(p + d, l); xl, yl = proj(p, l + d)
    dx_dp, dy_dp = (xp - x0) / d, (yp - y0) / d
    dx_dl, dy_dl = (xl - x0) / d, (yl - y0) / d
    h = math.hypot(dx_dp, dy_dp) / R
    k = math.hypot(dx_dl, dy_dl) / (R * math.cos(p))
    # the intersection angle of meridian and parallel on the map (90 deg on these maps)
    theta = abs(math.atan2(dx_dp * dy_dl - dy_dp * dx_dl, dx_dp * dx_dl + dy_dp * dy_dl))
    s = h * k * math.sin(theta)                       # area scale
    ap = math.sqrt(h*h + k*k + 2*s); bp = math.sqrt(h*h + k*k - 2*s)
    a, b = (ap + bp) / 2, (ap - bp) / 2
    omega = 2 * math.degrees(math.asin((a - b) / (a + b)))
    return h, k, a, b, s, omega

print(f"{'projection':22s}{'lat':>6s}{'h':>8s}{'k':>8s}{'area':>8s}{'max angle err':>15s}")
for name, f in (("plate carree", plate_carree), ("Mercator", mercator), ("cyl. equal-area", equal_area_cyl)):
    for lat in (0, 30, 47.5, 70):
        h, k, a, b, s, om = tissot(f, lat)
        print(f"{name:22s}{lat:6.1f}{h:8.3f}{k:8.3f}{s:8.3f}{om:12.2f} deg")
    print()

# What the numbers mean at the district: a 1.000 km by 1.000 km square field
for name, f in (("plate carree", plate_carree), ("Mercator", mercator), ("cyl. equal-area", equal_area_cyl)):
    h, k, a, b, s, om = tissot(f, 47.5)
    print(f"{name:16s} draws the 1 km square as {k:.3f} km wide by {h:.3f} km tall "
f"(map area {s:.3f} km2)")projection lat h k area max angle err plate carree 0.0 1.000 1.000 1.000 0.00 deg plate carree 30.0 1.000 1.155 1.155 8.23 deg plate carree 47.5 1.000 1.480 1.480 22.33 deg plate carree 70.0 1.000 2.924 2.924 58.72 deg Mercator 0.0 1.000 1.000 1.000 0.00 deg Mercator 30.0 1.155 1.155 1.333 0.00 deg Mercator 47.5 1.480 1.480 2.191 0.00 deg Mercator 70.0 2.924 2.924 8.549 0.00 deg cyl. equal-area 0.0 1.000 1.000 1.000 0.00 deg cyl. equal-area 30.0 0.866 1.155 1.000 16.43 deg cyl. equal-area 47.5 0.676 1.480 1.000 43.83 deg cyl. equal-area 70.0 0.342 2.924 1.000 104.47 deg plate carree draws the 1 km square as 1.480 km wide by 1.000 km tall (map area 1.480 km2) Mercator draws the 1 km square as 1.480 km wide by 1.480 km tall (map area 2.191 km2) cyl. equal-area draws the 1 km square as 1.480 km wide by 0.676 km tall (map area 1.000 km2)
The table agrees with the formulas. At the district's latitude, 47.5°, the plate carrée's indicatrix is an ellipse 1.480 wide and 1.000 tall, enlarging areas by 48 % and distorting angles by up to 22.3°. Mercator keeps angles exact but enlarges areas by a factor of 2.19. The equal-area projection keeps the 1 km square at 1.000 km², but draws it 1.480 km wide and 0.676 km tall, with angular distortion of up to 44°. A field boundary that meets a road at a right angle would appear on that map at an angle far from 90°. None of these projections is suitable for measurement at the district: they are world-map projections whose distortion at middle latitudes is enormous. Their value here is in showing that the choice of property is real and that the cost of each choice can be calculated.
Areas, lengths and angles on a projection
For a conformal projection the scale factor answers the agronomist's question directly. A length \(L\) measured on the grid corresponds to an ellipsoid length \(L/k\), and an area \(A\) measured on the grid corresponds to an ellipsoid area \(A/k^2\), because area scales with the square of linear scale. On UTM near the central meridian, where \(k = 0.9996\), a 1,313.0 m grid length is 1,313.5 m on the ellipsoid and a 62.50 ha grid area is 62.55 ha on the ellipsoid. Near the edge of a zone, where \(k\) may be 1.0006, the corrections reverse sign. A field 60 ha in size thus differs by about 0.05 to 0.08 ha between grid and ellipsoid, which is small for agronomy and large for a legal survey.
Area is the quantity most often misunderstood. Legal areas in land titles are normally computed from ground or ellipsoid distances, not from map coordinates in a provincial or state system, so the area of a parcel computed by a GIS from grid coordinates will differ from the registered area even when both are correct. Where areas from a GIS are to be compared with titles or deeds, they should be computed on the ellipsoid, which most GIS software can do as a 'geodesic' or 'ellipsoidal' area, or in an equal-area projection centered on the region, or corrected by \(k^2\) and by the height factor of lesson 8. GIS tools that report 'planar' areas are giving grid areas.
Angles need care of a different kind. On a conformal projection the angle between two short lines is the same on the map and on the ground, but a long line plots as a gentle curve, not a straight line, because the scale changes along it. The straight line joining the two ends on the map, the chord, differs in direction from the tangent to the curved image at each end by a small angle, the arc-to-chord or \((t - T)\) correction. For lines of a few kilometers on a well-designed zone it is a fraction of an arc second and can be ignored; for lines of tens of kilometers it reaches several seconds and is applied in precise work. Lesson 6 returns to this, along with the related grid convergence between grid north and true north.
Distortion maps
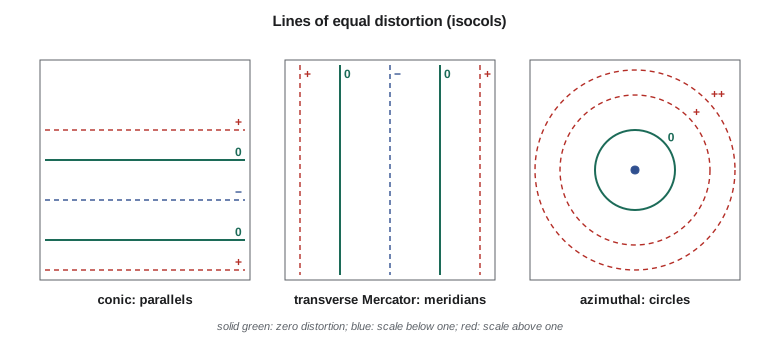
The scale factor varies smoothly over a projection, so its pattern can be drawn as a map of lines of equal distortion, called isocols. On a normal cylindrical projection the isocols are parallels of latitude; on a normal conic projection they are also parallels, with zero distortion along the standard parallels; on a transverse Mercator projection they are lines roughly parallel to the central meridian; and on an azimuthal projection they are circles around the center. A distortion map shows at a glance whether a projection suits a region: the best choice has its isocols following the region's long axis, so that the region lies within a narrow band of scale. That is why the long north-south state of Idaho uses transverse Mercator zones, the long east-west state of Montana uses a Lambert conic, and Alberta, longer north-south than east-west, uses transverse Mercator bands.
Worked problem
Converting a grid area to an ellipsoid area
Field 7-14 has a grid area of 62.500 ha on the Montana State Plane zone, where the point scale factor at its center is 0.999429. What is its area on the ellipsoid?
Show solution
- \[A_{ell} = \frac{A_{grid}}{k^2} = \frac{62.500}{0.999429^2}\]
- \[A_{ell} = \frac{62.500}{0.998858} = 62.571 \text{ ha}\]
Answer: The ellipsoid area is 62.571 ha, 0.071 ha or 710 m² more than the grid area. The ground area at about 1,000 m above the ellipsoid is larger still, by about 0.031 % or a further 0.020 ha, a correction lesson 8 adds.
Worked problem
Angular distortion from the axes of the indicatrix
On a map the indicatrix at a point has semi-axes \(a = 1.20\) and \(b = 0.90\). What are the area scale and the maximum angular distortion?
Show solution
- \[s = ab = 1.20 \times 0.90 = 1.08\]
- \[\omega = 2\arcsin\frac{1.20 - 0.90}{1.20 + 0.90} = 2\arcsin 0.1429 = 16.4^\circ\]
Answer: Areas are enlarged by 8 % and some angles are changed by as much as 16.4°. Such a projection is neither conformal nor equal-area.
Common mistakes
MistakeUsing a printed map's nominal scale as exact everywhere on the sheet.
InsteadThe point scale factor varies over the projection; the nominal scale applies only where k = 1.
MistakeCorrecting areas by k instead of k squared.
InsteadLinear scale k becomes area scale k² on a conformal projection.
MistakeComparing a GIS planar area with a legal area on a title.
InsteadCompute geodesic or ellipsoidal areas, or correct by k² and the height factor.
MistakeAssuming the indicatrix axes always lie along the meridian and parallel.
InsteadThat is true only where the graticule is orthogonal on the map.
MistakeTreating conformal as meaning undistorted.
InsteadConformal projections keep angles; their scale still varies from place to place.
Summary and key terms
- The point scale factor k is the ratio of a short projected length to the same length on the ellipsoid.
- On a conformal projection k depends only on position; elsewhere it depends on direction too.
- Scales along the meridian (h) and parallel (k) follow from derivatives of the projection formulas.
- Tissot's indicatrix is the ellipse into which a small circle maps; its axes give area scale and maximum angular distortion.
- Conformal projections have circular indicatrices; equal-area projections have indicatrices of unit area.
- Grid lengths convert to ellipsoid lengths by dividing by k, and areas by dividing by k².
- Distortion maps (isocols) show which projection fits a region's shape.
- Point scale factor
- The ratio of projected to ellipsoid length for a very short line at a point.
- Tissot's indicatrix
- The ellipse into which an infinitesimal circle on the globe is mapped.
- Area scale
- The product ab of the indicatrix semi-axes.
- Angular distortion
- The largest change in any angle at a point, 2 arcsin((a - b)/(a + b)).
- Isocol
- A line joining points of equal distortion on a projection.
- ppm
- Parts per million; 1 ppm is 1 mm per kilometer.
- Arc-to-chord correction
- The small angle between a line's curved image and the straight chord joining its ends.
Practice problems
Work each problem on paper first, then reveal the answer to check.
A grid distance of 2,500.000 m lies where k = 1.000250. What is the ellipsoid distance?
Show answer
2,500.000 / 1.000250 = 2,499.375 m.
An indicatrix has a = b = 1.15. What kind of projection is it, and what is the area scale?
Show answer
Conformal; area scale 1.3225.
Why are the plate carrée's angles distorted at 49.7°?
Show answer
Its east-west scale is sec φ = 1.546 but its north-south scale is 1, so the indicatrix is an ellipse.
Express k = 0.99975 in parts per million.
Show answer
−250 ppm, or 250 mm short per kilometer.
Which projection pattern suits a region long in the north-south direction?
Show answer
A transverse Mercator, whose isocols run north-south.
Lesson quiz · 5 questions
Score 60% or more to complete this lesson.
Create a free account to save your progress, take quizzes and earn a certificate.