
ELEC-210 · Lesson 5 of 12 · 30 min
Power measurement and power quality
Electricians are increasingly asked not just to install circuits but to measure what they are doing: how much power a building draws and when, whether an existing service can take a new load, why equipment trips or fails, and whether a customer is paying penalties for demand or power factor. This lesson covers how real power is measured in single-phase and three-phase circuits, how utility meters measure energy and demand, how load studies support code decisions on adding load, the main types of power quality disturbances, and how to set up a power quality analyzer safely and interpret what it records.
Measuring real power
Real power is the average of instantaneous voltage times current (Lesson 4). A wattmeter, or the power function of a digital meter, measures it by sampling voltage and current simultaneously and averaging their product, which automatically accounts for phase angle and harmonics. Multiplying an RMS voltage reading by an RMS current reading gives apparent power in VA, not watts, unless the load is purely resistive.
A wattmeter has a voltage circuit, connected across the load, and a current circuit, carrying the load current or connected through a current clamp or current transformer. Correct polarity matters: reversing the current clamp gives a negative reading, which on a three-phase system can produce badly wrong totals. Clamps are marked with an arrow pointing toward the load.
Three-phase power: Blondel's theorem
Blondel's theorem states that the total power in a system with \(N\) wires can be measured with \(N - 1\) wattmeters, each with its current circuit in one line and its voltage circuit between that line and the remaining common wire. This gives two standard methods:
- Three-phase four-wire wye systems: three wattmeters (or one meter with three voltage and three current inputs), each measuring one phase from line to neutral. Total power is the sum of the three readings, whether or not the loads are balanced.
- Three-phase three-wire systems: two wattmeters, with current coils in lines A and C and voltage coils from A to B and from C to B. Total power is the algebraic sum of the two readings, for any load, balanced or not.
With the two-wattmeter method on a balanced load, the two readings are equal only at unity power factor. As the power factor falls, one reading rises and the other falls; below 0.5 power factor, one reading becomes negative and must be subtracted. The readings also give the power factor of a balanced load:
Worked problem
Two-wattmeter method
A balanced three-phase motor load measured by the two-wattmeter method reads \(W_1 = 30\) kW and \(W_2 = 12\) kW. Find the total power and power factor.
Show solution
- Total: \(30 + 12 = 42\) kW.
- \(\tan\phi = \sqrt3 \times 18/42 = 0.742\); \(\phi = 36.6°\); PF \(= \cos 36.6° = 0.80\).
Answer: 42 kW at 0.80 power factor (apparent power 52.5 kVA). If \(W_2\) had read negative, the load would be below 0.5 power factor, as with a lightly loaded induction motor.
Modern multifunction meters and power analyzers implement these connections internally and report kW, kvar, kVA, power factor and energy per phase and in total. Their wiring configuration must be set to match the system (wye, delta, two-element or three-element), and checking that each phase shows a sensible power factor and positive power is the fastest way to catch a reversed clamp or a misassigned voltage lead.
Energy and demand metering
Utilities bill smaller customers for energy (kWh) only. Larger commercial and industrial customers are also billed for demand: the highest average power over a demand interval, typically 15 minutes (sometimes 5 or 30), during the billing period. The demand charge pays for the generation, transmission and distribution capacity reserved for the customer's peak, and it can be a third or more of the bill.
Worked problem
Demand versus energy
A building uses 120,000 kWh in a 30-day month. Its highest 15-minute average demand is 400 kW. The tariff charges $0.09 per kWh and $15 per kW of demand. Compute the bill and the load factor.
Show solution
- Energy charge: \(120{,}000 \times 0.09 = \$10{,}800\). Demand charge: \(400 \times 15 = \$6{,}000\).
- Average power: \(120{,}000/(30 \times 24) = 167\) kW. Load factor: \(167/400 = 42\%\).
Answer: A bill of $16,800, of which demand is 36%. Reducing the peak by 50 kW, for example by staggering the start-up of rooftop units after a weekend, would save $750 a month with no reduction in energy use.
Some tariffs bill demand in kVA rather than kW, or add a penalty when power factor falls below a threshold such as 0.90 (Lesson 4), which is why power factor correction can pay for itself. Time-of-use and critical peak tariffs vary energy prices by hour. Interval data from smart meters, often available to the customer, show the load profile in 15-minute or hourly steps and are the first thing to examine in any energy or capacity question.
Revenue meters on larger services are transformer-rated: current transformers (and, on higher voltages, voltage transformers) reduce the quantities to levels the meter can handle (Lesson 8). The meter multiplies its readings by the transformer ratios. Electricians install the meter base, CT cabinet and wiring to the utility's specifications, and the CT secondary must never be opened under load, because an open CT secondary develops dangerous voltages.
Load studies for adding load
Before adding a large load (an EV charging installation, a new rooftop unit, a heat pump conversion) to an existing service or feeder, the electrician must show that the service can carry it. Calculated loads based on code demand factors are often conservative; measured demand can show more spare capacity.
NEC 220.87 allows the existing load to be determined from the maximum demand over the previous year (from utility data), or, if that is not available, from a recording of the maximum power demand over at least 30 days, taken at 15-minute intervals with the building occupied and including seasonal loads, multiplied by 125%. The new load is then added to determine whether the service is adequate.
Worked problem
Can the service take EV chargers?
A 600 A, 120/208 V three-phase service has a maximum demand over the last year of 125 kW from utility data. The owner wants to add six Level 2 chargers drawing 30 A each at 208 V (6.2 kW each). Is there capacity, ignoring any load management?
Show solution
- Service capacity: \(\sqrt3 \times 208 \times 600 = 216\) kVA.
- Chargers: \(6 \times 208 \times 30 = 37.4\) kVA (single-phase loads spread across the phases).
- Total: about \(125 + 37.4 = 162\) kVA (treating the existing kW as roughly kVA at high power factor), 75% of capacity.
Answer: Yes, with margin, provided the chargers are balanced across the three phases and the existing peak was measured over a representative period. Without measured data, a calculated load might have shown no spare capacity, leading to an unnecessary service upgrade. Load management systems can permit more chargers on the same service by limiting their combined demand.
Power quality disturbances
Power quality describes how closely the supply matches an ideal sine wave of constant amplitude and frequency. Disturbances are commonly classified (following IEEE 1159) as:
| Disturbance | Description | Typical causes | Typical effects |
|---|---|---|---|
| Transient | very short spike or oscillation, microseconds to milliseconds | lightning, capacitor switching, contactor and load switching | insulation stress, electronic failures, nuisance trips |
| Sag (dip) | RMS voltage 10% to 90% of nominal for half a cycle to a minute | faults elsewhere on the system, starting large motors | drives and contactors drop out, computers reboot |
| Swell | RMS voltage above 110% for half a cycle to a minute | single-line-to-ground faults on ungrounded or impedance-grounded systems, load rejection | stress on electronics, surge protector failure |
| Interruption | voltage below 10% of nominal | faults cleared by protection, reclosers, outages | loss of operation |
| Sustained under- or overvoltage | outside the normal range for more than a minute | overloaded feeders, wrong transformer taps | overheating, poor performance |
| Unbalance | unequal phase voltages | uneven single-phase loading, open-delta banks | motor overheating |
| Harmonics | distortion at multiples of 60 Hz | nonlinear loads (Lesson 3) | heating, neutral overload |
| Flicker | rapid repeated voltage fluctuations | arc furnaces, welders, large cycling loads | visible lighting flicker |
Sags are by far the most common cause of equipment problems in industrial plants: a fault on a distant utility line, cleared in a few cycles, can drop the voltage at the plant to 60% or 70% for 100 ms, enough to trip drives and drop out contactors whose coils release below about 70% voltage. The ITIC (CBEMA) curve describes the voltage tolerance expected of information technology equipment: it should ride through any interruption up to 20 ms and sags to 70% for up to 0.5 s.
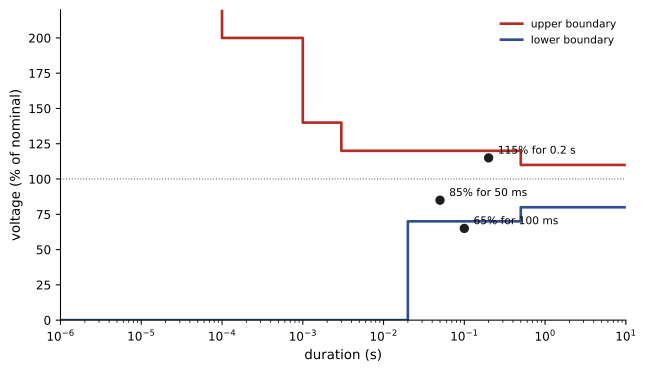
Remedies depend on the disturbance: surge protective devices at the service and at sensitive equipment for transients; ride-through settings on drives, DC-powered or held-in contactor coils, and UPSs for sags; correct transformer taps and conductor sizing for sustained voltage problems; rebalancing for unbalance; and the harmonic measures of Lesson 3. Many problems blamed on the utility originate inside the building: a large motor starting on the same feeder, a loose neutral, or an undersized transformer.
Using a power quality analyzer
A power quality analyzer records voltages and currents on all phases and the neutral over days or weeks, logging RMS trends, demand, harmonics, events (sags, swells, transients) and waveforms around each event. Good practice when installing one:
- Treat the work as energized electrical work: obtain authorization, wear the arc-rated PPE required for the location, and use test leads and clamps rated for the measurement category.
- Check the measurement category: IEC 61010 categories describe where an instrument may be connected. CAT IV covers the service entrance and utility connection, CAT III the building distribution (panels, feeders, fixed equipment), and CAT II plug-connected loads. An instrument rated CAT III 600 V may be used on a 480 V panel but not at the service entrance of a large building, where transient energy is higher.
- Connect voltage leads with fused probes or clips to a suitable point, ideally a dedicated breaker or terminal; connect current clamps with arrows toward the load, on the correct phases.
- Configure the system type, nominal voltage, CT ranges and event thresholds, then verify phasor and power readings on the analyzer screen before leaving it.
- Record for long enough to capture the weekly cycle and the problem being investigated, at least seven days where possible.
Worked problem
Reading an event log
A plant reports that its conveyor drives trip several times a month. An analyzer at the main switchboard records sags to 72% lasting 4 cycles at the times of the trips, with all three phases affected equally, and normal voltage the rest of the time. What does this suggest?
Show solution
- Balanced sags of a few cycles, coinciding with trips, suggest faults on the utility system cleared by protection, or large balanced load starts.
- If no large motor starts occurred inside the plant at those times, the source is external.
Answer: The drives are tripping on short utility sags. Practical fixes include enabling the drives' ride-through or automatic restart features, increasing DC bus capacitance, or supplying control circuits from a UPS, rather than expecting the utility to eliminate sags, which no utility can.
Common mistakes
MistakeMultiplying RMS volts by RMS amps and calling it watts.
InsteadThat is apparent power; use a wattmeter or analyzer that measures true power.
MistakeInstalling current clamps without checking direction.
InsteadPoint arrows toward the load and confirm positive power and sensible power factor on each phase.
MistakeAssuming a service is full because the calculated load says so.
InsteadUse measured maximum demand as the code permits.
MistakeUsing a meter rated below the measurement category of the location.
InsteadMatch CAT rating and voltage to the point of connection.
MistakeBlaming the utility for every disturbance.
InsteadRecord events and correlate them with internal loads before deciding.
Summary and key terms
- Real power is measured by averaging instantaneous products; RMS volts times amps gives VA.
- Blondel's theorem: three wattmeters for four-wire wye, two for three-wire systems; two-wattmeter readings also give power factor.
- Larger customers pay for energy and peak demand; load factor measures how evenly energy is used.
- Measured maximum demand can show capacity for new loads under code rules.
- Sags, swells, interruptions, transients, unbalance, harmonics and flicker have distinct causes and remedies.
- Power quality analyzers must be connected safely with the right CAT rating and configured and verified before recording.
- Wattmeter
- An instrument measuring real power.
- Blondel's theorem
- N − 1 wattmeters suffice to measure power in an N-wire system.
- Demand
- Average power over a billing interval, typically 15 minutes.
- Load factor
- Average load divided by peak demand.
- Transformer-rated meter
- A revenue meter connected through current or voltage transformers.
- Sag
- A short-duration drop in RMS voltage to between 10% and 90%.
- Swell
- A short-duration rise in RMS voltage above 110%.
- ITIC curve
- The voltage tolerance envelope expected of IT equipment.
- Power quality analyzer
- An instrument recording voltage, current, harmonics and events over time.
- Measurement category
- The IEC 61010 rating of where an instrument may be safely connected.
Practice problems
Work each problem on paper first, then reveal the answer to check.
Two-wattmeter readings 20 kW and 20 kW on a balanced load: power factor?
Show answer
1.0.
Readings 25 kW and −5 kW: total power?
Show answer
20 kW (power factor below 0.5).
How many wattmeters for a three-phase four-wire system?
Show answer
Three.
Energy 60,000 kWh in 30 days with peak 200 kW: load factor?
Show answer
\(83.3/200 = 42\%\).
Demand charge for 350 kW at $12/kW?
Show answer
$4,200.
Capacity of a 400 A, 120/208 V three-phase service?
Show answer
144 kVA.
Why must a CT secondary never be opened under load?
Show answer
It develops dangerously high voltage.
A 75% sag for 0.3 s: within the ITIC curve?
Show answer
Yes (70% is tolerated up to 0.5 s).
Which CAT rating is required at a service entrance?
Show answer
CAT IV.
Minimum recommended recording period for a power quality study?
Show answer
About a week.
Lesson quiz · 5 questions
Score 60% or more to complete this lesson.
Create a free account to save your progress, take quizzes and earn a certificate.