
ECON-101 · Lesson 6 of 12 · 31 min
Markets and government: price controls and taxes
Governments intervene in markets in many ways. They cap rents, set minimum wages, tax gasoline, alcohol and tobacco, collect sales taxes on most purchases, and impose tariffs on imports. These policies usually have worthy aims: making housing affordable, raising the incomes of low-paid workers, discouraging harmful consumption or raising revenue for public services. The supply and demand model, combined with the surplus tools of lesson 5, lets us predict their effects, including effects their designers may not intend. This lesson analyses price ceilings, price floors, taxes and tariffs. It is not an argument for or against any particular policy; it is a toolkit for understanding the trade-offs, together with the evidence on how these policies work in practice.
Price ceilings
A price ceiling is a legal maximum price. If the ceiling is set above the equilibrium price, it has no effect; it is not binding. If it is set below equilibrium, it is binding: at the ceiling price, quantity demanded exceeds quantity supplied, and a shortage results. Because the price cannot rise to ration the good, some other mechanism must decide who gets it: waiting lines, first come first served, personal connections, discrimination by sellers, or black markets in which the good is resold illegally at higher prices. Sellers may also reduce quality, since they cannot raise the price and buyers are queuing anyway.
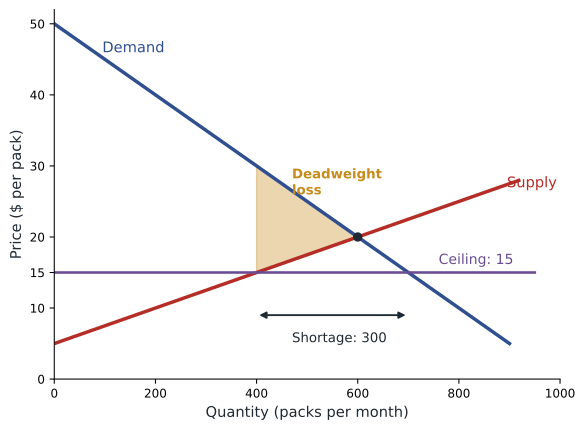
A binding ceiling also creates a deadweight loss. The quantity traded falls from the equilibrium quantity to the smaller quantity that sellers are willing to supply at the ceiling price, so trades that would have benefited both sides do not happen. Some surplus is transferred from sellers to the buyers lucky enough to obtain the good at the low price, but total surplus falls. And if the scarce supply is not allocated to the buyers who value it most, the loss is larger still.
Worked problem
A binding price ceiling
In a market for a medication, demand is \( Q_d = 1{,}000 - 20P \) and supply is \( Q_s = -200 + 40P \), with P in dollars and Q in packs per month. A ceiling of $15 is imposed. Find the equilibrium without the ceiling, the shortage under the ceiling, and the deadweight loss.
Show solution
- Equilibrium: 1,000 − 20P = −200 + 40P, so P = $20 and Q = 600.
- At $15: \( Q_d = 700 \) and \( Q_s = 400 \), a shortage of 300 packs.
- Buyers' willingness to pay for the 400th pack: from demand, P = (1,000 − 400) ÷ 20 = $30.
- Deadweight loss = ½ × (600 − 400) × ($30 − $15) = $1,500 per month.
Answer: The ceiling causes a shortage of 300 packs and a deadweight loss of $1,500 a month, assuming the 400 packs go to the buyers who value them most. If they are allocated randomly, the loss is larger.
Rent control
Rent control is the most widely debated price ceiling. Economists distinguish first-generation rent control, which freezes rents below market levels, from second-generation rent stabilization, which limits how much rents can rise for sitting tenants, usually allows increases tied to inflation and often exempts new buildings. In the short run, the supply of rental housing is very inelastic, so rent limits mainly transfer income from landlords to tenants with little immediate loss of units. In the long run, supply is more elastic: controls can discourage the construction of new rental buildings, encourage owners to convert units to condominiums or short-term rentals, and reduce spending on maintenance. Controls also reduce mobility, because tenants paying below-market rents are reluctant to move even when their needs change.
In the United States, rent regulation is set by states and cities. New York City's rent stabilization covers roughly one million apartments, with annual increases set by a rent guidelines board. Oregon became the first state to adopt statewide rent stabilization in 2019, limiting annual increases to 7 % plus inflation (capped at 10 %) with an exemption for buildings less than 15 years old; California's Tenant Protection Act of 2019 limits increases to 5 % plus inflation (capped at 10 %) for many older units. Many states, including Texas and Florida, prohibit local rent control. Supporters argue that these limits protect tenants from sudden increases and displacement in tight markets; critics argue that they discourage rental construction and maintenance, and that the real problem is too little supply.
The empirical evidence supports parts of both views. A widely cited study by Rebecca Diamond, Tim McQuade and Franklin Qian of San Francisco's 1994 expansion of rent control found that tenants in newly controlled buildings were substantially more likely to stay in their homes, as intended, but that landlords of those buildings reduced the supply of rental housing by about 15 %, through conversions and redevelopment, which pushed up market rents citywide. Studies of Cambridge, Massachusetts, after rent control was abolished in 1995 found increases in property values and investment. Evidence on milder second-generation stabilization with new-construction exemptions suggests smaller supply effects. Most economists favor expanding supply as the main route to affordability, sometimes combined with targeted housing allowances for low-income renters; tenant advocates often favor rent stabilization as protection while supply catches up.
Price floors and the minimum wage
A price floor is a legal minimum price. If it is set above equilibrium, it is binding, and quantity supplied exceeds quantity demanded, creating a surplus. Agricultural price supports have historically created surpluses that governments had to buy, store or export. The most important price floor in modern economies is the minimum wage, a floor on the price of labor. In the simple competitive model, a binding minimum wage raises the wage for workers who keep their jobs but reduces the quantity of labor demanded, causing some unemployment, especially among less experienced workers whose productivity is closest to the minimum.
The US federal minimum wage has been $7.25 an hour since July 2009, and 20 states use the federal rate as their minimum. Most other states set higher minimums, and many index them to inflation. As of July 2026, the District of Columbia's minimum was $18.40, Washington's $17.13, California's $16.90 and New York's $17.00 in New York City and its suburbs; many cities, such as Seattle and Denver, set still higher local minimums. The large differences between states provide natural experiments that economists use to study the effects of minimum wages.
The evidence on minimum wage effects is one of the most studied questions in economics. In 1994, David Card and Alan Krueger compared fast-food employment in New Jersey, which raised its minimum wage, with neighboring Pennsylvania, which did not, and found no reduction in employment in New Jersey; Card later shared the 2021 Nobel Prize partly for this work. Their findings were challenged by David Neumark and William Wascher, who found negative effects using other data. More recent studies using many state increases, such as work by Doruk Cengiz, Arindrajit Dube and colleagues, find that moderate increases have had little effect on the number of low-wage jobs while raising earnings, whereas studies of Seattle's rise toward $15 found a reduction in hours worked by low-wage workers. Canadian studies have tended to find modest negative effects on teen employment.
One explanation for small job losses is monopsony, a market with a single or dominant buyer of labor, examined in lesson 12. When employers have wage-setting power, a moderate minimum wage can raise both wages and employment, up to a point. A reasonable summary of current evidence is that moderate minimum wage increases raise earnings for low-wage workers with small employment effects, while very large increases relative to local median wages carry a greater risk of job losses; economists continue to disagree about where that threshold lies.
Taxes
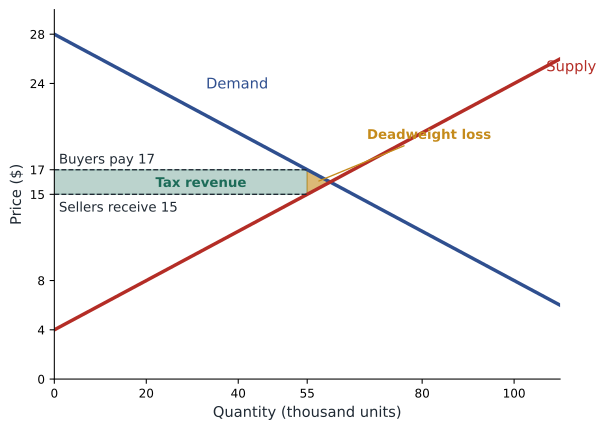
When a government taxes a good, it drives a wedge between the price buyers pay and the price sellers receive. Whether the tax is legally levied on buyers or sellers makes no difference to the outcome: in either case, the price buyers pay rises, the price sellers receive falls, and the quantity traded falls. As lesson 4 showed, the burden is shared according to elasticities, with the less elastic side bearing more. The government collects revenue equal to the tax per unit times the quantity sold after the tax. The fall in quantity creates a deadweight loss, because some trades worth more to buyers than they cost sellers no longer happen.
Worked problem
Incidence and deadweight loss of an excise tax
In a market where demand is \( Q_d = 140 - 5P \) and supply is \( Q_s = -20 + 5P \) (thousand units, dollars), the government imposes a tax of $2 per unit. Find the new quantity, the price buyers pay, the price sellers receive, tax revenue and deadweight loss.
Show solution
- With the tax, buyers pay \( P_b \) and sellers receive \( P_s = P_b - 2 \).
- Set \( 140 - 5P_b = -20 + 5(P_b - 2) \): \( 170 = 10P_b \), so \( P_b = 17 \) and \( P_s = 15 \).
- Quantity: \( 140 - 5(17) = 55 \) thousand units (down from 60).
- Revenue: $2 × 55,000 = $110,000.
- Deadweight loss: ½ × $2 × (60,000 − 55,000) = $5,000.
Answer: Buyers pay $1 more and sellers receive $1 less, an equal split because the curves have equal slopes. The government collects $110,000, and $5,000 of surplus is lost entirely.
Deadweight loss grows with the square of the tax. Doubling the tax doubles the wedge and roughly doubles the fall in quantity, so the deadweight-loss triangle, whose area depends on both, roughly quadruples. This is why economists generally prefer broad taxes at low rates to narrow taxes at high rates: a broad-based sales tax or income tax raises a given amount of revenue with less distortion than very high taxes on a few goods. Deadweight loss is also larger when supply and demand are more elastic, because quantity responds more to the tax.
# Revenue and deadweight loss as a per-unit tax rises (linear market from the example)
a, b, c, d = 140, 5, -20, 5
q0 = a - b * (a - c) / (b + d)
print(" tax  quantity  revenue($000)  DWL($000)")
for t in [0, 2, 4, 6, 8, 10, 12, 14, 16]:
    pb = (a - c + d * t) / (b + d)       # price buyers pay
    q = max(a - b * pb, 0)
    revenue = t * q
    dwl = 0.5 * t * (q0 - q)
print(f"{t:4} {q:8.1f} {revenue:13.1f} {dwl:9.1f}")tax quantity revenue($000) DWL($000) 0 60.0 0.0 0.0 2 55.0 110.0 5.0 4 50.0 200.0 20.0 6 45.0 270.0 45.0 8 40.0 320.0 80.0 10 35.0 350.0 125.0 12 30.0 360.0 180.0 14 25.0 350.0 245.0 16 20.0 320.0 320.0
The table illustrates a Laffer-curve pattern for a single market: revenue rises with the tax at first, peaks at a tax of $12 in this example, and would then fall, while deadweight loss rises ever faster. Real tax systems are more complex, but the lesson is general: high tax rates on a narrow base raise little extra revenue at a high cost in lost surplus.
Sales and excise taxes in practice
The United States has no national sales tax. Forty-five states and the District of Columbia levy general sales taxes, with state rates ranging up to about 7 % and combined state and local rates exceeding 9 % in some places; Alaska, Delaware, Montana, New Hampshire and Oregon have no statewide sales tax. Prices are usually displayed before tax. Federal and state governments levy excise taxes on gasoline, diesel, alcohol and tobacco; the federal gasoline tax has been 18.4 cents per gallon since 1993. There is no federal carbon price, though California and the northeastern states of the Regional Greenhouse Gas Initiative operate cap-and-trade systems that put a price on emissions from covered sources.
Taxes on goods with harmful side effects, such as tobacco, alcohol and carbon emissions, are sometimes called corrective or Pigouvian taxes, after the economist Arthur Pigou. Unlike ordinary taxes, they may improve efficiency rather than reduce it, because they make buyers and sellers take account of costs they would otherwise ignore. Lesson 12 develops this idea.
Tariffs revisited
A tariff is a tax on imports, and the same tools apply. Consider a small country that can import a good at a world price below its domestic equilibrium price. Under free trade, domestic consumers buy at the world price, domestic producers supply what they can profitably make at that price, and imports fill the gap. A tariff raises the domestic price by the amount of the tariff. Consumers lose surplus, domestic producers gain surplus, and the government gains tariff revenue, but two deadweight-loss triangles appear: one because domestic producers with costs above the world price now produce (a production inefficiency), and one because consumers who valued the good above the world price but below the tariff-inclusive price stop buying (a consumption inefficiency). This is the formal basis for the conclusion in lesson 2 that tariffs usually reduce total welfare.
Worked problem
Deadweight loss of a tariff
A small country imports a good at a world price of $10. At $10, domestic demand is 1,000 units and domestic supply is 400. A $2 tariff raises the domestic price to $12, at which demand is 900 and domestic supply is 500. Calculate the change in consumer surplus, producer surplus, tariff revenue and the deadweight loss.
Show solution
- Consumer surplus falls by ½ × (1,000 + 900) × $2 = $1,900.
- Producer surplus rises by ½ × (400 + 500) × $2 = $900.
- Imports fall from 600 to 400; tariff revenue = 400 × $2 = $800.
- Deadweight loss = $1,900 − $900 − $800 = $200 (two triangles of $100 each).
Answer: Consumers lose $1,900, of which $900 goes to producers and $800 to the government; $200 is lost entirely.
Common mistakes
MistakeA price ceiling always lowers the price buyers effectively pay.
InsteadWaiting, search costs, lower quality and black-market prices can raise the effective cost for many buyers.
MistakeA tax collected from sellers is paid by sellers.
InsteadThe burden depends on elasticities, not on who remits the tax.
MistakeDoubling a tax doubles its deadweight loss.
InsteadDeadweight loss rises roughly with the square of the tax, so doubling it roughly quadruples the loss.
MistakeAll economists agree that minimum wages destroy many jobs.
InsteadEvidence suggests moderate increases have small employment effects; larger increases carry more risk, and economists disagree on the threshold.
MistakeRent control has no effect on housing supply.
InsteadIn the long run, strict controls can reduce rental supply and maintenance, though milder stabilization with new-construction exemptions has smaller effects.
Summary and key terms
- A binding price ceiling (below equilibrium) causes shortages, non-price rationing and deadweight loss.
- Rent control mainly transfers income in the short run; long-run supply effects depend on design and are documented in strict regimes.
- A binding price floor (above equilibrium) causes surpluses; the minimum wage is the key example.
- Evidence suggests moderate minimum wage increases raise earnings with small employment effects; monopsony helps explain why.
- A tax creates a wedge between buyer and seller prices; incidence depends on elasticities, not on who remits.
- Deadweight loss rises roughly with the square of the tax and with elasticities, favoring broad bases and low rates.
- Corrective taxes on harmful activities can improve efficiency.
- Tariffs transfer surplus from consumers to producers and the government and create two deadweight-loss triangles.
- Price ceiling
- A legal maximum price.
- Price floor
- A legal minimum price.
- Binding
- A price control that prevents the market from reaching equilibrium.
- Black market
- Illegal trade at prices above a legal ceiling.
- Rent stabilization
- Limits on annual rent increases for sitting tenants, often tied to inflation.
- Minimum wage
- A legal minimum hourly wage.
- Tax wedge
- The difference between the price buyers pay and the price sellers receive because of a tax.
- Tax incidence
- The distribution of a tax burden between buyers and sellers.
- Pigouvian tax
- A tax designed to correct a negative externality.
- Laffer curve
- The relationship showing that tax revenue first rises and then falls as the tax rate increases.
Practice problems
Work each problem on paper first, then reveal the answer to check.
Why does a price ceiling above equilibrium have no effect?
Show answer
The market price is already below it, so it does not bind.
Name three ways goods are rationed under a binding ceiling.
Show answer
Queues, first come first served, personal connections, discrimination or black markets.
Why are rent control effects larger in the long run?
Show answer
Rental supply is more elastic in the long run, so construction and maintenance respond.
What did Card and Krueger find?
Show answer
No reduction in fast-food employment in New Jersey after its minimum wage increase.
Demand \( Q_d = 100 - 2P \), supply \( Q_s = 3P \). Find equilibrium.
Show answer
P = 20, Q = 60.
In the previous market, a $5 tax is imposed. Find buyer and seller prices.
Show answer
100 − 2Pb = 3(Pb − 5) gives Pb = 23, Ps = 18, Q = 54.
Deadweight loss in the previous question?
Show answer
½ × $5 × 6 = $15.
Why do economists prefer broad tax bases?
Show answer
Deadweight loss rises with the square of the rate, so low rates on broad bases distort less.
Who gains from a tariff?
Show answer
Domestic producers and the government.
Portfolio task: find your province's or state's current minimum wage and a local living wage estimate, and discuss the gap using this lesson's tools.
Show answer
Answers vary; should identify the floor and discuss likely effects.
Lesson quiz · 5 questions
Score 60% or more to complete this lesson.
Create a free account to save your progress, take quizzes and earn a certificate.