
ECON-101 · Lesson 1 of 12 · 33 min
Thinking like an economist
Economics is the study of how people, businesses and governments make choices when resources are scarce. Every day, a student decides whether to spend an evening studying or working a shift, a coffee shop decides how many baristas to schedule, and a government decides whether to spend more on health care or on roads. None of these choices can give everyone everything they want, because time, money, land, workers, machines and raw materials are limited. Economics offers a way of thinking about such choices that is surprisingly powerful. This course covers microeconomics, the study of individual decision makers and markets: households, firms, industries and the prices that connect them. Its companion course, ECON-102, covers macroeconomics: national output, unemployment, inflation, money, interest rates and government budgets. BUS-101 lesson 5 introduced markets and the business cycle from a manager's point of view; here we build the tools economists use to analyze them.
Scarcity and choice
Scarcity means that our wants exceed the resources available to satisfy them. It is not the same as poverty. A billionaire still faces scarcity, because she has only 24 hours in a day and cannot be in two places at once. A rich country still faces scarcity, because land used for a new hospital cannot also be used for housing. Because resources are scarce, every society must answer three basic questions: what goods and services to produce, how to produce them, and for whom. Different economic systems answer these questions in different ways. In a market economy, most of the answers emerge from the decisions of millions of buyers and sellers interacting through prices. In a command economy, a central authority makes most of the decisions. Canada and the United States, like almost all real economies, are mixed economies: markets coordinate most production, but governments provide some goods directly, regulate many markets, redistribute income and set the legal rules within which markets work.
Economists group productive resources into four factors of production. Land includes all natural resources: farmland, forests, minerals, water and the radio spectrum. Labor is the time and effort of people, including their skills, which economists call human capital. Capital is the stock of produced goods used to make other goods, such as machines, buildings, software and trucks; note that in economics capital means physical and intangible productive assets, not money. Entrepreneurship is the initiative to combine the other factors, take risks and innovate. Each factor earns an income: land earns rent, labor earns wages, capital earns interest, and entrepreneurs earn profit.
Opportunity cost
Because choosing one thing means giving up another, every choice has a cost. The opportunity cost of an action is the value of the best alternative forgone. If you spend Saturday afternoon at a hockey game rather than working a four-hour shift at $18 an hour, the opportunity cost includes not only the ticket price but also the $72 in wages you did not earn, or, if you would not have worked, whatever else you would most have liked to do with the time. Opportunity cost is the most important cost concept in economics, and it is often different from the accounting cost recorded on a receipt.
Consider the cost of a university degree. The obvious costs are tuition, books and fees. But room and board are not really a cost of attending, because you would need to eat and live somewhere anyway, unless studying forces you to pay more than you otherwise would. The largest cost for many students is the income they give up by studying rather than working full time. This explains why the opportunity cost of education is higher for people with high-paying alternatives. A professional athlete who could earn millions by turning professional at 19 faces a far larger opportunity cost of attending university than most students do, which is one reason why many such athletes delay or skip university.
Worked problem
Opportunity cost of a degree year
Maya is deciding whether to spend a year in full-time study. Tuition and fees are $8,500, books cost $1,200, and her rent and food will cost $14,000 whether or not she studies. If she does not study she can work full time and earn $38,000 after tax. What is her opportunity cost of the year of study?
Show solution
- Count only costs that depend on the decision: tuition and fees ($8,500) and books ($1,200).
- Exclude rent and food, because she pays them either way.
- Add the forgone after-tax earnings of $38,000.
- Total: $8,500 + $1,200 + $38,000 = $47,700.
Answer: The opportunity cost is $47,700, of which about 80 % is forgone earnings. Whether the year is worth it depends on the extra lifetime earnings and other benefits the education brings, which BUS-110 lesson 2 would evaluate with present value tools.
Thinking at the margin
Economists stress that most decisions are not all-or-nothing. A business does not decide whether to produce anything at all; it decides whether to produce a little more or a little less. A student does not decide whether to study or never study; she decides whether to study one more hour tonight. The word marginal means additional or incremental. Marginal benefit is the extra benefit from one more unit of an activity, and marginal cost is the extra cost. A rational decision maker continues an activity as long as the marginal benefit exceeds the marginal cost and stops where they are equal.
Marginal thinking resolves puzzles. Why is water, which is essential to life, so cheap, while diamonds, which are not, are so expensive? This is the diamond–water paradox that puzzled Adam Smith. The answer is that prices reflect marginal value, not total value. The total benefit of water is enormous, but water is so plentiful that the benefit of one more liter is tiny. Diamonds are scarce, so the marginal diamond is highly valued. Similarly, an airline that has already scheduled a flight may sell a last-minute seat for far less than the average cost per seat, because the marginal cost of one more passenger on a plane that is flying anyway is only a snack and a little fuel.
A closely related idea is that sunk costs should not affect decisions. A sunk cost is a cost that has already been incurred and cannot be recovered. If you paid $60 for a concert ticket and then feel sick on the night, the $60 is gone whether or not you attend; the decision should depend only on whether going will make you better off than staying home. Firms make the same error when they keep pouring money into a failing project because they have already spent so much, a pattern BUS-130 discussed as escalation of commitment.
# Marginal benefit and marginal cost of hours of study before an exam
# Marks gained from each extra hour fall; the value of the next best use of time rises.
marks_gained = [9, 7, 5, 4, 3, 2, 1]          # extra marks from hour 1, 2, ...
value_per_mark = 6.0                          # $ value a student places on one extra mark
cost_of_hour = [12, 14, 18, 22, 26, 30, 35]   # value of the next best use of each hour, $
best = 0
for h, (m, c) in enumerate(zip(marks_gained, cost_of_hour), start=1):
    mb = m * value_per_mark
    decision = "study" if mb >= c else "stop"
    if decision == "study":
        best = h
    print(f"hour {h}: MB = ${mb:5.1f}  MC = ${c:4.1f}  -> {decision}")
print("best number of hours:", best)hour 1: MB = $ 54.0 MC = $12.0 -> study hour 2: MB = $ 42.0 MC = $14.0 -> study hour 3: MB = $ 30.0 MC = $18.0 -> study hour 4: MB = $ 24.0 MC = $22.0 -> study hour 5: MB = $ 18.0 MC = $26.0 -> stop hour 6: MB = $ 12.0 MC = $30.0 -> stop hour 7: MB = $ 6.0 MC = $35.0 -> stop best number of hours: 4
The output shows the logic of the margin. The first hour brings marks worth $54 and costs only $12 of forgone alternatives, so it is clearly worth it. By the fourth hour, the extra marks are worth $24 against a cost of $22, still just worth it. The fifth hour brings $18 of benefit at a cost of $26, so the student should stop after four hours. Note that the decision does not depend on the total benefit of studying, only on the comparison at the margin.
People respond to incentives
An incentive is a reward or penalty that motivates behavior. Because people compare marginal benefits and costs, changing those benefits and costs changes behavior. When the price of gasoline rises, people drive less, carpool more and, over time, buy more fuel-efficient vehicles. When a city introduces congestion charges, traffic falls at peak times. When governments subsidize home insulation, more people insulate. Incentives can also have unintended consequences. A famous example is the cobra effect: a colonial government that paid a bounty for dead cobras is said to have found that people began breeding cobras to collect the reward. More practically, a rule that requires vehicles to be more fuel-efficient may lead people to drive more, because each kilometer is now cheaper, offsetting part of the fuel savings. Economists call this the rebound effect.
Economic models and the scientific method
Economists study the world by building models: simplified representations of reality that focus on the features that matter for a particular question. A road map leaves out trees and houses because it is designed to help you navigate; a model of the market for apartments leaves out the color of the walls because it is designed to explain rents. Models rely on assumptions. A common one is ceteris paribus, Latin for other things being equal: when we study how the price of coffee affects the quantity people buy, we hold constant income, the prices of tea and other goods, and tastes. Good models are judged by how well they predict and explain, not by whether every assumption is literally true.
Like other sciences, economics tests its models against data. Economists use statistics from agencies such as Statistics Canada and the US Bureau of Labor Statistics, run laboratory and field experiments, and study natural experiments, situations where a policy change affects some people but not others in a way that mimics random assignment. Correlation is not causation: if neighborhoods with more police have more crime, it is probably because police are sent to high-crime areas, not because police cause crime. Much of modern empirical economics is about finding credible ways to separate cause from correlation.
Positive and normative economics
It helps to distinguish two kinds of statements. Positive statements describe how the world is and can, in principle, be tested with evidence: 'raising the minimum wage to $20 would reduce employment of teenagers by 3 %' is positive, even if it turns out to be wrong. Normative statements describe how the world should be and involve value judgments: 'the government should raise the minimum wage' is normative. Economists often agree on positive questions while disagreeing on normative ones, because they weigh outcomes such as efficiency, fairness and freedom differently. When you read economic commentary, it is useful to ask which parts are claims about facts and which are claims about values.
| Statement | Type | Why |
|---|---|---|
| Rent control reduces the supply of rental housing over time | Positive | A testable claim about cause and effect |
| Rent control is unfair to landlords | Normative | A judgment about fairness |
| A carbon price of $50 per metric ton raises gasoline prices by about 11 cents per liter | Positive | A calculation that can be checked |
| Governments should price carbon | Normative | A policy recommendation that depends on values |
| Free trade raises average incomes in both trading countries | Positive | A testable claim, broadly supported by evidence |
| Free trade agreements should protect domestic dairy farmers | Normative | A choice about whose interests to weigh |
Graphs in economics
Economists use graphs constantly, so it is worth being comfortable with them. A graph shows the relationship between two variables. When two variables move in the same direction, such as the price of a good and the quantity producers want to sell, the relationship is positive and the line slopes upward. When they move in opposite directions, such as price and the quantity buyers want, the relationship is negative and the line slopes downward. The slope of a straight line is the change in the vertical variable divided by the change in the horizontal variable, the rise over the run.
An important convention: in supply and demand diagrams, economists put price on the vertical axis and quantity on the horizontal axis, even though we usually think of quantity as depending on price. This convention dates back to Alfred Marshall in the 1890s, and it can confuse students who learned in mathematics to put the dependent variable on the vertical axis. Another trap is confusing a movement along a curve with a shift of the whole curve. If the graph shows how quantity demanded depends on price, a change in price moves us along the curve, while a change in anything else that affects demand, such as income, shifts the entire curve. Lesson 3 develops this distinction carefully.
The production possibilities frontier
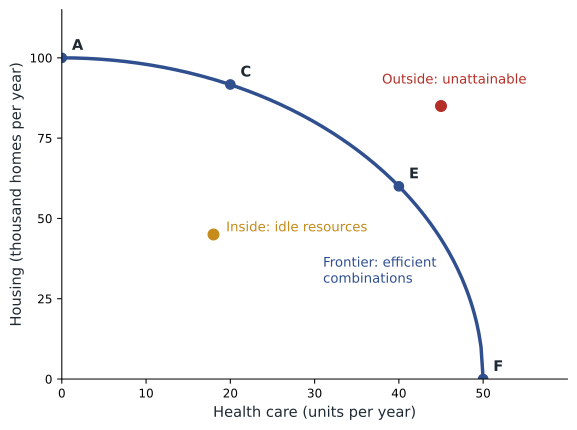
One of the simplest economic models is the production possibilities frontier (PPF), which shows the combinations of two goods an economy can produce with its available resources and technology. Imagine an economy that produces only health care and housing. If it devotes all its resources to housing, it can build a certain number of homes; if it devotes all to health care, it can provide a certain amount of care; in between are many combinations. The PPF illustrates scarcity (points outside the curve are unattainable), efficiency (points on the curve use resources fully), inefficiency (points inside the curve mean idle or misused resources, such as unemployed workers during a recession) and opportunity cost (moving along the curve means giving up some of one good to get more of the other).
The PPF is usually bowed outward, meaning that the opportunity cost of a good rises as we produce more of it. The reason is that resources are not equally suited to all uses. When the economy first shifts resources from housing to health care, it moves the workers and buildings best suited to health care, say, those with medical training, and gives up relatively little housing. As it continues, it must move construction workers and equipment that are much less useful in hospitals, so each extra unit of health care costs more and more housing. This is called the law of increasing opportunity cost.
Worked problem
Reading opportunity cost from a PPF
A small economy can produce the following combinations per year: A (0 care units, 100 homes), B (10, 95), C (20, 85), D (30, 70), E (40, 50), F (50, 0). What is the opportunity cost of the 11th to 20th units of care, and of the 41st to 50th units?
Show solution
- Moving from B to C raises care from 10 to 20 and lowers homes from 95 to 85: 10 homes for 10 care units, or 1 home per unit.
- Moving from E to F raises care from 40 to 50 and lowers homes from 50 to 0: 50 homes for 10 care units, or 5 homes per unit.
- The opportunity cost per unit of care rises from 1 home to 5 homes as more care is produced.
Answer: The opportunity cost rises from 1 to 5 homes per unit of care, illustrating the law of increasing opportunity cost and the bowed-out shape of the frontier.
The PPF can shift. Economic growth shifts it outward: more workers, more capital, better education or new technology let the economy produce more of both goods. A technology that affects only one good, such as a breakthrough in modular construction, shifts the frontier outward mainly along the housing axis. Natural disasters, wars and the loss of skilled workers can shift it inward. A society that chooses to produce more capital goods today, such as factories and research, rather than consumer goods, sacrifices current consumption but shifts its future PPF further outward. This is one way to see why investment matters for long-run living standards, a theme ECON-102 develops.
Why economists disagree, and why they often agree
The joke that if you laid all economists end to end they would not reach a conclusion is popular, but it overstates disagreement. Surveys of economists, such as the Clark Center's panels at the University of Chicago, find broad agreement on many positive questions: that tariffs usually reduce overall economic welfare, that price controls on rents tend to reduce the quantity and quality of rental housing, and that carbon pricing is a cost-effective way to cut emissions. Disagreement is more common on questions where the evidence is still developing, such as the size of the employment effects of moderate minimum wage increases, and on normative questions about how to weigh efficiency against fairness. Throughout this course, we will try to present the evidence and the main positions fairly and leave the normative judgments to you.
Common mistakes
MistakeThe cost of going to university is tuition plus room and board.
InsteadThe opportunity cost is tuition, books and fees plus forgone earnings; room and board count only to the extent they exceed what you would spend anyway.
MistakeA rational person should finish a project once a lot of money has been spent on it.
InsteadMoney already spent is a sunk cost; continue only if the remaining marginal benefits exceed the remaining marginal costs.
MistakeScarcity only affects poor people and poor countries.
InsteadScarcity affects everyone, because time and resources are always limited relative to wants.
MistakeA model with unrealistic assumptions is useless.
InsteadModels are judged by how well they explain and predict the question at hand, not by whether every assumption is literally true.
MistakeCapital means money in economics.
InsteadCapital means produced means of production such as machines, buildings and software; money is a financial asset.
Summary and key terms
- Economics studies choices under scarcity; microeconomics focuses on households, firms and markets, and macroeconomics on the economy as a whole.
- The four factors of production are land, labor, capital and entrepreneurship.
- Opportunity cost, the value of the best alternative forgone, is the true cost of any choice.
- Rational decisions compare marginal benefit with marginal cost and ignore sunk costs.
- People respond to incentives, sometimes in unintended ways.
- Models simplify reality using assumptions such as ceteris paribus and are tested against evidence.
- Positive statements are testable claims about facts; normative statements involve value judgments.
- The production possibilities frontier illustrates scarcity, efficiency, opportunity cost and growth.
- Scarcity
- The condition in which wants exceed the resources available to satisfy them.
- Opportunity cost
- The value of the best alternative given up when making a choice.
- Marginal benefit
- The additional benefit from one more unit of an activity.
- Marginal cost
- The additional cost of one more unit of an activity.
- Sunk cost
- A cost already incurred that cannot be recovered and should not affect future decisions.
- Incentive
- A reward or penalty that motivates behavior.
- Ceteris paribus
- Holding all other relevant factors constant.
- Positive statement
- A statement about what is, which can be tested with evidence.
- Normative statement
- A statement about what ought to be, involving value judgments.
- Production possibilities frontier
- A curve showing the maximum combinations of two goods an economy can produce with its resources and technology.
Practice problems
Work each problem on paper first, then reveal the answer to check.
Define scarcity and explain why it applies to rich people.
Show answer
Wants exceed resources; even rich people have limited time and face trade-offs.
You skip a $90 shift to attend a free lecture. What is the opportunity cost?
Show answer
At least $90 of forgone wages, or the value of your best alternative if higher.
Why should sunk costs be ignored?
Show answer
They cannot be recovered whatever you decide, so they do not change the marginal comparison.
An airline sells a last-minute seat for $79 when the average cost per seat is $220. Is this rational?
Show answer
Yes, if the marginal cost of carrying one more passenger is below $79.
Classify: "Canada should cut income taxes."
Show answer
Normative.
Classify: "Cutting income taxes would raise labor force participation by 1 %."
Show answer
Positive.
What does a point inside the PPF represent?
Show answer
An inefficient use of resources, such as unemployment.
Why is the PPF usually bowed outward?
Show answer
Resources are not equally suited to all uses, so opportunity cost rises as production of one good increases.
Give one example of an incentive with an unintended consequence.
Show answer
The rebound effect of fuel efficiency standards, or bounties that encourage breeding pests.
Portfolio task: list three decisions you made this week and identify the opportunity cost and the marginal comparison in each.
Show answer
Answers vary; each should name the best forgone alternative and a marginal benefit and cost.
Lesson quiz · 5 questions
Score 60% or more to complete this lesson.
Create a free account to save your progress, take quizzes and earn a certificate.