
DCE-450 · Lesson 7 of 12 · 25 min
Reliability modeling: block diagrams, fault trees and simulation
The formulas of Lesson 6 handle simple series and parallel arrangements, but a real data center is a web of switchgear, transfer schemes, redundant cooling, controls and shared utilities. To understand it, reliability engineers build models. Each modeling method answers a slightly different question: reliability block diagrams show how components combine; fault trees work backwards from a specific undesired event to its causes; failure modes and effects analysis works forwards from each component's possible failures; Markov models capture repair, standby and switching behavior; and Monte Carlo simulation handles almost anything by simulating years of operation. This lesson introduces each method, shows when to use it, and works through a small model with more than one method to show that they agree.
Reliability block diagrams
A reliability block diagram (RBD) draws the system as blocks connected in series and parallel according to how their failures affect the function, not according to the physical layout. For a rack fed by two independent power paths, each path is a series string of utility or generator source, switchgear, UPS and PDU, and the two strings are drawn in parallel, joining at the dual-corded server power supplies. Parallel groups with k-of-n redundancy are drawn as a single block with a k/n label.
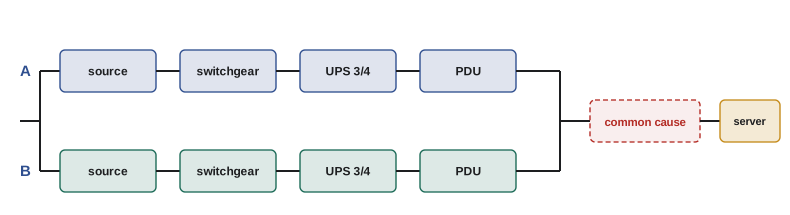
The RBD is evaluated by reducing it step by step: series blocks multiply availabilities, parallel blocks combine as 1 − (1 − A₁)(1 − A₂), and k-of-n blocks use the binomial sum. A common-cause block is drawn in series with the whole redundant arrangement, which makes visible how it bypasses the redundancy. RBDs are quick to build and easy to explain, but they assume independent blocks and do not show sequence or timing, such as a transfer switch that must operate at the moment of a failure.
Fault tree analysis
Fault tree analysis (FTA) starts from a top event, such as "loss of power to a critical rack" or "loss of cooling to data hall 2", and works downwards, asking what combinations of lower-level events could cause it. Events are connected by logic gates: an AND gate means all inputs must occur; an OR gate means any input is enough. The tree continues downwards until it reaches basic events, such as a component failure or a human error, whose probabilities can be estimated.
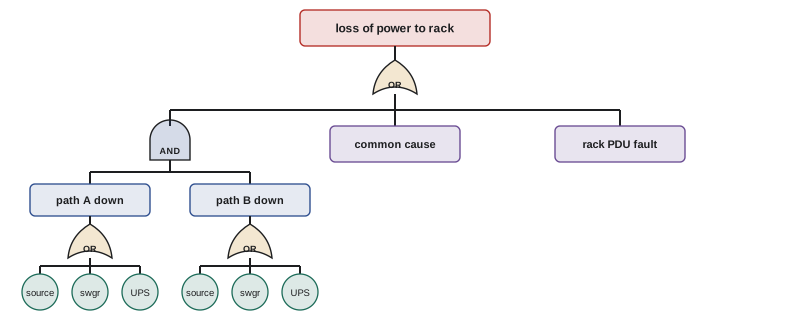
A key output of FTA is the list of minimal cut sets: the smallest combinations of basic events that cause the top event. A single-event cut set is a single point of failure; a two-event cut set requires two simultaneous failures, and so on. For independent rare events, the probability of a cut set is the product of its event probabilities, and the top event probability is approximately the sum over cut sets. Ranking cut sets by probability shows where improvement effort should go.
FTA is ideal for investigating a specific outcome the owner fears, and it handles human errors and external events naturally as basic events. It is less convenient for systems with repair and time-dependent behavior.
Failure modes and effects analysis
Failure modes and effects analysis (FMEA) works in the opposite direction. For each component, the team lists its possible failure modes (a breaker fails to open, fails to close, or trips spuriously; a valve sticks open or closed; a sensor reads high, low or frozen), then the local and system effects of each mode, how it would be detected and what safeguards exist. In its criticality version (FMECA), each failure mode is scored for severity, occurrence and detection, often multiplied into a risk priority number to rank the items.
| Component | Failure mode | Effect | Detection | Safeguard |
|---|---|---|---|---|
| Static transfer switch | Fails to transfer on source loss | Loss of power to downstream PDU | STS self-diagnostics, EPMS alarm | Dual-corded IT on second path |
| Chilled water valve | Fails closed | Loss of cooling to one CRAH | Supply air temperature alarm | Adjacent CRAHs speed up (N+1) |
| Supply air sensor | Reads low | CRAH reduces cooling; inlets rise | Comparison with adjacent sensors | Rack inlet monitoring alarm |
| Generator fuel pump | Fails to run | Day tank empties in hours | Day tank low-level alarm | Redundant pump, manual transfer |
FMEA is systematic and finds failure modes no one thought to ask about, especially spurious operations and sensor failures, which fault trees started from an obvious top event can miss. Its weakness is that it considers one failure at a time, so combinations must be found by other methods. Many owners require a design FMEA before construction and use it to choose commissioning tests (Lesson 5).
Markov models
A Markov model describes a system by its states (for example, both units working, one failed, both failed) and the rates of transition between them (failures move the system to a worse state, repairs to a better one). Solving the model gives the long-run fraction of time in each state and the rate at which the system enters the failed state. Markov models naturally handle repair, a limited number of repair crews, standby units that fail differently when idle, and imperfect switching, all of which defeat simple RBDs.
For two redundant, repairable units each with failure rate λ, and a single crew repairing at rate μ, the states are 0, 1 and 2 units failed. The transitions are: from 0 to 1 at rate 2λ (either unit can fail), from 1 to 2 at rate λ, from 1 to 0 at rate μ and from 2 to 1 at rate μ. The steady-state probabilities satisfy a balance equation for each state: flow out equals flow in.
The drawback is that the number of states grows rapidly with the number of components, so Markov models are used for small subsystems, such as a redundant UPS pair or a generator plant, rather than whole facilities.
Monte Carlo simulation
Monte Carlo simulation abandons formulas altogether. A computer simulates the system's life event by event: it draws random times to failure and repair from the appropriate distributions, tracks the state of every component, applies the logic of transfer schemes and repair crews, and records when the system is down. Repeating this over thousands of simulated years gives estimates of availability, outage frequency and outage duration, along with their spread. Simulation can include almost anything, such as aging components with rising failure rates, maintenance schedules, spares that run out, or weather that affects the utility, at the cost of computing time and statistical uncertainty in the results.
import numpy as np

# Two redundant, repairable units (1-of-2), each MTBF 2,000 h and MTTR 48 h, one repair crew
lam, mu = 1 / 2000, 1 / 48

# Markov model: states 0, 1 or 2 units failed; solve the steady-state probabilities
Q = np.array([[-2 * lam, 2 * lam, 0],
              [mu, -(lam + mu), lam],
              [0, mu, -mu]])
A_mat = np.vstack([Q.T, np.ones(3)])
p = np.linalg.lstsq(A_mat, np.array([0, 0, 0, 1.0]), rcond=None)[0]
print(f"Markov: probability both down = {p[2]:.2e}, downtime {p[2] * 8760 * 60:.1f} min/yr")
print(f"Markov: rate of system failures = {p[1] * lam * 8760:.4f} per year")

# Monte Carlo: simulate many years of operation event by event
rng = np.random.default_rng(42)
years, t_end = 2000, 2000 * 8760
t, failed, down_time, outages = 0.0, 0, 0.0, 0
while t < t_end:
    rate_fail = (2 - failed) * lam
    rate_repair = mu if failed > 0 else 0.0
    total = rate_fail + rate_repair
    dt = rng.exponential(1 / total)
    if failed == 2:
        down_time += dt
    t += dt
    if rng.random() < rate_fail / total:
        failed += 1
        if failed == 2:
            outages += 1
    else:
        failed -= 1
print(f"Monte Carlo ({years} years): downtime {down_time / years * 60:.1f} min/yr, {outages / years:.4f} outages per year")

# Fault tree: loss of power to a rack = (UPS A path down AND UPS B path down) OR rack PDU fault
pA, pB, p_common, p_pdu = 1e-3, 1e-3, 5e-5, 2e-5
top = 1 - (1 - pA * pB) * (1 - p_common) * (1 - p_pdu)
print(f"Fault tree top event probability: {top:.2e}")
for name, pc in [("A and B together", pA * pB), ("Common cause", p_common), ("Rack PDU", p_pdu)]:
print(f" cut set {name:<17} {pc:.1e} ({pc / top:5.1%} of total)")Markov: probability both down = 1.10e-03, downtime 577.1 min/yr Markov: rate of system failures = 0.2004 per year Monte Carlo (2000 years): downtime 579.5 min/yr, 0.2070 outages per year Fault tree top event probability: 7.10e-05 cut set A and B together 1.0e-06 ( 1.4% of total) cut set Common cause 5.0e-05 (70.4% of total) cut set Rack PDU 2.0e-05 (28.2% of total)
The pair here is deliberately unreliable (MTBF 2,000 hours, MTTR 48 hours) so that the simulation sees many outages in a short run. The Markov model predicts that both units are down about 0.11 % of the time, around 577 minutes a year, with about 0.20 system failures a year. Two thousand simulated years give 580 minutes and 0.21 failures a year, agreeing within the statistical noise of the simulation. With more realistic data, outages become rare, and a simulation needs far more years to estimate them precisely, which is one reason analytic models remain useful.
The fault tree part of the output shows the cut set ranking. The two-path cut set, with both independent paths down together, contributes only 1.4 % of the risk. The common-cause event contributes 70 % and the rack PDU, a single point of failure in front of a single-corded device, contributes 28 %. Improving either UPS path would hardly change the result; reducing common causes or eliminating the single point would.
Worked problem
Finding a single point of failure
A design review FMEA of a 2N facility finds that both UPS systems receive their 'start on battery' signal from a single programmable controller, and that a controller crash would shut down both UPS systems' battery breakers. The controller has an estimated failure rate of 1 per 20 years. What does this mean for the design?
Show solution
- The controller crash is a single basic event that causes the top event, so it is a single-event minimal cut set: a single point of failure.
- Its annual probability is about 0.05, far larger than the probability of both UPS paths failing independently.
- The fix is to give each UPS its own independent control, so that a controller failure affects only one path, and to make the battery breakers fail to a safe state (closed) on loss of control signal.
Answer: A single shared controller turns a 2N design into an N design for this failure. Finding such hidden single points of failure is the most valuable outcome of reliability modeling, and the fix should be verified during IST by failing the controller (Lesson 5).
Choosing a method
In practice, the methods complement each other. FMEA, done early with the design team, finds failure modes and single points of failure. RBDs give quick comparisons of design options. Fault trees analyze the specific outcomes the owner fears most and rank their causes. Markov models handle repair and standby in key subsystems, and Monte Carlo simulation brings everything together when the system is too complex for analytic methods. Whatever the method, the model is only as good as its structure and data, and it should be reviewed with the people who know the plant: designers, commissioning agents and operators.
Common mistakes
MistakeDrawing an RBD from the physical layout.
InsteadDraw blocks according to how failures affect the function.
MistakeIgnoring spurious operation and sensor failure modes.
InsteadUse FMEA to list every failure mode of every component.
MistakeImproving the redundant paths when a single point dominates.
InsteadRank cut sets and address the largest contributors first.
MistakeTrusting a short simulation of rare events.
InsteadCheck simulation convergence and compare with analytic models.
MistakeBuilding models without the operators.
InsteadReview model structure and data with designers, commissioning agents and operators.
Summary and key terms
- RBDs combine blocks in series and parallel according to failure effects.
- Fault trees work down from a top event through AND and OR gates to basic events.
- Minimal cut sets identify single points of failure and rank risk contributors.
- FMEA works up from each component's failure modes and finds overlooked modes.
- Markov models handle repair, standby and switching for small subsystems.
- Monte Carlo simulation handles complex systems at the cost of computing time and statistical noise.
- Methods complement each other; models must be reviewed with people who know the plant.
- Reliability block diagram
- A diagram of blocks in series and parallel representing failure logic.
- Fault tree
- A logic diagram from a top event down to basic events.
- Top event
- The undesired outcome a fault tree analyses.
- Basic event
- The lowest-level event in a fault tree, with an estimated probability.
- Minimal cut set
- A smallest combination of basic events that causes the top event.
- Single point of failure
- A single event that causes system failure.
- FMEA
- Failure modes and effects analysis.
- Risk priority number
- A score combining severity, occurrence and detection.
- Markov model
- A model of states and transition rates.
- Monte Carlo simulation
- Estimating system behavior by simulating random events many times.
Practice problems
Work each problem on paper first, then reveal the answer to check.
How is a k-of-n group drawn in an RBD?
Show answer
As a single block labeled k/n.
What does an AND gate in a fault tree mean?
Show answer
All inputs must occur for the output event to occur.
What is a single-event minimal cut set?
Show answer
A single point of failure.
Two independent events of probability 10⁻³ form a cut set. What is its probability?
Show answer
10⁻⁶.
Name three failure modes of a circuit breaker.
Show answer
Fails to open, fails to close, trips spuriously.
What does FMECA add to FMEA?
Show answer
Criticality scoring of severity, occurrence and detection.
Write the balance equation for state 2 of the two-unit Markov model.
Show answer
λP₁ = μP₂.
From the output, do the Markov model and simulation agree?
Show answer
Yes: about 577 and 580 minutes a year, and 0.20 and 0.21 failures a year.
From the output, which cut set dominates the fault tree?
Show answer
The common-cause event, about 70 %.
Why are Markov models limited to small subsystems?
Show answer
The number of states grows rapidly with the number of components.
Lesson quiz · 5 questions
Score 60% or more to complete this lesson.
Create a free account to save your progress, take quizzes and earn a certificate.