
DCE-450 · Lesson 10 of 12 · 25 min
Monitoring and capacity management
A data center generates a constant stream of data: voltages, currents, breaker states, temperatures, humidity, flows, pressures, fan speeds, alarm events and energy readings from thousands of points. Used well, this data lets operators see trouble coming, respond to failures quickly, run the facility efficiently and plan expansion before capacity runs out. Used badly, it buries operators in alarms they learn to ignore. This lesson covers the monitoring systems, how alarms should be designed and managed, the key efficiency metrics, and capacity management: tracking power, cooling and space so that the facility neither runs out unexpectedly nor sits half-empty with capacity no one can use.
Monitoring systems
Three overlapping systems usually monitor a data center. The building management system (BMS) controls and monitors mechanical plant: chillers, pumps, air handlers, valves, temperatures and leak detection. The electrical power monitoring system (EPMS) records electrical quantities and events from meters, protective relays, UPS and generator controllers, often with high-speed waveform capture for fault analysis. Data center infrastructure management (DCIM) software sits above them, combining their data with an inventory of racks, devices and connections to support capacity planning, change management and reporting. Rack-level sensors (inlet temperature, humidity, door status) and intelligent rack PDUs that measure power per outlet complete the picture.
These systems are critical infrastructure in their own right. They need reliable power (on UPS), redundant servers and networks, time synchronization (Lesson 5), cybersecurity protection appropriate for operational technology, and regular verification that their readings are accurate. A drifting sensor can quietly lead a control loop or an operator astray for months.
Alarm management
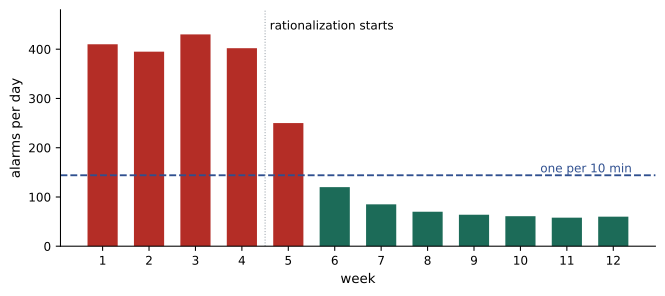
An alarm should tell an operator that something needs a response. In many facilities, it does not: monitoring systems are configured with every available alarm enabled at default settings, generating hundreds of alarms a day, many of them nuisance alarms that clear themselves or duplicates of the same event. Operators faced with an alarm flood cannot find the critical alarm among the noise, and a long series of incidents across industries has shown that alarm floods contribute to serious accidents.
The ISA-18.2 standard (also published as IEC 62682) describes an alarm management lifecycle that applies well to data centers. Its key ideas are:
- Every alarm must have a defined response. If no operator action is needed, it should be an event log entry, not an alarm.
- Alarms are prioritized, usually into three or four levels, according to the consequence of not responding and the time available, and each priority has a defined response time.
- Alarm rates are measured. A widely used guideline is that an operator can handle about one alarm every ten minutes in steady operation; sustained rates well above that indicate a poorly designed system.
- Nuisance and chattering alarms are fixed with appropriate deadbands, delays or better settings, not simply silenced.
- Alarm floods after a major event are reduced by suppressing consequential alarms (for example, the hundred downstream alarms that follow a single breaker trip).
- Alarm settings are documented in an alarm database and changed only through change control (Lesson 9).
Efficiency metrics
Power usage effectiveness (PUE) is the most widely used efficiency metric for data centers, defined in ISO/IEC 30134-2 as the total facility energy divided by the IT equipment energy over a period, usually a year:
A PUE of 1.0 would mean every kilowatt-hour goes to IT equipment; the excess above 1.0 is cooling, power conversion losses, lighting and other overhead. Modern large facilities achieve annual PUEs of around 1.1 to 1.4, depending heavily on climate and cooling technology, while older enterprise facilities may be 1.6 to 2.0 or higher. PUE must be measured carefully: the measurement points, the period, and what is counted as IT load all affect the result, and it should be reported as an annual figure, since a cold-month PUE flatters a site. PUE also says nothing about how efficiently the IT equipment uses its energy, and it can rise when IT load falls, because fixed overheads are spread over less load.
Related metrics from the same ISO/IEC 30134 series include water usage effectiveness (WUE, liters of water per kilowatt-hour of IT energy), carbon usage effectiveness (CUE) and renewable energy factor (REF). Operators increasingly report them to customers and regulators.
In the United States, building energy benchmarking requirements are set by states and cities, such as New York City's Local Law 84, typically using ENERGY STAR Portfolio Manager, and federal data centers have their own energy and PUE targets.
Capacity management
Capacity management answers a deceptively simple question: how much more IT load can this facility take, and where? Four resources must all be available at the same place: space (rack positions), power (at the rack, the PDU, the UPS and the utility), cooling (airflow and heat removal at that location) and connectivity. A rack position with space and network but no cooling capacity is unusable, and capacity that exists in the plant but cannot be delivered to where it is needed is called stranded capacity.
Redundancy changes what capacity means. In a 2N power design, each side must be able to carry the whole load alone if the other fails, so the usable capacity is the capacity of one side, not of both. A facility with two 3,000 kW UPS systems has 6,000 kW installed but only 3,000 kW of usable 2N capacity, and each side should run at no more than 50 % in normal operation. Similar rules apply to N+1 cooling: the capacity is that of the plant with its largest unit failed.
Capacity management therefore tracks, for each level of the power and cooling chains, the design capacity, the redundancy-adjusted usable capacity, the current measured load, and the load committed to customers or projects but not yet installed. Thresholds trigger action: for example, a warning at 70 % of usable capacity and a hard limit at 80 %, with the margin protecting against measurement error, load swings and future growth on existing racks.
Forecasting
Because new UPS systems, generators or chillers can take a year or more to design, procure and install, capacity managers forecast load growth and compare it with the time needed to add capacity.
import numpy as np

# Monthly average IT load (kW) for a data hall over the last 18 months
it_kW = np.array([1310, 1335, 1372, 1390, 1428, 1455, 1470, 1512, 1540, 1561, 1598, 1630,
                  1652, 1690, 1711, 1748, 1772, 1805])
months = np.arange(len(it_kW))
slope, intercept = np.polyfit(months, it_kW, 1)
print(f"Growth trend: {slope:.1f} kW per month ({slope * 12:.0f} kW per year)")

# Usable capacity in a 2N design: each side must carry the whole load alone
ups_per_side_kW = 3000
threshold = 0.80 * ups_per_side_kW          # plan expansion before 80 % of one side
months_left = (threshold - (intercept + slope * months[-1])) / slope
print(f"Current load {it_kW[-1]} kW = {it_kW[-1] / ups_per_side_kW:.0%} of one side ({it_kW[-1] / (2 * ups_per_side_kW):.0%} of installed)")
print(f"Planning threshold {threshold:.0f} kW reached in about {months_left:.0f} months")

# Power usage effectiveness for the last month
facility_kWh = 1.78e6
it_kWh = it_kW[-1] * 730
print(f"PUE = {facility_kWh / it_kWh:.2f}")
lead_time = 18
print(f"With an {lead_time}-month lead time for new UPS capacity, the project must start within {months_left - lead_time:.0f} months")Growth trend: 29.1 kW per month (349 kW per year) Current load 1805 kW = 60% of one side (30% of installed) Planning threshold 2400 kW reached in about 21 months PUE = 1.35 With an 18-month lead time for new UPS capacity, the project must start within 3 months
The hall's load is growing by about 29 kW a month. At 1,805 kW it uses only 30 % of the installed UPS capacity, which might look comfortable, but it already uses 60 % of one side, which is what matters in a 2N design. The 80 % planning threshold of 2,400 kW will be reached in about 21 months, and with an 18-month lead time for new capacity, the expansion project must start within about three months. A manager watching only installed capacity would have started far too late. Real forecasts also include known customer commitments, which often arrive in steps rather than as a smooth trend, and they consider scenarios, such as a large AI deployment, that the history cannot predict.
Worked problem
Finding stranded cooling capacity
A hall has 2,000 kW of N+1 cooling capacity and a measured IT load of 1,200 kW, but rack inlet temperatures in one zone are already at 26 °C and new high-density racks cannot be placed there. Where has the capacity gone, and what can be done?
Show solution
- Cooling capacity in the plant (2,000 kW) exceeds the load (1,200 kW), so the plant is not the constraint; the problem is delivering cold air to that zone.
- Likely causes are uneven load distribution (a cluster of high-density racks in one area), bypass airflow (missing blanking panels or containment gaps, Lesson 4), or air handlers in that zone running at maximum while others are lightly loaded.
- Check the temperature map and air handler loading, seal the containment, add blanking panels, rebalance airflow, and consider in-row cooling or rear-door heat exchangers for the high-density cluster. Place future high-density racks where cooling is available, not where space happens to be free.
Answer: This is stranded cooling capacity: the plant has it, but it cannot be delivered where it is needed. Airflow management and load placement usually recover much of it at low cost, while DCIM tools that model power and cooling by location help prevent it.
Reporting capacity
Capacity information is only useful if the people making decisions see it in a form they can act on. A typical monthly capacity report shows, for each hall and for the site, the usable capacity, measured peak and average load, committed but not yet installed load, and the remaining headroom for power, cooling and space, with a traffic-light status against the planning thresholds. It also lists stranded capacity and the actions to recover it, and the forecast date at which each threshold will be crossed. Sales teams use the report to know what they can promise customers, engineering uses it to plan expansions, and finance uses it to schedule capital spending. Measured values should be peaks over the period, not averages, because breakers and UPS systems must carry the peaks.
Using monitoring data for operations
Monitoring data is also an early warning system. Trends reveal slowly deteriorating equipment: a rising chilled water approach temperature indicates fouled heat exchanger tubes; a creeping increase in UPS battery internal resistance signals aging; a growing difference between phase currents suggests an unbalanced load or a failing component. Some operators apply anomaly detection and machine learning to these trends, but the foundation is simpler: accurate sensors, consistent data retention, and someone whose job is to look at the trends regularly and act on them, closing the loop with maintenance (Lesson 8).
Common mistakes
MistakeEnabling every available alarm at default settings.
InsteadRationalize alarms: each must have a defined response and priority.
MistakeReporting the best monthly PUE.
InsteadReport annual PUE with defined measurement points.
MistakeMeasuring capacity against installed capacity in a 2N design.
InsteadUse redundancy-adjusted usable capacity, one side for 2N.
MistakePlacing racks where space is free regardless of cooling.
InsteadCheck space, power, cooling and connectivity at the location.
MistakeStarting an expansion when the threshold is reached.
InsteadForecast growth and start projects a full lead time ahead.
Summary and key terms
- BMS, EPMS and DCIM monitor plant, power and capacity and are critical systems themselves.
- Alarm management gives every alarm a response, a priority and a measured rate.
- PUE is total facility energy divided by IT energy over a year, measured consistently.
- Capacity requires space, power, cooling and connectivity at the same location.
- Redundancy reduces usable capacity: one side in 2N, plant less its largest unit in N+1.
- Forecasting compares load growth with the lead time to add capacity.
- Trends in monitoring data give early warning of deterioration.
- BMS
- Building management system for mechanical plant.
- EPMS
- Electrical power monitoring system.
- DCIM
- Data center infrastructure management software.
- Alarm flood
- More alarms than an operator can handle in a short time.
- Nuisance alarm
- An alarm that needs no response or clears itself.
- PUE
- Power usage effectiveness: total facility energy over IT energy.
- WUE
- Water usage effectiveness: water used per unit of IT energy.
- Stranded capacity
- Capacity that exists but cannot be used where needed.
- Usable capacity
- Capacity available after allowing for redundancy.
- Planning threshold
- A utilization level that triggers capacity expansion.
Practice problems
Work each problem on paper first, then reveal the answer to check.
What does each of the BMS, EPMS and DCIM mainly do?
Show answer
BMS monitors and controls mechanical plant; EPMS monitors electrical quantities and events; DCIM combines them with inventory for capacity and change management.
What should happen to an alarm that requires no operator action?
Show answer
It should become an event log entry, not an alarm.
What steady alarm rate can an operator typically handle?
Show answer
About one alarm every ten minutes.
A facility uses 2.6 GWh in a year, of which 2.0 GWh goes to IT. What is the PUE?
Show answer
1.3.
Why should PUE be reported annually?
Show answer
Seasonal variation makes short periods unrepresentative.
What is the usable capacity of a 2N system with two 2,000 kW UPS?
Show answer
2,000 kW.
From the output, how fast is the load growing?
Show answer
About 29 kW per month, 349 kW per year.
From the output, when must the expansion project start?
Show answer
Within about three months.
What is stranded capacity?
Show answer
Capacity that exists in the plant but cannot be delivered or used where it is needed.
What might a rising chilled water approach temperature indicate?
Show answer
Fouled heat exchanger tubes.
Lesson quiz · 5 questions
Score 60% or more to complete this lesson.
Create a free account to save your progress, take quizzes and earn a certificate.