
BUS-110 · Lesson 11 of 12 · 35 min
Break-even and cost-volume-profit analysis
How many units must a business sell to cover its costs? How much profit will an extra thousand sales bring? What happens to profit if rent goes up, or if the price is cut by 10 %? Cost-volume-profit (CVP) analysis answers these questions by modeling how costs and revenue change with the volume of sales. It is one of the most practical tools in business mathematics, used in business plans, pricing decisions, budgeting and loan applications. This lesson builds the model from the distinction between fixed and variable costs and applies it to break-even points, target profits, risk and sales mix.
Fixed and variable costs
A variable cost changes in proportion to the number of units produced or sold: ingredients, packaging, sales commissions, credit card fees, direct materials, piece-rate labor. A fixed cost stays the same over a range of activity, regardless of volume: rent, salaried wages, insurance, loan interest, depreciation, basic utilities, software subscriptions. Some costs are mixed, with a fixed base plus a variable part, such as a phone plan with a monthly charge plus usage, and are split into their fixed and variable pieces for analysis.
The word 'fixed' applies only within a relevant range. A café's rent is fixed whether it sells 2,000 or 5,000 coffees a month, but if it needs a second location to sell 20,000, its fixed costs jump. CVP results are reliable only within the range where the cost assumptions hold.
| Cost | Behavior | Notes |
|---|---|---|
| Coffee beans, milk, cups | Variable | Rise with each cup sold |
| Card processing fees | Variable | A percentage of each sale |
| Rent | Fixed | Same each month within the lease |
| Manager's salary | Fixed | Same regardless of sales |
| Hourly staff | Step or mixed | Fixed within a schedule; rises when shifts are added |
| Electricity | Mixed | Base load plus usage from equipment |
| Equipment lease | Fixed | Contracted monthly payment |
Contribution margin
The contribution margin per unit is the selling price minus the variable cost per unit. It is the amount each unit sold contributes, first toward covering fixed costs and then, once they are covered, toward profit. The contribution margin ratio is the contribution margin as a percentage of the price.
With price P, variable cost per unit VC, fixed costs FC and volume Q, the profit equation is:
The break-even point
The break-even point is the volume at which profit is zero: total contribution exactly covers fixed costs. Below it the business loses money; above it, every additional unit adds its contribution margin to profit.
Worked problem
Break-even for a café
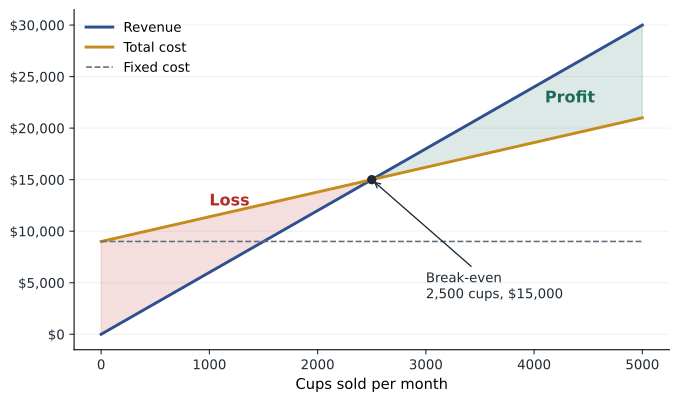
A café sells specialty coffees for $6.00 each. Variable costs (beans, milk, cups, card fees) are $2.40 a cup. Fixed costs are $9,000 a month. Find the contribution margin, the contribution margin ratio and the break-even point in cups and in sales dollars.
Show solution
- CM = $6.00 − $2.40 = $3.60 a cup.
- CMR = $3.60 ÷ $6.00 = 0.60, or 60 %.
- Break-even volume = $9,000 ÷ $3.60 = 2,500 cups a month.
- Break-even sales = $9,000 ÷ 0.60 = $15,000 a month (check: 2,500 × $6.00 = $15,000).
Answer: The café breaks even at 2,500 cups, or $15,000 of sales, a month: about 83 cups a day over a 30-day month.
Target profit
To find the volume needed for a target operating profit, treat the profit as an extra fixed cost that the contribution margin must cover.
Worked problem
Volume for a target profit
The café owner wants an operating profit of $5,400 a month. How many cups must she sell?
Show solution
- Q = ($9,000 + $5,400) ÷ $3.60 = 4,000 cups.
- Check: 4,000 × $3.60 − $9,000 = $14,400 − $9,000 = $5,400.
Answer: She must sell 4,000 cups a month, 1,500 more than break-even.
If the target is an after-tax profit, first convert it to the pre-tax profit that leaves that amount after tax: pre-tax profit = after-tax profit ÷ (1 − tax rate).
A US C corporation pays a flat federal corporate income tax of 21 % on its taxable income, plus state corporate income tax in most states, at the time of writing (October 2026). Many small businesses are instead organized as sole proprietorships, partnerships, S corporations or LLCs, whose profit passes through to the owners and is taxed on their personal returns, along with self-employment tax.
Worked problem
An after-tax target
The café is a C corporation paying the 21 % federal rate (ignore state tax). How many cups must it sell to earn an after-tax profit of $6,000 a month?
Show solution
- Pre-tax profit needed = $6,000 ÷ (1 − 0.21) = $6,000 ÷ 0.79 = $7,594.94.
- Q = ($9,000 + $7,594.94) ÷ $3.60 = 4,609.70, rounded up to 4,610 cups.
Answer: The café needs about 4,610 cups a month. Always round volumes up, because selling slightly fewer would miss the target.
Margin of safety and operating leverage
The margin of safety is how far sales can fall before the business starts losing money. It is usually expressed in units, in dollars and as a percentage of expected sales. A larger margin of safety means a less risky operation.
Operating leverage measures how sensitive profit is to changes in sales. A business with high fixed costs and low variable costs has high operating leverage: once fixed costs are covered, profit climbs quickly with sales, but it also falls quickly when sales drop. The degree of operating leverage (DOL) at a given volume is the total contribution margin divided by operating profit; a 1 % change in sales then changes profit by DOL %.
Worked problem
Margin of safety and operating leverage
The café expects to sell 3,500 cups next month. What are its expected profit, margin of safety and degree of operating leverage? What happens to profit if sales are 10 % higher than expected?
Show solution
- Total CM = 3,500 × $3.60 = $12,600; profit = $12,600 − $9,000 = $3,600.
- Margin of safety = 3,500 − 2,500 = 1,000 cups, or 1,000 ÷ 3,500 = 28.6 % of expected sales.
- DOL = $12,600 ÷ $3,600 = 3.5.
- A 10 % rise in sales raises profit by 3.5 × 10 % = 35 %, to $4,860. Check: 3,850 × $3.60 − $9,000 = $4,860.
Answer: Expected profit is $3,600, sales can fall 28.6 % before a loss, and every 1 % change in sales moves profit by 3.5 %.
What-if analysis
Because the CVP model is so simple, it is easy to test the effect of changes: a price rise, a new supplier, a rent increase, a new salaried employee. Change the inputs and recompute. Spreadsheets make this particularly easy: put price, variable cost and fixed costs in input cells, and every result updates instantly.
Worked problem
A rent rise and a price increase
The café's landlord raises the rent by $1,200 a month. The owner responds by raising the price to $6.50. What is the new break-even point? If 4 % of customers stop buying because of the price rise, will expected profit at 3,500 cups rise or fall?
Show solution
- New CM = $6.50 − $2.40 = $4.10; new FC = $10,200.
- New break-even = $10,200 ÷ $4.10 = 2,487.8, so 2,488 cups.
- Expected volume after losing 4 % = 3,500 × 0.96 = 3,360 cups.
- New profit = 3,360 × $4.10 − $10,200 = $13,776 − $10,200 = $3,576, compared with $3,600 before.
Answer: The break-even point barely moves, to 2,488 cups, and profit falls only slightly, to $3,576. The price rise almost fully offsets the higher rent even after losing some customers.
Worked problem
Choosing between cost structures
The café can lease a high-efficiency espresso machine for $1,500 a month more in fixed costs, which would cut variable costs from $2.40 to $1.90 a cup. At what volume are the two options equally profitable? Which should the café choose if it expects 3,500 cups a month?
Show solution
- The lease adds $1,500 of fixed cost and saves $0.50 a cup.
- Indifference point = $1,500 ÷ $0.50 = 3,000 cups a month.
- Above 3,000 cups, the lease saves more than it costs. At 3,500 cups it adds 500 × $0.50 = $250 a month of profit.
- The lease also raises the break-even point to $10,500 ÷ $4.10 = 2,561 cups.
Answer: At 3,500 cups the lease is worth $250 a month, but it raises the break-even point and the operating leverage. If sales are uncertain, the extra risk may not be worth it.
Several products: the sales mix
Most businesses sell more than one product, each with its own contribution margin. If the sales mix (the proportion of each product in total sales) is stable, the business can be analyzed with a weighted average contribution margin.
Worked problem
Break-even with a sales mix
The café also sells pastries ($4.00 price, $1.60 variable cost) and sandwiches ($10.00 price, $5.50 variable cost). By units, sales are 50 % coffee, 30 % pastries and 20 % sandwiches. Fixed costs are still $9,000. What is the break-even point?
Show solution
- CMs: coffee $3.60, pastries $2.40, sandwiches $4.50.
- Weighted CM = 0.5 × $3.60 + 0.3 × $2.40 + 0.2 × $4.50 = $1.80 + $0.72 + $0.90 = $3.42.
- Break-even = $9,000 ÷ $3.42 = 2,631.6, so 2,632 items.
- Split by the mix: about 1,316 coffees, 790 pastries and 527 sandwiches (rounding up each).
Answer: The café breaks even at about 2,632 items a month. If customers shift toward lower-margin pastries, the break-even point rises; a shift toward sandwiches lowers it.
Limits of the model
CVP analysis assumes that price and variable cost per unit stay constant, that fixed costs stay fixed within the relevant range, that everything produced is sold and that the sales mix is stable. Real businesses face volume discounts, overtime, price cuts to move more product and changing customer preferences. The model is best used as a first approximation and a way to see which assumptions matter most, not as a precise forecast.
# Cost-volume-profit model for the cafe
P, VC, FC = 6.00, 2.40, 9000
CM = P - VC
print(f"CM {CM:.2f}, CMR {CM / P:.0%}, break-even {FC / CM:,.0f} cups = ${FC / (CM / P):,.0f}")
print(f"Cups for $5,400 profit: {(FC + 5400) / CM:,.0f}")
Q = 3500
profit = Q * CM - FC
print(f"At {Q} cups: profit {profit:,.0f}, margin of safety {(Q - FC / CM) / Q:.1%}, DOL {Q * CM / profit:.2f}")
mix = {"coffee": (0.5, 3.60), "pastry": (0.3, 2.40), "sandwich": (0.2, 4.50)}
wcm = sum(share * cm for share, cm in mix.values())
print(f"Weighted CM {wcm:.2f}, break-even {FC / wcm:,.1f} items")
for q in (2000, 2500, 3000, 3500, 4000):
print(q, "cups ->", round(q * CM - FC))CM 3.60, CMR 60%, break-even 2,500 cups = $15,000 Cups for $5,400 profit: 4,000 At 3500 cups: profit 3,600, margin of safety 28.6%, DOL 3.50 Weighted CM 3.42, break-even 2,631.6 items 2000 cups -> -1800 2500 cups -> 0 3000 cups -> 1800 3500 cups -> 3600 4000 cups -> 5400
Common mistakes
MistakeTreating all costs as variable or all as fixed.
InsteadSeparate fixed and variable costs; split mixed costs into their parts.
MistakeDividing fixed costs by the price instead of the contribution margin.
InsteadBreak-even units = FC ÷ (P − VC).
MistakeRounding a required volume down.
InsteadRound up, or the target will be missed.
MistakeAdding an after-tax target directly to fixed costs.
InsteadConvert it to a pre-tax profit first: after-tax ÷ (1 − tax rate).
MistakeAssuming a single break-even point when the sales mix changes.
InsteadRecompute the weighted contribution margin for the new mix.
Summary and key terms
- Variable costs change with volume; fixed costs do not, within the relevant range.
- Contribution margin = price − variable cost; CMR = CM ÷ price.
- Break-even units = FC ÷ CM; break-even sales = FC ÷ CMR.
- Target profit units = (FC + target) ÷ CM; convert after-tax targets to pre-tax first.
- Margin of safety shows how far sales can fall before a loss.
- DOL = total CM ÷ profit; high fixed costs mean high operating leverage.
- Multiple products use a weighted contribution margin based on the sales mix.
- Variable cost
- A cost that changes in proportion to volume.
- Fixed cost
- A cost that stays constant within the relevant range.
- Mixed cost
- A cost with both fixed and variable parts.
- Relevant range
- The range of activity over which cost assumptions hold.
- Contribution margin
- Price minus variable cost per unit.
- Contribution margin ratio
- Contribution margin as a percentage of price.
- Break-even point
- The volume or sales at which profit is zero.
- Margin of safety
- The amount by which expected sales exceed break-even sales.
- Operating leverage
- The sensitivity of profit to changes in sales.
- Sales mix
- The proportions in which products are sold.
Practice problems
Work each problem on paper first, then reveal the answer to check.
Price $25, variable cost $15, fixed costs $40,000. What is the break-even volume?
Show answer
4,000 units.
What is the break-even in sales dollars for that product?
Show answer
$100,000.
How many units give a profit of $20,000?
Show answer
6,000 units.
A product has a CMR of 35 % and fixed costs of $70,000. What are break-even sales?
Show answer
$200,000.
Expected sales are 5,000 units and break-even is 4,000. What is the margin of safety?
Show answer
1,000 units, or 20 %.
At 5,000 units, total CM is $50,000 and profit is $10,000. What is the DOL?
Show answer
5.
With a DOL of 5, what happens to profit if sales rise 4 %?
Show answer
It rises 20 %.
A business wants $9,000 after tax at a 25 % tax rate. What pre-tax profit is needed?
Show answer
$12,000.
Two products sell in a 3:1 ratio with CMs of $8 and $12. What is the weighted CM?
Show answer
$9.
Option A: FC $20,000, VC $6. Option B: FC $26,000, VC $4. At what volume are they equal?
Show answer
3,000 units.
Lesson quiz · 5 questions
Score 60% or more to complete this lesson.
Create a free account to save your progress, take quizzes and earn a certificate.