
BAS-410 · Lesson 6 of 12 · 23 min
Trending to verify performance
▶ Video coming soon A video version of this lesson is on the way.
A functional test shows what a system does for twenty minutes while people watch it. A building runs for 168 hours a week, through cold mornings, sunny afternoons, empty weekends and Monday starts. The Marlow Lane binder's trend tab covered the burn-in week, from Thursday, October 29 to Wednesday, November 4, when the new controls ran the building on their own with Quillon watching. Ivo laid the trend plots out on the bench. "The functional tests proved the sequences can work," he said. "The burn-in trends proved they do work, all week, without anyone touching them."
Why trends belong in commissioning
Trends catch problems that a witnessed test cannot. A loop can be stable in a ten-minute step test and hunt every morning at low load. A schedule can be right on the front end and wrong on one controller whose clock drifted. A box can pass its functional test in October and fail to heat a corner office on the first cold morning. Trend verification, also called trend-based functional testing or monitoring-based verification, uses recorded data over days or weeks to check performance in real operation.
Trends are also cheaper than witnessed tests for some checks. Philippa could review a week of every box's zone temperature in an afternoon at her desk, where watching the same thing on site would take a week of someone's time. For that reason, many commissioning specifications now require a trend period before acceptance, and some allow certain functional test steps to be passed from trends alone.
| Check | Witnessed test | Trend verification |
|---|---|---|
| Does the mode work when triggered? | Best: someone sees it happen | Good if the mode occurs naturally during the trend period |
| Is the loop stable at all loads? | Only at the loads during the test | Best: shows every load in the period |
| Do schedules, warm-up and setback run every day? | Only on test day | Best: shows every day |
| Does the system recover from a failure? | Best: the failure is caused deliberately | Only if a failure happens to occur |
| Is the building comfortable and efficient over time? | No | Best |
Setting up the trend period
Design review comment D-8 had put a trend list and a seven-day burn-in period into Marlow Lane's specification. The list named the points, the interval, and how long the data had to be kept. Ivo set it up before the burn-in week, using what Callie had learned in BAS-220 about intervals, buffers and storage.
| Group | Points | Interval |
|---|---|---|
| AHU-1: temperatures, static pressure, fan speeds, damper and valve positions, setpoints, mode | 24 | 1 min |
| VAV boxes: zone temperature, active setpoint, airflow, airflow setpoint for each box | 144 (36 × 4) | 1 min |
| Heating plant: supply and return temperatures, boiler status and firing, pump status | 12 | 1 min |
| Total | 180 |
Worked problem
How much data, and how often must it be collected?
180 points are trended at 1-minute intervals for 7 days. Each controller keeps a buffer of 1,000 samples per trend. How many samples are recorded, and how often must the front end collect them so nothing is lost?
Show solution
- Samples per point per day: 24 × 60 = 1,440.
- All points for the week: 180 × 1,440 × 7 = 1,814,400 samples.
- A 1,000-sample buffer at 1 minute holds 1,000 minutes, about 16.7 hours.
Answer: About 1.8 million samples. The buffers fill in under 17 hours, so the front end must collect at least every few hours; Ivo set collection every hour, so that a missed collection or two would not lose data.
Ivo checked the trends on the first morning of the burn-in week, before relying on them: every point recording, timestamps matching the server clock, no gaps. One trend on the plant controller had been set up at 10 minutes instead of 1, which he corrected that morning. Trends that are set up wrongly are found at the end of the week, when it is too late to repeat it, unless someone looks on the first day.
Acceptance criteria for trends
Trend verification needs criteria just as a witnessed test does. Vague criteria such as "stable" or "good control" turn the review into an argument. Philippa's plan defined each one in numbers, using only occupied hours so that warm-up and setback did not count against the steady-state criteria.
| Item | Criterion (Marlow Lane commissioning plan) |
|---|---|
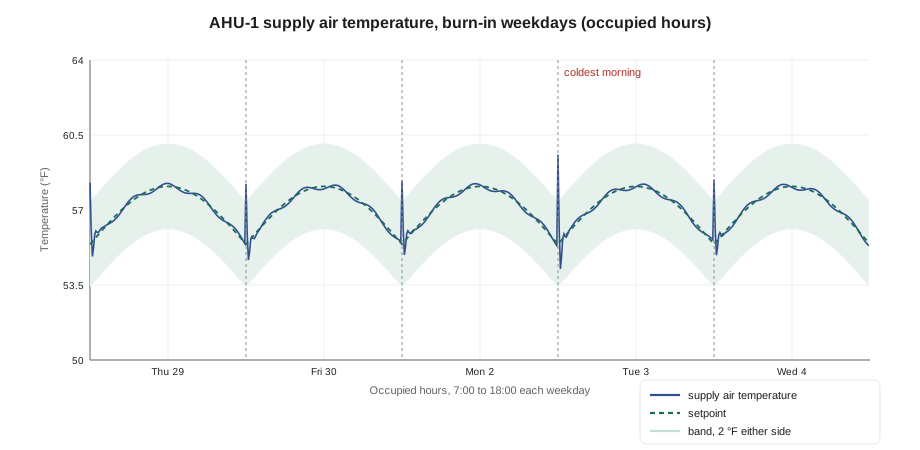
| AHU-1 supply air temperature | Within 2 °F of setpoint for at least 95 in 100 of occupied 1-minute samples |
| AHU-1 duct static pressure | Within 10 in 100 of setpoint for at least 95 in 100 of occupied samples; reset active between its limits |
| Zone temperatures | Within 2 °F of the active setpoint for at least 90 in 100 of occupied samples, each zone |
| Loops | No sustained oscillation of any valve, damper or speed output |
| Schedules and modes | Occupied, unoccupied and warm-up at the scheduled times every day |
| Alarms | Every alarm in the period explained, and nuisance alarms fixed |
The burn-in week contained five weekdays (Thursday, Friday, Monday, Tuesday, Wednesday) and one weekend, which made it a reasonable sample of a normal week. It also contained some cold mornings, which turned out to matter.
Worked problem
Did the supply air temperature pass?
In the five occupied days, 7:00 to 18:00, AHU-1's supply air temperature was recorded every minute. 3,207 of the samples were within the band. What share is that, and does it pass the 95 in 100 criterion?
Show solution
- Occupied samples: 5 days × 11 hours × 60 = 3,300.
- Share in band: 3,207 ÷ 3,300 = 0.972, about 97 in 100.
Answer: Pass, at about 97 in 100. The 93 samples outside the band were all in the first 25 minutes after the morning start, when the system was still settling after warm-up. Philippa noted them and accepted the result, with a suggestion that the morning transition be looked at during the warranty review.
What the trends found
The trend review produced five findings. Three were fixed in the burn-in week, one was a design question, and one confirmed something the functional test could not.
| Finding | Seen in | Result |
|---|---|---|
| VAV-2-07 and VAV-2-08 reheat valves cycling between about 20 and 60 every few minutes in mid-morning | Valve position trends | Confirmed with a 10 s fast trend; loops retuned; rechecked |
| VAV-1-02, a corner office with two outside walls, below its heating setpoint for the first hour on the coldest mornings | Zone temperature trend | Issue for the design engineer: heating airflow or warm-up time; open at handover |
| Six first-floor boxes far from airflow setpoint | Airflow against setpoint | Their airflow factors had not yet been set by the balancer (lesson 7); entered on October 30 |
| Plant controller trend set at 10 minutes | Trend set-up check | Corrected on the first morning |
| Static pressure reset moving between its limits as boxes called | Static pressure and box damper trends | Confirmed the reset worked at real loads, which the step tests had not shown |
The first finding is a good example of choosing the right interval. A 1-minute trend showed VAV-2-07's valve moving in a sawtooth, but a cycle of about four minutes is only four samples per cycle at 1-minute intervals, too few to see its shape clearly. BAS-220 gave the rule: sample at least five times per cycle, so a cycle of about 240 s needs an interval of 48 s or less. Ivo added a 10-second fast trend on both boxes for one morning, the same approach Sophie had used on Tilden's AHU-2. The fast trend showed a clean oscillation with a period of about 230 s, which pointed to an integral time far too short for a slow hot water valve. Sophie retuned both loops, and the next morning's trend was flat.
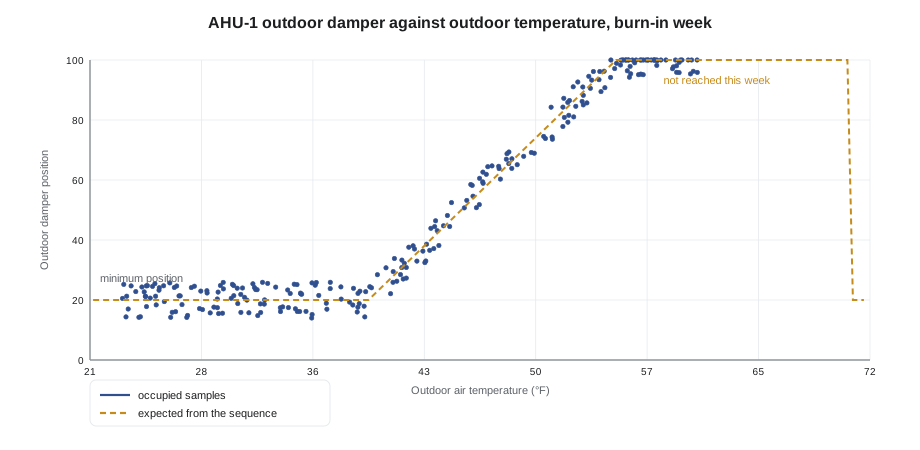
The economizer plot is a trend check that a witnessed test cannot easily do. Plotting damper position against outdoor temperature for a whole week, rather than against time, shows at a glance whether the economizer opened when it should have and stayed at minimum when it should have. On the burn-in data the points followed the expected shape. A week with warmer afternoons would have tested the high limit too; that part was deferred to the June 2027 tests (a plan), when outdoor temperatures will approach and exceed the return air temperature.
The alarms
The burn-in week also tested the alarms. Quillon's practice, which BAS-320 described, is to send all alarms only to the installer during burn-in, so that nuisance alarms are found before the owner's on-call phone receives them. OPR line 6 asked for no nuisance alarms, which made the alarm review part of commissioning.
| Source | Alarms in burn-in week | Cause | Fix |
|---|---|---|---|
| Zone temperature out of band | 131 | Alarms during morning warm-up, before occupancy | Alarm enabled only 30 min after the occupied period starts |
| VAV airflow far from setpoint | 52 | Six boxes with airflow factors not yet set by the balancer | Balancer's factors entered; alarms rechecked |
| Controller offline | 19 | One MS/TP trunk on floor 2 with a loose shield connection | Connection made good at the controller |
| Hot water temperature far from setpoint | 8 | Delay of 2 min too short for the boiler start sequence | Delay raised to 15 min |
| Other | 4 | Real events: two exhaust fan trips, two server room high temperatures | Left as they were |
There were 214 alarms in the 168 hours, and almost all were nuisance alarms with fixable causes. After the fixes, the week after handover, November 5 to 11, produced 23. Philippa's report records both numbers, the causes, and a December alarm review with Rowena (a plan) to check that the remaining alarms are all real.
Worked problem
Counting the nuisance alarms
Of the 214 burn-in alarms, the 4 in the Other row were real events. What share of the burn-in alarms were nuisance alarms?
Show solution
- Nuisance alarms: 214 − 4 = 210.
- Share: 210 ÷ 214 = 0.981, about 98 in 100.
Answer: About 98 in 100 were nuisance alarms. That is normal for a new installation and is exactly why the burn-in week sends alarms to the installer first.
Reviewing trends well
Trend review can swallow hours without finding anything. Ivo's method was the one BAS-220 and BAS-330 taught, applied to acceptance.
- Check the data first: every point recording, no gaps, timestamps right.
- Plot each system's key values with their setpoints, one day per screen, and look at mornings, afternoons and nights separately.
- Use the acceptance criteria to count, not just to look. Counting samples in a band turns an impression into a result.
- Use scatter plots for relationships that do not depend on time: damper against outdoor temperature, valve against load, airflow against setpoint.
- When something looks wrong, check it with a faster trend or a site visit before changing anything.
- Record every finding in the issues log, including the ones that pass, so the report can show what was checked.
The trends also become a baseline. Philippa's final report will include the burn-in plots, and the warranty review in September 2027 (a plan) will compare the same plots from that summer, so that any drift in performance is visible against a known good week.
Trend checks that need no witness
Some checks are better done entirely from trends, and Philippa's plan said which functional test steps could be passed that way. Two examples from Marlow Lane show the idea.
- Schedules. The plan required each system's occupied, unoccupied and warm-up modes to start at the right time every day. Instead of standing in a mechanical room at 6:00 each morning, Philippa read the mode trend for all five weekdays and the weekend. Every start matched the schedule, and the weekend showed the unit off except for one night low limit cycle on the coldest night.
- Simultaneous heating and cooling. A VAV system with reheat always reheats some air, by design, but the reheat should be modest when the supply air temperature reset is working. Philippa plotted the number of boxes with their reheat valves open against AHU-1's supply air setpoint for each occupied hour. When many boxes were reheating, the reset had raised the supply air temperature, which is the behavior the sequence asks for. A plot showing many boxes reheating while the supply air stayed at its minimum would have been a finding.
A trend-based step still needs a written criterion and a record. Philippa's sheet for the schedule step listed each day, the scheduled start, the actual start from the trend and a pass for each, with the plot attached. It reads like a witnessed test because, in effect, it is one, witnessed by the data.
The limits of trend checks are equally clear. A trend can only show what happened. It cannot show what the system would do in a failure that did not occur, which is why sensor failures, safety trips and loss of communication are always tested deliberately and witnessed.
Common mistakes
MistakeStarting a trend period without checking the trends on day one.
InsteadCheck every point is recording at the right interval on the first morning; problems found at the end mean repeating the period.
MistakeUsing a trend interval too long to see the behavior being checked.
InsteadSample at least five times per cycle of any oscillation you need to see, and use a fast trend when needed.
MistakeJudging trends by eye against vague criteria.
InsteadUse numerical criteria and count samples, using occupied hours for steady-state criteria.
MistakeTreating a burn-in week's alarms as noise to delete.
InsteadEach alarm has a cause. Fix the nuisance causes and record the real events.
Summary and key terms
- Trends verify performance over days of real operation, catching problems that a short witnessed test cannot.
- The trend list, intervals, collection and retention should be planned and checked on the first day.
- Acceptance criteria for trends must be numerical and are usually applied to occupied hours.
- Scatter plots show relationships such as economizer position against outdoor temperature.
- The burn-in week's trends and alarm review are part of the commissioning record and a baseline for later.
- Trend verification
- Using recorded trend data over a period of real operation to check performance against acceptance criteria.
- Burn-in period
- A period before handover when the new controls run the building unattended while the installer watches trends and alarms.
- Fast trend
- A trend at a short interval, used temporarily to see quick behavior such as an oscillating loop.
- Nuisance alarm
- An alarm that does not reflect a real problem needing action, usually caused by a wrong delay, limit or configuration.
- Scatter plot
- A plot of one value against another, without time, used to check relationships.
Practice problems
Work each problem on paper first, then reveal the answer to check.
Why did Ivo set trend collection every hour when the buffers would last about 16 hours?
Show answer
To leave a large margin, so that a missed collection or a front-end restart would not lose data.
A valve oscillates with a period of about 300 s. What is the longest trend interval that will show it clearly?
Show answer
300 ÷ 5 = 60 s, so 1 minute at most; a shorter interval is better.
Why are steady-state criteria applied to occupied hours only?
Show answer
Warm-up and setback periods are deliberately away from the occupied setpoints, so including them would count normal operation as failure.
Lesson quiz · 5 questions
Score 60% or more to complete this lesson.
Create a free account to save your progress, take quizzes and earn a certificate.