
BAS-330 · Lesson 8 of 12 · 25 min
Analytics platforms and dashboards
▶ Video coming soon A video version of this lesson is on the way.
The fault detection vendor's quote for Ninefield had been sitting in Declan's folder since September, when Sophie mentioned it during the tagging session in BAS-320. After the room 108 rule, Callie wanted to know what a platform like that actually did that the front end could not. Declan gave her the quote, the vendor's sample reports and an afternoon to read them, and they went through it together the following week.
What an analytics platform is
An analytics platform is software that collects data from the building automation system and meters, stores it, runs fault rules and calculations on it, and presents the results. It may run on a server in the building, on the owner's network, or, most often now, as a hosted service in the cloud that reads data through a gateway installed on site.
A front end can trend, alarm and report, so the question is fair. The difference is mainly in what happens after the data is collected.
| Task | Typical front end | Typical analytics platform |
|---|---|---|
| Real-time view and commands | Its main job | Usually none, or read-only |
| Histories | Kept for months to a few years | Kept for years, for many sites in one place |
| Fault rules across many points | Limited; usually alarms on single points | Hundreds of rules applied to every piece of equipment by type |
| Energy calculations | Simple totals | Baselines, weather normalization, cost of faults |
| Comparing buildings | Rarely | Portfolios of buildings compared side by side |
| Audience | Operators and technicians | Energy managers, owners, service contractors, technicians |
Getting the data in
The data pipeline is where analytics projects succeed or fail. Four questions come first.
- Which points? Every rule needs specific points: for the reheat leak rule, the supply air temperature, discharge temperature, valve command, airflow and mode. A point list built from the rules, rather than from everything available, keeps the project focused.
- How often? Most energy analytics work at 5- or 15-minute intervals. Rules for hunting loops need shorter intervals, a minute or less, and may be better done in the controller.
- How is equipment identified? The platform has to know that a point is a discharge air temperature on a VAV box served by a particular air handler. That is what the tagging covered in BAS-320 provides: Haystack tags or a Brick model let the platform apply the right rules automatically. Untagged points must be mapped by hand, which is the largest single cost in many projects.
- How is it connected securely? The gateway should read data only, connect outbound through the building's firewall to the platform, and be managed under the same rules as any other remote access, as BAS-320 described. Any ability to write back to the BAS needs a separate decision.
Ninefield's tower had about 1,800 points that the vendor's rules would use. The 2022 programs for the penthouse air handlers and the new rooftop unit controllers were already tagged; the older 1998 tower points were not, which is why tagging them was a separate line in the 2027 proposal.
What the quote cost
Worked problem
Reading the vendor's quote
The vendor charges a sample 0.40 dollars per point per month for 1,800 points, plus a one-time onboarding fee of 6,000 dollars. What is the first-year cost, and what saving does the platform need to find to pay for itself in that year?
Show solution
- Subscription: 1,800 × 0.40 × 12 = 8,640 dollars a year.
- First year: 8,640 + 6,000 = 14,640 dollars.
- At a blended electricity cost of about 0.12 dollars per kWh, the platform needs to find and fix faults worth 14,640 ÷ 0.12 = 122,000 kWh in the first year.
Answer: About 14,640 dollars in the first year and 8,640 dollars a year after. That needs about 122,000 kWh of savings in the first year, about 4 in 100 of Ninefield's electricity, which is plausible but not automatic. The cost of fixing the faults is extra.
Declan's view was that a platform pays only if someone acts on what it finds. The quote did not include anyone's time to review the fault list each week or to fix the faults. He priced that separately, as a monthly service visit from Quillon, and presented the two together, because a subscription without the service would produce a list that nobody worked through.
Key performance indicators
A dashboard shows a small number of key performance indicators (KPIs), each one answering a question someone actually asks. For a building like Ninefield, a useful set is:
| KPI | Calculation | Question it answers |
|---|---|---|
| Energy use intensity, rolling 12 months | Last 12 months of energy ÷ floor area | Is the building improving year on year? |
| Base load ratio | Average unoccupied kW ÷ average occupied kW | Is equipment running when nobody is there? |
| Peak demand this month | Highest 15-minute kW so far | Are we heading for an expensive month? |
| After-hours share | Energy outside occupied hours ÷ total energy | How much do we spend on an empty building? |
| Chiller plant efficiency | Plant kW ÷ tons of cooling, while cooling | Is the plant running efficiently? |
| Chilled water delta-T | Return − supply temperature, flow-weighted | Is low delta-T still a problem? |
| Comfort | Zone-hours outside ±3 °F of setpoint during occupancy | Are savings costing comfort? |
| Open faults | Number of active faults and their estimated cost per month | What should maintenance do next? |
Worked problem
Ninefield's base load ratio
Ninefield's average demand is about 150 kW unoccupied and about 600 kW occupied. What is the base load ratio, and what would it be with a 110 kW base?
Show solution
- Now: 150 ÷ 600 = 0.25.
- With a 110 kW base: 110 ÷ 600 = 0.18.
Answer: A ratio of 0.25 is typical for an older office building; well-run offices are often below 0.2. The ratio is a useful KPI because it is independent of the weather and of the building's size.
Comfort belongs on every energy dashboard. A program that saves energy by letting zones drift out of range will save it only until the complaints start, and then the setpoints will be put back by people in a hurry, usually further than before. Showing comfort beside energy keeps the savings honest.
Designing a dashboard
The principles of high-performance graphics from BAS-320 apply to dashboards too, with a few additions for energy data.
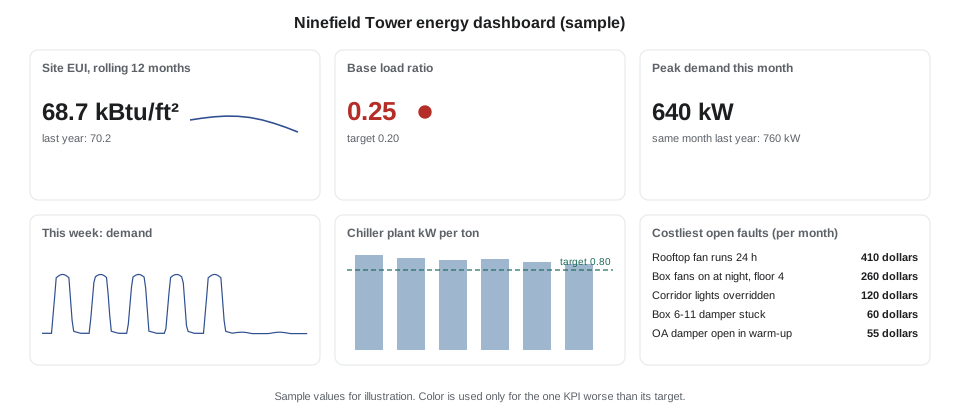
- Every number has a comparison: a target, last year, or a similar building. A number on its own tells nobody whether to act.
- Normalize what can be normalized: per floor area, per degree-day, per hour of operation.
- State the period and the data's freshness: "last 12 months to October 31", "updated 06:00 today".
- Use color only for exceptions, as on a high-performance graphic.
- Show cost in money where the audience thinks in money, and in kWh or ekWh where it does not.
- Link each KPI to the evidence: a click on the base load ratio should open the load profile.
Different audiences need different dashboards. Ilona needed a monthly page: energy and cost against last year, the peak, comfort, and the open faults with their cost. Quillon's technician needed a fault list with evidence trends. Tenants might one day see a page of their own floor's after-hours use, which would have settled the 7th-floor dispute in an afternoon.
Reports
Most of the value of analytics is delivered in a regular report and a meeting, not on a screen nobody opens. Declan's proposed monthly report for Ninefield was one page: energy, demand and cost against the same month last year, adjusted for weather; the base load ratio; the five costliest open faults; faults fixed since last month and their estimated savings; and comfort hours. It would be reviewed in a short monthly call with Ilona and Quillon's service technician.
Analytics that write back
Some platforms can also write to the BAS, for example to apply an optimized supply air or chilled water setpoint calculated in the cloud. That is sometimes called supervisory control or active optimization. It can save energy that rules alone cannot, but it changes the building's control from outside, so it needs more care.
- Writes should go to a defined set of points, at a defined priority below operators and safeties, with limits on every value.
- If the connection to the platform is lost, the building must fall back to its own control within a short time, with a heartbeat point as described in BAS-310.
- Every write should be logged, and the owner and the service contractor must agree who is responsible for the result.
Declan did not propose writes for Ninefield. The resets would be programmed in the building's own controllers, where Quillon could test them and where they would keep running whatever happened to the internet connection.
Choosing a platform
| Question | Why it matters |
|---|---|
| Which rules does it include for our equipment types? | Rules out of the box save configuration time |
| Can we see and edit the rules? | Transparent rules can be checked and tuned |
| How does it estimate fault cost? | Ranking depends on it |
| How is data connected, and is it read-only? | Security and responsibility |
| Who owns the data, and can it be exported? | Changing vendors should not lose the history |
| What does tagging or mapping cost? | Often the largest project cost |
| Who reviews the faults and fixes them? | The platform saves nothing on its own |
Data quality for analytics
An analytics platform amplifies whatever is in its data. A sensor that reads two degrees high makes every rule that uses it unreliable; a point mapped to the wrong equipment produces faults on equipment that is working perfectly. The first month on a new platform is mostly spent finding those problems.
| Problem | How it shows up | Fix |
|---|---|---|
| Wrong units or scaling | Values that are impossible, such as a supply air temperature of 130 | Correct the point's units in the BAS or the mapping |
| Wrong equipment mapping | Faults that make no physical sense | Check tags against the drawings and the controller program |
| Stale values | Flat lines for hours or days | Find the communication fault; mark data as stale |
| Missing points | Rules that cannot run for some equipment | Add the points or accept reduced coverage |
| Clock errors | Events shifted in time relative to the meter | Synchronize controllers to a time server |
| Sensor faults | A cascade of related faults | Run sensor-check rules first and repair sensors |
The first three months on a platform
Vendors and contractors who have connected many buildings describe a similar pattern, and Declan built the Ninefield proposal around it.
- Month one: connect, map and tag the points; correct data problems; turn on the rules for the main equipment; expect a long list of faults, many of them data problems.
- Month two: tune the rules that produce false faults; agree with the owner which faults matter; start the weekly review and issue the first work orders.
- Month three: fix the largest faults; confirm they clear; report the first savings estimates; settle into a monthly report and call.
"The first list will be embarrassing," Declan warned. "Every building looks terrible on day one. Tell the owner that before you show it to them, or they will think the platform is broken, or that you are."
Worked problem
Sizing the weekly review
Quillon expects about 120 active faults at Ninefield after the first month's tuning, with about 10 new faults a week. If a technician needs about 6 minutes to review the evidence for each fault and decide what to do, how long does the weekly review take once the backlog is cleared?
Show solution
- New faults per week: 10.
- Review time: 10 × 6 = 60 minutes.
- Clearing the backlog of 120 at the same rate: 120 × 6 = 720 minutes, about 12 hours, spread over the first month.
Answer: About an hour a week once the backlog is cleared, plus the time to fix the faults. Declan priced a monthly service visit with an hour of review each week done remotely.
The same estimate showed why ranking matters: with 120 faults, nobody can fix them all at once, and the ten most costly usually account for most of the waste.
Callie asked what she would actually do in that hour. Declan described it: open the fault list sorted by cost, read each new fault's evidence trend, decide whether it is real, a data problem or already known, and either raise a work order, correct the data, or tune the rule. A fault that has been open for more than a month without a work order gets a line in the monthly report, so that the owner sees what is waiting and why. The platform does the searching; the technician does the judging.
Common mistakes
MistakeCollecting every point the system has.
InsteadBuild the point list from the rules and questions the platform must answer.
MistakeBuying a subscription with no service to act on the findings.
InsteadPrice the weekly review and the fixes together with the platform.
MistakeShowing numbers without comparisons.
InsteadGive every KPI a target, last year's value or a benchmark.
MistakeLeaving comfort off an energy dashboard.
InsteadShow comfort beside energy so savings stay honest.
MistakeAllowing cloud writes with no fallback.
InsteadLimit writes, log them, and fall back to local control on loss of connection.
Summary and key terms
- Analytics platforms collect, store and analyze BAS and meter data, often as a hosted service.
- The data pipeline depends on choosing points by rule, suitable intervals, tagging and a secure read-only connection.
- Platforms pay only when someone reviews the findings and fixes the faults.
- KPIs answer specific questions: EUI, base load ratio, peak, after-hours share, plant efficiency, comfort and fault cost.
- Dashboards need comparisons, normalization, freshness and restrained color.
- A regular one-page report and meeting deliver most of the value.
- Supervisory writes from a platform need limits, priorities, logging and a local fallback.
- Analytics platform
- Software that collects building data and runs rules and calculations on it.
- Gateway
- A device on site that reads BAS data and sends it to a platform.
- Key performance indicator (KPI)
- A measured value that shows progress toward a goal.
- Base load ratio
- Average unoccupied demand divided by average occupied demand.
- Normalization
- Adjusting a value for size, weather or hours so it can be compared.
- Dashboard
- A page of KPIs and charts designed for a particular audience.
- Supervisory control
- Setpoints written to the BAS by an outside optimization system.
- Onboarding
- Connecting, mapping and configuring a building on a platform.
Practice problems
Work each problem on paper first, then reveal the answer to check.
A platform costs 0.35 dollars per point per month for 2,400 points. What is the annual subscription?
Show answer
2,400 × 0.35 × 12 = 10,080 dollars.
Unoccupied average 90 kW, occupied 400 kW. What is the base load ratio?
Show answer
90 ÷ 400 = 0.225.
Why should every KPI have a comparison?
Show answer
A number alone does not show whether to act.
Why keep platform connections read-only by default?
Show answer
Security, and so control responsibility stays clear.
Name two things a monthly energy report should include.
Show answer
Energy and cost vs last year, peak, base load ratio, costliest faults, faults fixed, comfort.
Lesson quiz · 5 questions
Score 60% or more to complete this lesson.
Create a free account to save your progress, take quizzes and earn a certificate.