
AWS-129 · Lesson 5 of 12 · 26 min
Domain 2 review: business cases and investment
▶ Video coming soon A video version of this lesson is on the way.
Lorraine joined the fifth session, which was fitting, because it was about money. Task 2.2 of the exam guide is "measure and demonstrate AI business value", and it covers five skills: defining KPIs, setting baselines, calculating return on investment, identifying leading indicators and controlling costs. The exam will not ask for long calculations, but it will ask you to choose the right measure, spot a flawed business case and interpret simple figures. Andre's no-show business case from the autumn makes a good review vehicle.
KPIs: tangible, intangible and guardrails
Skill 2.2.1 asks you to define key performance indicators that capture both tangible benefits, such as cost reduction and revenue growth, and intangible benefits, such as customer satisfaction and employee productivity. Tangible benefits can be expressed directly in money. Intangible benefits are real but harder to price, so they are usually measured with surveys, scores or proxies and reported alongside the money, not converted into it with invented exchange rates.
A complete KPI set also includes guardrail measures: things that must not get worse. For an assistant that drafts clinical notes, the outcome KPI might be minutes saved per note and the guardrail might be the rate of clinically important omissions found in an audit sample. A pilot that saves time while raising omissions has not succeeded.
| KPI type | Example for the no-show initiative | How it is measured |
|---|---|---|
| Tangible outcome | Recovered appointments and their contribution margin | Appointment records and finance data |
| Intangible outcome | Client satisfaction with reminders | Short post-visit survey |
| Leading indicator | Share of flagged bookings that reception actually contacts | Weekly report from the reminder workflow |
| Guardrail | Complaints about excessive contact; opt-out rate | Complaint log and messaging system |
Baselines and estimating the effect
Skill 2.2.2 is about establishing baseline metrics before AI is introduced. Without a baseline, any later number is uninterpretable: a no-show rate of 6 in 100 is good news only if it used to be higher. A sound baseline covers a long enough period to include normal variation, such as seasons and holidays, and is measured the same way the later result will be.
Even a good baseline is not enough on its own, because other things change at the same time. If no-shows fall during a pilot that starts in spring, some of the fall may simply be the season. The stronger method compares the change at pilot sites with the change at similar sites that did not get the tool. This is called a comparison group, and the difference between the two changes is the estimated effect.
Worked problem
Estimating an effect with a comparison group
During a three-month pilot, no-shows at four pilot clinics fell from 7.0 to 5.6 per 100 appointments. Over the same months at four similar clinics without the tool, they fell from 7.2 to 6.9. What is the estimated effect of the tool?
Show solution
- Change at pilot clinics:
- \[5.6 - 7.0 = -1.4\]
- Change at comparison clinics:
- \[6.9 - 7.2 = -0.3\]
- Estimated effect: subtract the comparison change from the pilot change.
- \[-1.4 - (-0.3) = -1.1\]
Answer: The tool is estimated to reduce no-shows by about 1.1 per 100 appointments. Crediting the tool with the full 1.4 would overstate its effect by including the seasonal fall seen everywhere.
Return on investment
Skill 2.2.3 asks for ROI calculated with a comprehensive framework that accounts for time savings, cost reduction, revenue growth and productivity gains. The exam's interest is less in formulas than in honest inputs: benefits counted at contribution margin rather than full price, all costs over the whole life of the solution (not only the license), and time savings counted as money only if the time is actually redeployed or the cost actually avoided.
| Item | No-show initiative (illustrative) |
|---|---|
| Recovered appointments per year | 1,480 |
| Contribution margin per appointment | 90 dollars |
| Annual benefit | 133,200 dollars |
| One-time cost (integration, training, setup) | 70,000 dollars |
| Running cost per year (service, support, monitoring) | 34,000 dollars |
| Net benefit per year | 99,200 dollars |
Worked problem
Payback, net present value and ROI
Using the figures above, a three-year life and a discount rate of 0.08, calculate the payback period, the three-year net present value and the three-year ROI.
Show solution
- Payback: one-time cost divided by annual net benefit, in months.
- \[\frac{70{,}000}{99{,}200} \times 12 \approx 8.5 \text{ months}\]
- Net present value: discount each year's net benefit and subtract the one-time cost.
- \[99{,}200 \Bigl( \frac{1}{1.08} + \frac{1}{1.08^2} + \frac{1}{1.08^3} \Bigr) - 70{,}000\]
- \[= 99{,}200 \times 2.5771 - 70{,}000 \approx 255{,}648 - 70{,}000 = 185{,}648\]
- ROI over three years: total benefits minus total costs, divided by total costs.
- \[\frac{3(133{,}200) - (70{,}000 + 3 \times 34{,}000)}{70{,}000 + 3 \times 34{,}000} = \frac{399{,}600 - 172{,}000}{172{,}000} \approx 1.32\]
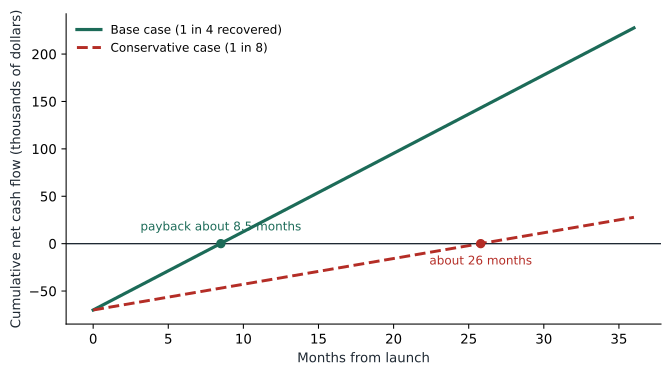
Answer: Payback is about 8.5 months, the three-year net present value is about 185,648 dollars, and ROI is about 1.32, meaning each dollar spent returns about 1.32 dollars of net gain over three years.
Any business case should also show what happens if the key assumption is wrong. In Andre's case the uncertain assumption was how many flagged clients would actually keep a rebooked slot. At one in four the case was strong; at one in eight the net present value fell to about 14,000 dollars and payback stretched past two years; below about one in nine it would not pay. This sensitivity analysis is what lets a board approve a pilot with stop conditions rather than a full rollout on faith.
Leading indicators
Skill 2.2.4 asks you to identify leading indicators: early signals that predict whether an initiative will succeed, long before the final financial result is known. Lagging indicators, such as annual profit, arrive too late to steer a pilot. Good leading indicators for AI initiatives include adoption (are people using the tool?), follow-through (are they acting on its outputs?), output quality (how often do reviewers accept drafts without major edits?) and early movement in the target measure. A model with excellent accuracy and low adoption is heading for failure.
Cost controls
Skill 2.2.5 covers basic cost planning and optimization. The exam expects a business-level grasp of how AI services are priced and which AWS tools help control spending.
| Pricing pattern | How cost behaves | Typical example |
|---|---|---|
| Consumption-based | Rises with use, such as per token, per page or per minute; little or nothing when idle | Generative AI model calls, document extraction |
| Instance or capacity-based | Fixed per hour while capacity is reserved, whether used or not | A dedicated model endpoint, provisioned throughput |
| Seat-based | Per user per month | An AI assistant licensed to each employee |
| Commitment discounts | Lower rate in exchange for committed steady usage over a term | Savings Plans for steady compute use |
| AWS tool or practice | What it does for cost control |
|---|---|
| AWS Pricing Calculator | Estimates costs before building, from expected usage |
| Cost allocation tags | Label resources by project or owner so costs can be attributed |
| AWS Budgets | Sets spending limits and sends alerts when actual or forecast costs exceed them |
| AWS Cost Explorer | Shows spending over time, broken down by service and tag, to find trends and waste |
| Right-sizing and model choice | Using the smallest model or capacity that meets the quality requirement |
| Prompt and caching discipline | Shorter prompts and reuse of repeated results reduce token use |
A frequent exam pattern describes costs rising faster than expected after launch and asks what to do. The best answers usually combine visibility (tags and Cost Explorer to find where the money goes), control (Budgets with alerts) and optimization (a smaller model for simple requests, shorter prompts, or a commitment for steady use). Turning the system off is rarely the best first answer.
Practice scenarios for measurement and investment
Lorraine stayed for the practice items. She said afterwards that they were the most useful part of the course for her, because they showed the questions finance would ask of any AI proposal.
Worked problem
Practice: the missing baseline
A call center launched an AI assistant in March. In June, handling time per call is 6.1 minutes. Leadership asks whether the assistant worked. No handling-time data was collected before March. What is the best response?
Show solution
- Without a baseline, 6.1 minutes cannot be compared with anything, so the effect cannot be stated.
- Possible recovery: use historical system logs if they exist, or compare with teams that have not yet received the assistant.
- For future initiatives, the lesson is skill 2.2.2: establish the baseline before launch, using the same measure.
Answer: Explain that the effect cannot be measured reliably yet; reconstruct a baseline from logs or comparison teams if possible, and require baselines before future launches.
Worked problem
Practice: comparing two proposals
Two AI proposals compete for the same budget. Proposal A costs 120,000 dollars up front and returns a net 60,000 dollars a year. Proposal B costs 40,000 dollars up front and returns a net 25,000 dollars a year. Both last three years. Compare their payback periods and their total undiscounted net gain.
Show solution
- Payback A:
- \[\frac{120{,}000}{60{,}000} = 2.0 \text{ years}\]
- Payback B:
- \[\frac{40{,}000}{25{,}000} = 1.6 \text{ years}\]
- Three-year net gain A:
- \[3 \times 60{,}000 - 120{,}000 = 60{,}000\]
- Three-year net gain B:
- \[3 \times 25{,}000 - 40{,}000 = 35{,}000\]
Answer: B pays back faster (1.6 years against 2.0), but A produces the larger total gain over three years (60,000 dollars against 35,000). The right choice depends on the organization's priorities, its appetite for risk and whether the money could fund B plus something else.
This item shows why exam questions often ask which measure best supports a particular decision rather than which project is better. Payback favors quick, small wins; net present value favors larger total value; a risk-averse organization early in its AI journey may sensibly choose the faster payback even at a lower total.
Worked problem
Practice: the cost spike
A company's generative AI bill tripled in the month after it opened an internal assistant to all staff. Most requests are short questions about HR policies. Which combination of actions is most appropriate?
Show solution
- Visibility: tag the assistant's resources and use Cost Explorer to confirm which requests drive cost.
- Control: set a budget with alerts through AWS Budgets.
- Optimization: route short, simple questions to a smaller, cheaper model, retrieve only the relevant policy passage instead of whole documents, and cache answers to frequent questions.
- Avoid: shutting the assistant down or committing to long-term capacity before usage is understood.
Answer: Tag and analyze, set budgets and alerts, then use a smaller model, shorter retrieved context and caching for simple questions.
A note on intangible benefits
Exam questions sometimes offer an option that converts an intangible benefit into a precise dollar figure, such as valuing a one-point rise in staff satisfaction at a fixed sum. Be wary. Converting intangibles is not wrong in principle, but it needs a credible link, such as a measured relationship between satisfaction and staff turnover and a known cost of replacing a technician. Without that link, the stronger answer reports the intangible measure alongside the financial case and lets decision makers weigh it. Andre's draft board summary does exactly this: lower overnight paperwork is reported with survey results, while only overtime actually avoided goes into the money column.
The same caution applies to productivity gains. A tool that lets each analyst complete reports faster creates value only if the extra capacity is used: more reports, faster decisions, or work moved in from contractors. A comprehensive ROI framework includes productivity gains, as the exam guide says, but counts them in the form they will actually take.
A last check before trusting any ROI figure in an exam option: ask whether the costs include running and support costs for every year, not just the first, and whether the benefits start on day one or ramp up as adoption grows. Business cases that assume full benefits from the launch date usually overstate value in the first year, which also shortens the apparent payback period.
Common mistakes
MistakeCount every hour saved at full salary cost.
InsteadTime savings count as money only when the time is redeployed or a cost is actually avoided.
MistakeUse the no-show reduction at pilot sites as the tool's effect.
InsteadSubtract the change at comparison sites to remove seasonal and other effects.
MistakeModel accuracy is the best leading indicator.
InsteadAdoption, follow-through and output acceptance predict success better than accuracy alone.
MistakeTotal cost of ownership is the license price.
InsteadInclude integration, training, support, monitoring, usage and eventual exit costs.
Summary and key terms
- Define tangible and intangible KPIs plus guardrails.
- Set a baseline before AI starts, and use a comparison group to separate the tool's effect from other changes.
- Calculate ROI with honest inputs: margin, full life-cycle costs, and time savings only when captured.
- Show payback, net present value and sensitivity to the key assumption.
- Track leading indicators such as adoption and follow-through.
- Control costs with the Pricing Calculator, tags, Budgets and Cost Explorer, and optimize model choice, prompts and commitments.
- Baseline
- The value of a measure before a change, used to judge the change's effect.
- Comparison group
- Similar units that did not receive the change, used to estimate what would have happened anyway.
- Leading indicator
- An early signal that predicts later success, such as adoption.
- Guardrail metric
- A measure that must not get worse while the main KPI improves.
- Sensitivity analysis
- Testing how results change when an uncertain assumption changes.
- AWS Budgets
- An AWS tool that sets spending limits and alerts when they are exceeded.
Practice problems
Work each problem on paper first, then reveal the answer to check.
Why is a baseline alone not enough to show an AI tool's effect?
Show answer
Other changes, such as season, happen at the same time; a comparison group separates the tool's effect.
Which AWS tool would you use to be alerted when a project's forecast spending exceeds its limit?
Show answer
AWS Budgets.
A vendor says its tool saves 2,000 staff hours a year. What should a strategist ask?
Show answer
What the time will be used for and whether any cost is actually avoided, before counting it as money.
Lesson quiz · 5 questions
Score 60% or more to complete this lesson.
Create a free account to save your progress, take quizzes and earn a certificate.