
ARCH-301 · Lesson 9 of 12 · 23 min
Energy and carbon analysis
In week nine Priyanka Sethi and Mei Takahashi come to the studio together, because, Sethi says, energy and carbon are two halves of one question: how much harm does the building do to the climate over its life, and how much of that harm can the design prevent? Sethi has built a detailed energy model of each student's building from their current drawings, with the real window areas, the wall and roof values from the envelope lesson, the heat pumps, ventilation and controls from the mechanical lesson, and schedules of occupancy from the brief. Takahashi has run a first life cycle assessment of each structure and envelope, using the quantities the students have taken off their models. They pin the results next to each student's drawings, and the room goes quiet for a while as the students read them.
What the targets measure
The brief sets three targets that this lesson tests. The first is an energy use intensity of no more than 20.6 kBtu/ft² a year, measured at the building's meter: the total energy the building uses, divided by its gross floor area. The second is that no fuel is burned on site, so that all of that energy is electricity. The third is an embodied carbon of the structure and envelope, stages A1 to A3, at least 30% below a conventional concrete baseline. Sethi reminds the class what the stages mean, from the materials course. A1 to A3 cover the extraction of raw materials, their transport to the factory and the manufacture of products, up to the factory gate. Later stages cover transport to site and construction, A4 and A5; use, maintenance and replacement over the building's life, B; demolition and disposal at the end, C; and the potential for reuse and recycling beyond, D. The targets of the Commons, like most current policies, are set on A1 to A3 because those are the stages with the best data, and because they are usually the largest share of embodied carbon.
Reading the energy model
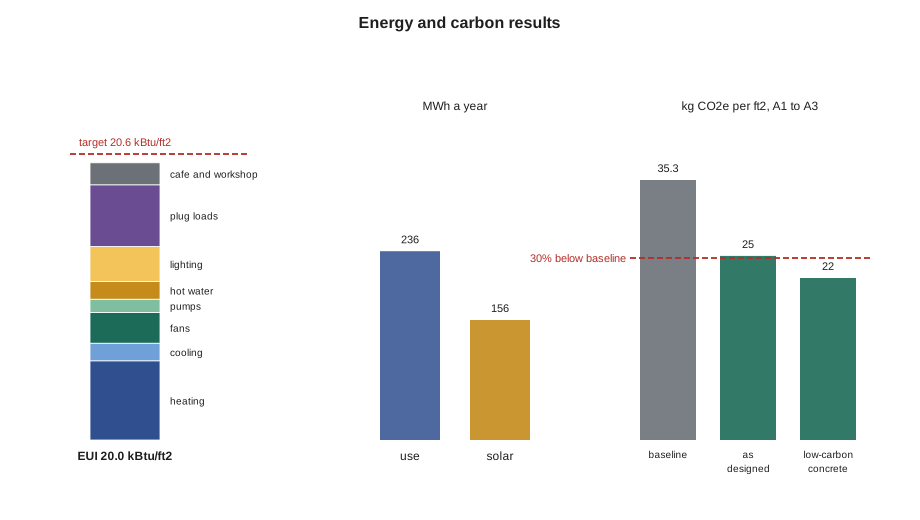
Callum's building, as modeled, uses about 20.0 kBtu/ft² a year, just inside the target. Sethi asks him to look at where the energy goes before celebrating. The largest single use is still heating, at about 5.7 kBtu/ft². It would be much larger without the heat recovery ventilator and the ground-source heat pumps; the energy model shows heating would roughly double with an ordinary ventilator and electric resistance heat. The second largest is plug loads, the computers, printers, chargers, screens and equipment of a building where many people come to use technology, at about 4.4 kBtu/ft². Lighting is third, even with LED fixtures and daylight dimming. Fans, pumps, cooling, hot water and the café and makerspace make up the rest.
Sethi asks the class what this means for design. Some of these uses are the architect's to reduce: the window share, the envelope, the daylight that lets lights be dimmed, the compactness of the ducts that sets fan energy, the location of the plant room that sets pump energy. Some belong to the mechanical engineer: the efficiency of the equipment, the controls, the heat recovery. And some belong to the people who will run and use the building, such as the plug loads and the schedules. A building that meets its target in a model and misses it in operation usually does so because the people running it were never told how it was meant to work. Sethi asks Callum to add a page to his documents, a short operating guide for the city's facilities staff: what the systems are, how the controls should be set, and what the building's energy use should be in each month.
She also shows the class how sensitive the result is. In the model, raising the window share back to the 43% of the schematic design raises the energy use intensity by about 1.6 kBtu/ft², enough to miss the target. Removing the daylight dimming adds about 1 kBtu/ft². Replacing the heat recovery ventilator with one of lower effectiveness, 0.6 instead of 0.8, adds about 1.3 kBtu/ft². Doubling the airtightness test result adds about 0.6 kBtu/ft². None of these alone is dramatic, but together they show how a building that meets its target by a narrow margin can miss it through a series of small concessions during design and construction. Sethi's advice is to design for a margin of about 10% below the target, because the margin will be spent.
Operating carbon in two grids
The carbon from operating the building depends on the carbon intensity of the electricity it uses, and here the two cities part company. Minnesota's grid still burns coal and natural gas for part of its electricity, with an emission factor in recent years of roughly 0.4 kg CO₂e per kWh, falling as coal plants close and wind and solar grow. An all-electric building in Minneapolis therefore has a significant operating carbon, and every kilowatt-hour saved or generated on site reduces it. The script below combines the modeled energy use, the output of a 120 kW rooftop solar array and the grid factor to estimate the operating carbon, and then compares the embodied carbon of the timber design with the concrete baseline.
# Commons: modeled energy use, operating carbon and embodied carbon
area = 40400                                   # gross floor area (ft2)
ends = {"heating": 5.7, "cooling": 1.3, "fans": 2.2, "pumps": 1.0, "hot water": 1.3,
        "lighting": 2.5, "plug loads": 4.4, "cafe and makerspace": 1.6}     # kBtu/ft2
eui = sum(ends.values())
print(f"EUI {eui:.1f} kBtu/ft2 (target 20.6); largest uses: "
      + ", ".join(k for k, v in sorted(ends.items(), key=lambda kv: -kv[1])[:3]))
kwh = eui * area / 3.412
pv = 120 * 1300                             # rooftop array (kW) times annual yield (kWh per kW)
grid = 0.38                                    # grid emission factor, kg CO2e per kWh (approximate)
op = (kwh - pv) * grid
print(f"use {kwh:,.0f} kWh a year; solar {pv:,.0f} kWh ({pv / kwh:.0%}); "
      f"operating carbon {op / 1000:,.1f} t a year, {op / area:.2f} kg per ft2")
# Embodied carbon of structure and envelope, stages A1 to A3, kg CO2e per ft2 of floor
baseline = 35.3                                # conventional concrete frame
timber = {"glulam and CLT": 8.8, "concrete cores and foundations": 6.5, "topping": 1.4, "envelope": 7.9}
for label, cores in (("as designed", timber["concrete cores and foundations"]),
                     ("low-carbon concrete in cores and foundations", timber["concrete cores and foundations"] * 0.67)):
    total = timber["glulam and CLT"] + cores + timber["topping"] + timber["envelope"]
    print(f"{label:<45} {total:5.0f} vs baseline {baseline}: {1 - total / baseline:.0%} lower")
years = 60
print(f"over {years} years: operating {op * years / area:,.0f}, embodied about {total:.0f} kg per ft2")EUI 20.0 kBtu/ft2 (target 20.6); largest uses: heating, plug loads, lighting use 236,811 kWh a year; solar 156,000 kWh (66%); operating carbon 30.7 t a year, 0.76 kg per ft2 as designed 25 vs baseline 35.3: 30% lower low-carbon concrete in cores and foundations 22 vs baseline 35.3: 36% lower over 60 years: operating 46, embodied about 22 kg per ft2
The comparison of the two lines at the end is the most important result of the lesson. In Minneapolis, the operating carbon over sixty years at today's grid factor would be about twice the embodied carbon of the structure and envelope, although the grid's decarbonization will reduce it. Both halves matter: the efficiency and the solar array reduce the larger share, and the timber structure reduces the share that is spent before the building opens and cannot be recovered. Takahashi points out that the solar array has a value beyond its output: on a grid that is decarbonizing, the panels displace the most carbon in the next ten years, when the grid is dirtiest, and they keep the batteries charged for the winter refuge room.
Embodied carbon
Takahashi's life cycle assessment of Callum's structure and envelope gives about 25 kg CO₂e/ft² for stages A1 to A3, against about 35 for a conventional concrete building of the same size and program. That is 30% lower, exactly at the target, which is too close for comfort. She breaks the total down. The glulam and CLT, counted without the carbon stored in the wood, are about a third. The concrete cores, piles or footings and grade beams are about a quarter, a large share for so little of the building's volume, because cement is so carbon-intensive. The envelope, with its insulation, cladding, windows and membranes, is about a third. The concrete topping on the floors is the rest.
The quickest gain is in the concrete. In the materials course Ingrid designed a low-carbon mix for the community hub, using Type IL Portland-limestone cement with a share of slag, which reduced the carbon of the concrete by about a third. The same approach in the cores and foundations of the Commons lowers the total to about 22, 36% below the baseline, which gives the margin Sethi asked for. Takahashi suggests further steps for the students to test: brick only where it earns its place, at the base of the avenue wall, rather than all the way up; mineral wool rather than foam insulation where it performs as well; fiberglass window frames rather than aluminum ones, as Joon-ho found in the materials course; and a gypsum topping instead of concrete if the acoustic and vibration checks allow it.
She also warns against two common errors. The first is counting the carbon stored in the timber, its biogenic carbon, as a reduction at stage A1 without also counting its release at the end of the building's life; standards and policies differ on how to report it, and the honest practice is to report it separately. The second is comparing against a baseline that no one would build, which makes any design look good. The baseline for the Commons is a building that a competent design team would have produced ten years ago: a concrete frame with flat plates, steel stud walls with exterior insulation and aluminum windows, and conventional concrete mixes.
Daylight and comfort in the model
The energy model is not the only one. Sethi has also run a daylight simulation and a comfort check. The daylight results confirm the massing lesson: the saw-toothed roof lights the makerspace and the upper floor evenly, and the library's ground floor is daylit along both long walls, but the middle of the library, about 39 feet from either wall, is darker than the brief wants. The share of regularly occupied area with useful daylight is 54%, just over the target. Callum adds a long roof monitor over the middle of the library, through the upper floor's corridor zone, which raises the share to 61% and gives the library a central band of light that the librarian likes very much. It costs a little in energy and structure; the model shows the energy use intensity rising by less than 0.3 kBtu/ft².
The comfort check looks at the hottest summer week in the climate projections for the 2050s, as the students did for the community hub. The south-facing library, with its fins and overhang, stays comfortable with the ground-source cooling. The commons, with its tall glass wall to the park, overheats on afternoons in late summer. Callum adds exterior blinds that lower automatically in strong sun and extends the overhang at the café. The rooms on the upper floor, with their tall narrow windows on the north and light from the saw-teeth, need little cooling at all.
Worked problem
Spending the margin
During design development the librarian asks for the north wall of the upper floor to have larger windows, so that students in the study area can see the street. The change would raise the window share from 30% to 34%. Should Callum agree, and how should he decide?
Show solution
- Estimate the effect: by Sethi's sensitivity runs, each four points of window share add roughly 0.6 kBtu/ft².
- Check the margin: the building is at 20.0 against a target of 20.6, a margin of about 3%, below the 10% Sethi recommended.
- Look for a trade: the new roof monitor and the low-carbon concrete do not reduce energy use, but improved controls on the plug loads or a better heat pump efficiency might.
- Consider the window's quality: north windows in a study area cause little glare and overheating, and views to the street are part of what the building is for.
- Decide with numbers: accept larger windows in the study area only, about two points of window share, and offset them with occupancy controls on the plug loads.
Answer: The study area gets its larger windows, the rest of the north wall stays as it is, and the building keeps its margin by controlling the plug loads.
Exercise 9: energy and carbon
- Prepare an energy summary of your building by end use and compare it with the target, with a margin.
- Run the carbon script for your building in both grids and explain which half of the carbon matters more in your city.
- Take off quantities of your structure and envelope and estimate their embodied carbon, stages A1 to A3, against a stated baseline.
- List three design changes that would reduce embodied carbon and test each one.
Self-check
- Is your design inside its energy target by a margin you can defend?
- Have you reported biogenic carbon separately rather than subtracting it?
- Is your baseline a building a competent team would actually have built?
Common mistakes
MistakeCelebrating a model result without looking at the end uses.
InsteadRead where the energy goes and who controls each use.
MistakeDesigning to the target with no margin.
InsteadAim about 10% below it, because the margin will be spent.
MistakeIgnoring the grid when judging operating carbon.
InsteadUse the local emission factor; the same building can be near zero in one grid and significant in another.
MistakeSubtracting the carbon stored in timber at stage A1 alone.
InsteadReport biogenic carbon separately and consider the end of life.
MistakeChoosing a baseline that flatters the design.
InsteadCompare with what a competent team would have built.
Summary and key terms
- The Commons' targets measure energy use intensity, on-site fuel and embodied carbon of structure and envelope at stages A1 to A3.
- Callum's model uses about 20.0 kBtu/ft² a year; heating, plug loads and lighting are the largest uses, and the result is sensitive to small concessions.
- In Minneapolis's grid operating carbon is about twice the embodied carbon at today's factor; efficiency and solar matter as much as materials.
- Low-carbon concrete in the cores and foundations takes the embodied carbon from 30% to 36% below the baseline.
- Daylight and comfort models led to a roof monitor over the library and exterior blinds in the commons.
- Energy use intensity
- A building's annual energy use divided by its gross floor area.
- Emission factor
- The greenhouse gas emitted per unit of energy, such as kilograms of CO₂e per kWh of electricity.
- Life cycle assessment
- A method of estimating the environmental impacts of a product or building over its life.
- Stages A1 to A3
- The product stages of a life cycle assessment: raw materials, transport to the factory and manufacture.
- Biogenic carbon
- Carbon absorbed from the atmosphere by plants and stored in materials such as wood.
Practice problems
Work each problem on paper first, then reveal the answer to check.
A building of 40,400 square feet uses 236,800 kWh a year. What is its energy use intensity in kBtu per square foot?
Show answer
236,800 × 3.412 ÷ 40,400 ≈ 20.0.
A 120 kW array yields 1,300 kWh per kW a year. What does it produce?
Show answer
156,000 kWh.
With a grid factor of 0.38 kg/kWh, what is the operating carbon of 80,800 kWh bought from the grid?
Show answer
About 30.7 metric tons a year.
A design has 25 kg CO₂e per square foot against a baseline of 35.3. How much lower is it?
Show answer
1 − 25 ÷ 35.3 ≈ 30%.
Why do the concrete cores and foundations carry so much of the embodied carbon?
Show answer
Cement is very carbon-intensive, so even a small volume of concrete has a large share.
Why should a design aim about 10% below its energy target?
Show answer
Small concessions during design and construction add up and spend the margin.
Lesson quiz · 5 questions
Score 60% or more to complete this lesson.
Create a free account to save your progress, take quizzes and earn a certificate.