
ARCH-240 · Lesson 11 of 12 · 21 min
Embodied carbon of materials
Mei Takahashi has spent eight years doing life cycle assessments of buildings, first for a structural engineering firm and now for a city's sustainability office. She opens her laptop on the studio table and shows the class a pie chart of a new library: the carbon emitted to make, transport and build its materials, compared with the carbon from heating, cooling and lighting it for sixty years. In an all-electric building on a clean grid, the materials are the larger slice. 'For most of my career, people thought only about the energy a building uses,' she says. 'Now the energy side is getting cleaner, and we're discovering that the carbon we pour and bolt into the building on day one is a big part of its whole life. And we can't take it back once it's out.'
Operational and embodied carbon
A building's greenhouse gas emissions fall into two groups. Operational carbon comes from the energy used to run the building: heating, cooling, ventilation, hot water, lighting and equipment. Embodied carbon comes from everything else: extracting raw materials, making products, transporting them, constructing the building, maintaining and replacing parts, and finally demolishing and disposing of it. Embodied carbon is usually expressed in kilograms of carbon dioxide equivalent (kg CO₂e), a unit that converts the warming effect of all greenhouse gases, including methane and refrigerants, into the equivalent amount of carbon dioxide.
Globally, the manufacture of building materials such as cement, steel and aluminum is often estimated to account for roughly a tenth of energy-related carbon dioxide emissions, and operational energy of buildings for considerably more. As grids decarbonize and buildings become more efficient, the embodied share of a new building's lifetime emissions grows, and for a highly efficient building it can be half or more. Embodied carbon is also emitted up front, before the building opens, which matters because the climate responds to cumulative emissions over the next few decades.
Life cycle assessment
Life cycle assessment (LCA) is the method for counting environmental impacts over a product's or building's whole life. For buildings, the European standard EN 15978 and the related product standards ISO 21930 and EN 15804 divide the life cycle into stages, now used around the world.
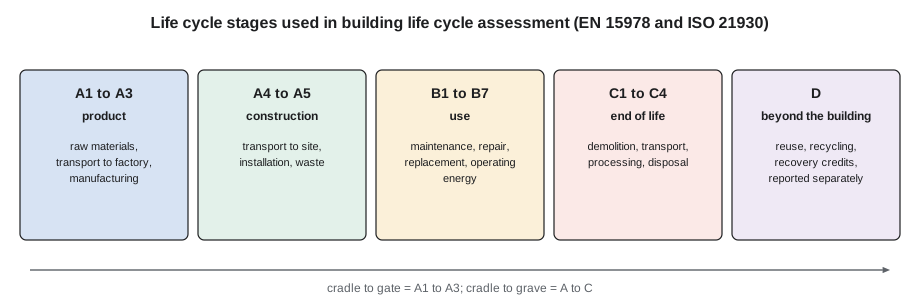
A cradle-to-gate assessment covers stages A1 to A3, up to the factory gate; this is what most product data provides. Cradle-to-grave covers A to C. Module D, benefits from reuse and recycling beyond the building's life, is reported separately because it is speculative. A whole-building LCA multiplies the quantities of each material, usually taken from the model or the cost estimate, by impact factors for each stage, and adds them up. The result is often normalized per square meter of floor area to compare buildings.
Several software tools perform whole-building LCAs using material databases, among them One Click LCA, Tally, the Athena Impact Estimator and, for material comparisons, the free EC3 tool from the Carbon Leadership Forum. Their results differ with their databases and assumptions, so comparisons should use the same tool and the same scope.
Environmental product declarations
An environmental product declaration, introduced in Lesson 1, reports the measured life cycle impacts of a product according to product category rules (PCRs) that fix the scope, functional unit and methods for that product type. Industry-average EPDs, published by trade associations, represent a sector's average; product-specific and plant-specific EPDs represent one manufacturer's product or one plant. The difference can be large: two plants making the same nominal concrete can differ by 30% or more, depending on their cement, SCMs and mix design. Buy-clean policies therefore ask for product-specific EPDs.
When reading an EPD, check the functional or declared unit (a cubic meter of concrete, a ton of steel, a square meter of insulation at a given thermal resistance), the stages included, the global warming potential (GWP) in kg CO₂e, the validity date and the verification. Comparing EPDs is only meaningful between products that serve the same function under the same PCR.
Carbon by material
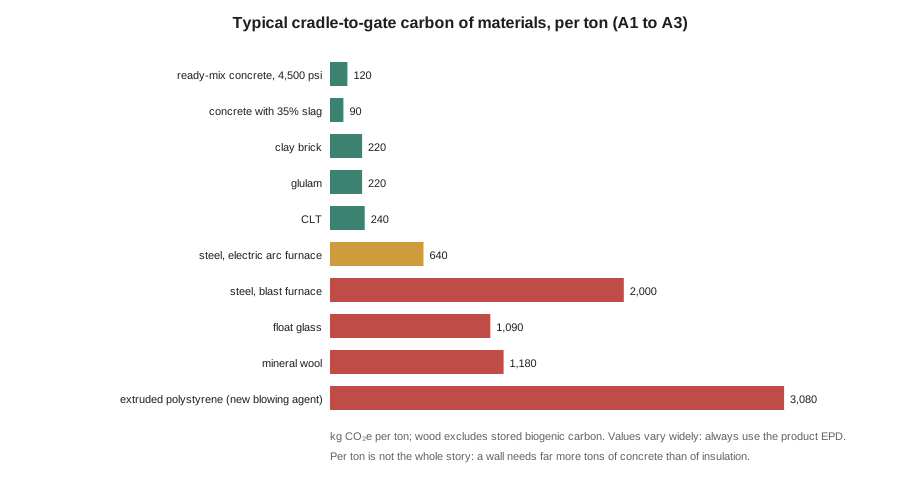
Per unit mass, concrete is one of the lowest-carbon materials and foams, glass and primary metals among the highest. But buildings use vastly more concrete than anything else, so concrete, along with steel, usually dominates a building's embodied carbon. In a typical mid-rise building, the structure and foundations often account for half or more of the A1 to A3 total, the envelope for a quarter or so and interiors and services for the rest, though interiors replaced several times over the building's life can add up.
Wood raises a special question. Trees absorb carbon dioxide as they grow, and about half the dry mass of wood is carbon. That biogenic carbon stays stored in a building's wood until the wood burns or rots. Some LCA methods count the stored carbon as a negative emission in A1 and add it back at end of life; others report it separately. The stored carbon is real, but it is temporary, and its climate benefit depends on how forests are managed and what happens to the wood at the end of the building's life. Takahashi recommends reporting biogenic carbon separately rather than netting it off, so that the comparison of manufacturing emissions stays clear.
Comparing structural systems
Because structure dominates, the choice of structural system is one of the most consequential carbon decisions an architect makes, and it happens early in design. The class compares three systems for the floors of the community hub's two-story wing on its 24 by 24 ft grid.
# Cradle-to-gate carbon of three floor systems for the hub wing, per ft2 of floor (typical EPD values)
systems = {
    "CLT panels on glulam frame": [   # component, quantity per ft2, unit, kg CO2e per unit
        ("CLT panel, 6.9 in", 17.2, "lb", 0.118),
        ("glulam beams and columns", 2.87, "lb", 0.109),
        ("concrete topping, 2 in", 0.164, "ft3", 8.5),
        ("steel connectors", 0.61, "lb", 0.68)],
    "concrete flat slab": [
        ("slab, 10 in, slag-blended", 0.82, "ft3", 8.5),
        ("reinforcing steel", 5.12, "lb", 0.408),
        ("columns", 0.066, "ft3", 8.5)],
    "steel frame, composite deck": [
        ("steel beams and columns", 9.22, "lb", 0.544),
        ("steel deck", 2.46, "lb", 1.134),
        ("concrete fill on deck", 0.361, "ft3", 8.5),
        ("fire protection coating", 0.41, "lb", 0.454)],
}
for name, parts in systems.items():
    total = sum(q * f for _, q, _, f in parts)
    print(f"{name:<30} {total:6.1f} kg CO2e per ft2")
wood = 20.1          # lb of wood per ft2 in the timber system
print(f"Biogenic carbon stored in the timber system (reported separately): about {wood * 0.726:.1f} kg CO2e per ft2")CLT panels on glulam frame 4.2 kg CO2e per ft2 concrete flat slab 9.6 kg CO2e per ft2 steel frame, composite deck 11.1 kg CO2e per ft2 Biogenic carbon stored in the timber system (reported separately): about 14.6 kg CO2e per ft2
On these assumptions, the mass timber floor emits less than half the manufacturing carbon of the concrete flat slab or the steel and composite deck system, before counting the carbon stored in its wood. The result is typical of published comparisons, but the margins depend heavily on the specific products, the grid and the loads. A post-tensioned concrete slab with high slag content, or a steel frame of electric arc furnace sections, can narrow the gap; a timber floor with a thick concrete topping for acoustics widens it less than expected. The point Takahashi stresses is that these comparisons must be made early, with real quantities, and revisited as the design develops.
Strategies to reduce embodied carbon
The Carbon Leadership Forum and others suggest an order of priorities.
- Build less: reuse existing buildings where possible; renovation typically emits far less carbon than demolition and new construction. Question the size of the program and plan efficient layouts.
- Build light: use efficient structural spans and grids, avoid transfer structures and deep cantilevers, and do not over-specify strengths or thicknesses. Foundations shrink when the building gets lighter.
- Build with lower-carbon materials: Type IL cement and SCMs in concrete; electric arc furnace steel; wood from sustainably managed forests; insulation with low-carbon blowing agents; recycled aluminum; reclaimed brick and timber.
- Build for the long term: durable, adaptable buildings spread their embodied carbon over a longer life (Lesson 10).
- Build for disassembly: bolted and screwed connections, separable layers and standard sizes make reuse possible at the end of life.
Takahashi warns against two traps. The first is shifting carbon rather than reducing it, for example by thinning insulation to save embodied carbon and then burning more gas to heat the building for sixty years. The second is focusing on small items with good stories, such as a reclaimed wood feature wall, while ignoring the large items in the foundations and structure.
Policy and targets
Embodied carbon has moved quickly from voluntary practice into policy.
In the United States, the federal Buy Clean initiative, which used Inflation Reduction Act funds to have the General Services Administration and other agencies buy low-embodied-carbon concrete, steel, asphalt and glass, lost its policy basis when the executive order behind it was rescinded on 20 January 2025, though much of the funding had already been committed. State programs continue. Minnesota's 2023 Buy Clean Buy Fair law requires product-specific EPDs and sets maximum global warming potential values for concrete, reinforcing steel, structural steel and asphalt on state-funded projects, including new state buildings over 50,000 ft², with concrete in covered buildings due first, from January 2026, and the other materials from 2028. California, Colorado, Washington and other states have their own Buy Clean laws.
Takahashi ends her session with a warning about precision. A whole-building LCA reported to three significant figures looks authoritative, but its uncertainty is large: quantities from an early model may be off by a fifth, generic impact factors may differ from the eventual products by a third, and the assumptions for transport, waste, replacement and end of life are educated guesses. The results are most useful for comparing options within one project, with the same tool and the same scope, and for finding the few items that matter most. They are much less reliable for comparing one building with another unless both followed the same rules. She asks the students to report ranges rather than single numbers where they can, to state which stages and components they included, and to keep the quantity take-off so that the assessment can be updated as the design and the product selections firm up. In her experience, a project that repeats its LCA at each design stage and feeds the results back into decisions saves far more carbon than one that commissions a polished report at the end.
For designers, the practical result is that EPDs are increasingly requested in specifications, carbon budgets appear in project briefs, and whole-building LCAs are becoming a standard service at schematic design, design development and construction documents.
Worked problem
Setting a carbon budget for the hub
The city's brief for the community hub asks the team to stay below 32.5 kg CO₂e per ft² for stages A1 to A5 of structure and envelope, matching a leading municipal target. The hub has a gross area of about 26,700 ft². What is the total budget, and where should the team look first to meet it?
Show solution
- Total budget: 32.5 × 26,700 ≈ 868,000 kg, or about 870 metric tons of CO₂e.
- The largest items will be the foundations on the site's clay (piles and grade beams), the slab on grade, the hall's long-span roof and the wing's floors.
- Use slag-blended Type IL concrete with 56-day strength in the slab and foundations; keep the slab no thicker than needed.
- Use the mass timber structure in the wing and glulam trusses in the hall, as designed, and limit concrete topping to what acoustics require.
- In the envelope, prefer wood cladding and mineral wool or low-carbon foams; keep glazing to what daylight needs; check aluminum window frames for recycled content.
Answer: A budget of about 870 tons of CO₂e, met mainly through low-carbon concrete in the foundations and slab and the mass timber structure, with careful envelope choices.
Exercise 11: embodied carbon
- Find product-specific EPDs for a concrete, a steel section and an insulation available near you, and record their declared units and GWP.
- Run the structural comparison above with quantities from your own hub design, and test how the result changes with different factors.
- Estimate the embodied carbon of one exterior wall assembly of the hub per unit of wall area, using the EPDs you found.
- Identify three ways to reduce the hub's embodied carbon by at least 10% without reducing its program or durability.
- Write a one-page carbon section for the hub's design brief, including a target and the stages it covers.
Common mistakes
MistakeComparing materials per ton rather than per function.
InsteadCompare per functional unit, such as per unit of floor area or per unit of thermal resistance.
MistakeUsing industry-average values when product data exists.
InsteadAsk suppliers for product-specific or plant-specific EPDs.
MistakeNetting off biogenic carbon without saying so.
InsteadReport stored biogenic carbon separately from manufacturing emissions.
MistakeSaving embodied carbon by losing operational performance.
InsteadCheck the whole life: operational and embodied together.
MistakeLeaving carbon decisions to the end of design.
InsteadCompare structural systems and major materials at concept stage, when they can still change.
Summary and key terms
- Embodied carbon covers emissions from materials and construction over the whole life; operational carbon covers energy in use.
- Life cycle assessment divides the life into stages A1 to A3, A4 to A5, B, C and D.
- EPDs report product impacts to product category rules; product-specific EPDs are more accurate than industry averages.
- Concrete and steel usually dominate a building's embodied carbon because of the quantities used.
- Biogenic carbon stored in wood is real but temporary and should be reported separately.
- Build less, build light, choose lower-carbon materials, build for the long term and for disassembly.
- Embodied carbon
- Greenhouse gas emissions from materials and construction over a building's life cycle.
- kg CO₂e
- Kilograms of carbon dioxide equivalent, a common unit for all greenhouse gases.
- Cradle to gate
- The life cycle stages A1 to A3, from raw material to the factory gate.
- Global warming potential
- The warming effect of emissions expressed in kg CO₂e.
- Product category rules
- Rules that fix how EPDs are prepared for a type of product.
- Biogenic carbon
- Carbon absorbed by plants as they grow and stored in materials such as wood.
Practice problems
Work each problem on paper first, then reveal the answer to check.
Why is concrete's carbon per ton low but its share of a building's carbon high?
Show answer
Buildings use very large quantities of concrete.
What stages does a cradle-to-gate EPD cover?
Show answer
A1 to A3: raw materials, transport to the factory and manufacturing.
Why do buy-clean policies prefer plant-specific EPDs?
Show answer
Products from different plants differ widely, so averages hide the low-carbon options.
Give two ways to reduce the carbon of a concrete slab without changing its function.
Show answer
Use Type IL cement with SCMs such as slag, and avoid over-specifying strength or thickness.
Why might reusing an existing building be the lowest-carbon option?
Show answer
Most of its embodied carbon has already been emitted, and renovation needs far less new material.
Lesson quiz · 5 questions
Score 60% or more to complete this lesson.
Create a free account to save your progress, take quizzes and earn a certificate.