
APT-330 · Lesson 3 of 12 · 22 min
Sales targets and reports
▶ Video coming soon A video version of this lesson is on the way.
In the third week of October, Walter sent every department manager the same email: draft budgets for 2027 due by the end of November. Rolf printed it and brought it to the Wednesday session. "This is where targets come from," he told Imani. "Not from Tessaro, not from head office. From us, in a spreadsheet, every fall. If we set them badly, we spend next year either making excuses or coasting." The session covered how targets are built, how they are tracked every day, and which reports a parts manager reads to know whether the department is winning.
Building the annual target
A sales target is a forecast with a commitment attached. Rolf builds the parts budget in four steps.
- Start from the last 12 months, by market: 4,944,000 dollars of sales, with 188,000, 147,000 and 77,000 dollars in an average month from internal, wholesale and retail.
- Adjust for what will change. The vehicles in operation (units in the dealership's area that are old enough to need parts but still on the road), new models such as the electric Marlo, planned service shop growth, maker price changes, and known gains or losses of wholesale accounts.
- Spread the year by month, using last year's pattern. Parts sales rise in spring and fall with tire changes, brakes and winter preparation, and dip in the weeks around the winter holidays.
- Set the gross profit target, not just sales. A target to sell more at a lower margin can leave the department worse off.
For 2027, Rolf proposed a 5 percent increase in sales, mostly from wholesale growth and the Marlo's first year of service work.
Worked problem
The 2027 sales target
Last year's sales were 4,944,000 dollars. Rolf proposes a 5 percent increase. What is the target, and what is it per average month?
Show solution
- Target = 4,944,000 × 1.05 = 5,191,200 dollars.
- Per average month = 5,191,200 ÷ 12 = 432,600 dollars.
Answer: 5,191,200 dollars a year, about 432,600 dollars in an average month. The monthly targets are then shaped by the seasonal pattern, so October's target is higher than January's.
Imani asked how Rolf knew 5 percent was right. He didn't, he said, but he could defend it. The service shop planned to add a technician in the spring, Tessaro's price increases usually ran 2 to 4 percent a year, and the wholesale team had two new garages buying regularly since September. A target should be reachable with effort, explained in writing, and agreed with the general manager. A target nobody believes in changes nobody's behavior.
Tracking the month: the daily operating report
Targets are set once a year but watched every day. Rolf's morning starts with the daily operating report, produced by the dealer management system overnight. For the parts department it shows, for yesterday and month to date: sales and gross profit by market, the number of tickets and repair orders, emergency orders placed, special orders due, lost sales recorded, and inventory value.
The most useful number on it is the pace: the month-to-date result projected to the end of the month.
Worked problem
Reading the pace
After 9 of November's 22 working days, month-to-date sales are 171,400 dollars. The November target is 433,000 dollars. What is the pace, and how does it compare with the target?
Show solution
- Average per working day so far = 171,400 ÷ 9 = 19,044.44 dollars.
- Pace = 19,044.44 × 22 = 418,977.78 dollars.
- Compared with target: 418,977.78 ÷ 433,000 = 0.968.
Answer: The department is pacing at about 419,000 dollars, 96.8 percent of target. With 13 working days left, it needs about 20,123 dollars a day to reach the target, a little more than its average so far.
Rolf showed Imani how to work out that last figure: the remaining target is 433,000 − 171,400 = 261,600 dollars, and 261,600 ÷ 13 = 20,123 dollars a day. A shortfall at day 9 is not a crisis. It is information. Rolf checks which market is behind, whether a large wholesale order or a slow week in the shop explains it, and whether anything can be done this month, such as calling a wholesale account that has gone quiet.
The measures a parts manager watches
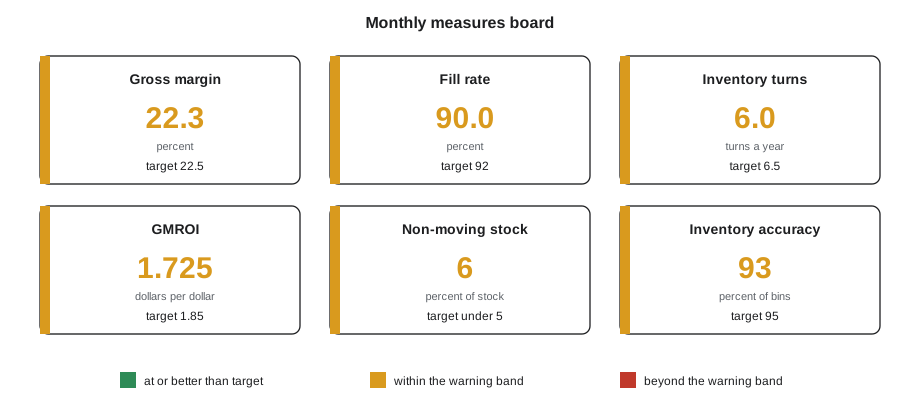
Beyond sales and gross profit, Rolf reports a set of key performance indicators (KPIs) every month. Most come from APT-210; what changes for a manager is that each one has a target, an owner and an action when it slips.
| Measure | How it is calculated | Linmore now | Target |
|---|---|---|---|
| Gross margin | Gross profit ÷ sales | 22.3 percent | 22.5 percent |
| Fill rate (first-time fill on requests) | Requests filled from stock ÷ requests | 371 ÷ 412 = 90.0 percent | 92 percent |
| First-time fill on repair order lines | Lines filled from stock ÷ lines | 1,612 ÷ 1,780 = 90.6 percent | 92 percent |
| Inventory turns | Annual cost of sales ÷ average inventory | 6.0 | 6.5 |
| GMROI | Annual gross profit ÷ average inventory | 1.725 | 1.85 |
| Non-moving stock | Value with no sale in 12 months ÷ inventory | 6 percent | under 5 percent |
| Inventory accuracy | Bins matching on a count ÷ bins counted | 93 percent | 95 percent |
Two more measures connect parts with service:
- Parts sales per customer-pay repair order. In October the shop closed 1,460 customer-pay repair orders with 96,000 dollars of parts on them, or 96,000 ÷ 1,460 = 65.75 dollars per repair order. If that number falls while the shop stays busy, parts are being missed on the repairs, or technicians are buying elsewhere.
- Parts-to-labor ratio. Customer-pay parts sales divided by customer-pay labor sales: 96,000 ÷ 118,000 = 0.81. Dealers watch this ratio to see whether the shop's work mix is changing, for example toward diagnosis and programming, which uses labor but few parts.
Makers and dealer groups publish averages for many of these measures, and Tessaro's district reports show how Linmore compares with similar stores. Rolf treats those comparisons as typical values, not rules. A dealer with a large wholesale business will always show a lower margin and higher sales per employee than one that sells mostly to its own shop.
Individual sales reports
The system can show sales, gross profit and ticket counts for each counter person. Rolf uses these reports carefully. He showed Imani October's report for the front counter:
| Counter person | Sales (dollars) | Gross profit (dollars) | Tickets | Margin | Average ticket (dollars) |
|---|---|---|---|---|---|
| Imani | 61,200 | 14,076 | 612 | 23.0 percent | 100.00 |
| Teodor | 54,800 | 11,508 | 590 | 21.0 percent | 92.88 |
| Maribel | 49,300 | 10,846 | 548 | 22.0 percent | 89.96 |
| Talia (apprentice) | 22,600 | 4,746 | 301 | 21.0 percent | 75.08 |
"The tempting thing," Rolf said, "is to rank them and push the bottom one. Don't." The numbers depend on who serves which customers. Teodor Vasko takes most of the wholesale phone overflow, which lowers his margin. Maribel Quist works the Saturday counter, where tickets are smaller. Talia is an apprentice in her second month, and her tickets include many small sales she was trained on first. The report is useful for questions, why is this person's margin lower, what kind of sales does each person handle, who needs help with add-on sales, and for coaching, not for a league table.
Rolf also watches the add-on rate: how often a ticket for a main part includes the related items a careful counter person suggests, such as hardware with brake pads, a gasket with a water pump, or a funnel and gloves with oil. Talia's add-on rate, measured from a sample of brake and cooling tickets, had risen from about one in three in September to one in two by November, which mattered more to Rolf than her total sales.
Lost sales and what they tell the manager
A lost sale is a request the department couldn't fill: the part wasn't in stock and the customer went elsewhere, or the price was too high, or the delivery too slow. Counter staff record lost sales in the system with a reason code. Rolf reviews the report every week for three kinds of signal:
- Stocking signals. The same part requested three or more times in six months is a candidate for stock under the phase-in rule from APT-210.
- Price signals. Repeated losses on price for one product line suggest the matrix band or the account level is out of line with competitors.
- Service signals. Losses on delivery time point to the van schedule or the cut-off times.
Lost sales are only useful if staff record them, and staff only record them if the manager uses the report. Rolf makes a point of telling the counter what changed because of their entries: a new stocked part, a price review, a change to the 2 p.m. van run.
Reporting to the general manager
Every month, Rolf sends Walter a one-page summary, and every Friday he gives a short update at the managers' meeting. The one page follows the same pattern each month:
- Results against target: sales and gross profit by market, for the month and year to date.
- Measures: the KPI board, with any measure that changed color.
- Explanations: two or three sentences on the main reasons for any gap, without excuses.
- Actions: what Rolf is doing about each gap, with a date.
- Requests: anything he needs from Walter, such as approval for a staff change or a capital purchase.
Imani asked why the summary was only one page. "Because Walter reads seven of them," Rolf said. "If the important thing is on page three, it isn't important."
Reports that mislead
Rolf finished with a warning. Every report is built on data entered by people, and every target changes behavior, not always in the intended way. He gave three examples he had seen in other stores. A manager paid on sales volume gave away margin to hit the number. A department judged only on turns stopped stocking slow but essential parts, and the service shop waited days for them. A counter team told to cut lost sales simply stopped recording them. In each case the report looked better while the business got worse.
The defense is to use several measures together, so that one can't improve by sacrificing another, and to look behind the numbers: walk the warehouse, sit at the counter, ask the technicians. A report tells a manager where to look. It doesn't replace looking.
Setting targets for people, not just the department
The department's target becomes useful only when each person knows their part in it. Rolf breaks the annual plan into a few targets that people can influence directly, and avoids targets they can't. The counter staff share the department's gross profit target and have their own measures for accuracy, add-on rate and lost sales entries. Sasha's warehouse team has targets for order accuracy, same-day put-away and cycle count completion. Gideon's are on-time delivery and proof of delivery on every stop. Imani's new role would carry the counter team's combined results and the training plan.
Each target is written down, reviewed at the monthly one-to-one and adjusted only for a good reason, such as a change in the job. Rolf explained that people work hardest toward targets they helped set, so in December each person drafts their own goals for the next year before he meets them. Most people, he said, set themselves goals a little harder than he would have.
When the target is missed
Some months the department misses its target. Rolf's response follows a pattern. First, find out whether the miss is real or a timing issue: a large wholesale order delivered on the first of the next month, or a warranty campaign that slipped a week. Second, find the market and the cause. Third, decide whether it can be recovered within the quarter or whether the forecast itself was wrong. A target that was wrong is changed openly with the general manager, with the reason written down; it is not quietly ignored. Walter, Rolf said, has never been angry about a missed target that was explained. He has been angry about surprises.
Imani's homework for the week was to calculate the pace on three mornings and write one sentence each time on what it meant. By the third morning, she had found the cause of a slow start to the month: a large fleet account had shifted its order day from the first to the fifth.
Common mistakes
MistakeSetting a sales target without a gross profit target.
InsteadSet both, by market, so that growth doesn't come from giving away margin.
MistakeWaiting until month end to see whether the target will be met.
InsteadRead the pace every day and act early on the market that is behind.
MistakeRanking counter staff by sales alone.
InsteadCompare like with like, use the report for coaching, and watch margin, add-ons and accuracy as well.
MistakeIgnoring lost sales because they are hard to collect.
InsteadUse the lost sales report visibly, so that staff see their entries lead to changes.
MistakeReporting numbers without explanations or actions.
InsteadGive the result, the reason and the action with a date.
Summary and key terms
- An annual target starts from the last 12 months by market, is adjusted for known changes, spread by season and set for gross profit as well as sales.
- The daily pace projects month-to-date sales to month end: (sales ÷ days completed) × working days.
- Core measures include margin, fill rate, turns, GMROI, non-moving stock and accuracy, each with a target and an owner.
- Parts sales per repair order and the parts-to-labor ratio connect parts results with the service shop.
- Individual and lost sales reports are tools for coaching and decisions; any single measure can mislead if used alone.
- Pace
- Month-to-date sales projected to the end of the month at the same daily rate.
- Key performance indicator (KPI)
- A measure, with a target, used to judge how the department is performing.
- Daily operating report
- The overnight report of the previous day's and month-to-date results.
- Lost sale
- A request the department could not fill, recorded with a reason code.
- Parts-to-labor ratio
- Customer-pay parts sales divided by customer-pay labor sales.
- Add-on rate
- The share of tickets for a main part that also include the related items.
Practice problems
Work each problem on paper first, then reveal the answer to check.
After 12 of 21 working days, sales are 240,000 dollars. What is the pace?
Show answer
240,000 ÷ 12 × 21 = 420,000 dollars.
Last year's sales were 3,200,000 dollars. What is a 4 percent growth target?
Show answer
3,200,000 × 1.04 = 3,328,000 dollars.
A shop closes 1,200 customer-pay repair orders with 78,000 dollars of parts. What are parts sales per repair order?
Show answer
78,000 ÷ 1,200 = 65.00 dollars.
Customer-pay parts are 90,000 dollars and labor 120,000 dollars. What is the parts-to-labor ratio?
Show answer
90,000 ÷ 120,000 = 0.75.
Why should a manager not judge the department on inventory turns alone?
Show answer
Turns can be raised by not stocking slow but needed parts, which hurts fill rate and the service shop.
Lesson quiz · 5 questions
Score 60% or more to complete this lesson.
Create a free account to save your progress, take quizzes and earn a certificate.