
AI-420 · Lesson 8 of 12 · 24 min
Online experiments and A/B testing
Offline metrics measure how well a model predicts held-out data. What the business cares about is different: does the new recommender increase purchases, does the new fraud model reduce losses without annoying good customers, does the new ranking keep users coming back? The only reliable way to measure these effects is a controlled experiment on live traffic. Large technology companies run thousands of online experiments a year, and their experience shows both how powerful the method is and how easy it is to get wrong. This lesson covers how A/B tests are designed and analyzed: randomization, metrics, sample size, the traps of peeking and mismatched samples, variance reduction, and alternatives such as interleaving and bandits.
Why offline and online results disagree
It is common for a model that wins offline to lose, or make no difference, online. Offline evaluation uses historical data collected under the old model, so it cannot show how users would react to different recommendations they never saw. The offline metric (say, log loss) may not track the business metric. Effects on behavior, such as users clicking more but buying less, or engagement rising briefly through novelty, appear only online. And small offline gains may be too small to matter. Online experiments settle these questions.
Anatomy of an A/B test
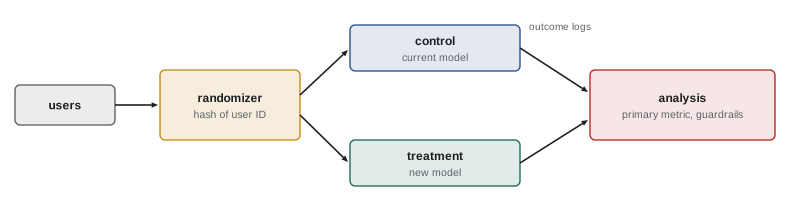
In an A/B test, units (usually users) are randomly assigned to a control group, which gets the current model, or a treatment group, which gets the new one. Because assignment is random, the groups differ only by chance and by the treatment, so any systematic difference in outcomes can be attributed to the model. Key design choices are:
- The randomization unit: users, sessions, requests, or larger clusters such as cities or stores. Randomizing by user keeps each person's experience consistent; randomizing by request is more sensitive but can confuse users and lets effects leak between groups.
- The overall evaluation criterion (OEC): the primary metric that decides the test, chosen in advance, such as revenue per user or the share of users who return within a week.
- Guardrail metrics: things that must not get worse, such as latency, error rates, complaints, unsubscribes, or fairness measures. A treatment that raises the OEC but breaks a guardrail is not shipped.
- The minimum detectable effect (MDE): the smallest effect worth detecting, which with the significance level and power determines the sample size.
- The duration: long enough to reach the sample size and to cover weekly cycles, usually at least one or two full weeks.
Sample size and power
For a conversion rate p, detecting an absolute difference δ with two-sided significance level α and power 1 − β needs approximately this many units per arm:
import numpy as np
from scipy.stats import norm, chisquare

# 1. Sample size per arm to detect a relative lift in conversion rate
def n_per_arm(p, rel_lift, alpha=0.05, power=0.8):
    p2 = p * (1 + rel_lift)
    z = norm.ppf(1 - alpha / 2) + norm.ppf(power)
    return z**2 * (p * (1 - p) + p2 * (1 - p2)) / (p2 - p) ** 2
for lift in (0.10, 0.05, 0.02):
    print(f"Base 4 % conversion, detect +{lift:.0%} relative: {n_per_arm(0.04, lift):,.0f} users per arm")

# 2. Peeking: checking an A/A test every day and stopping at the first p < 0.05
rng = np.random.default_rng(8)
sims, days, per_day, p = 2000, 20, 2000, 0.04
false_stop = 0
for _ in range(sims):
    a = rng.binomial(per_day, p, days).cumsum()
    b = rng.binomial(per_day, p, days).cumsum()
    n = per_day * np.arange(1, days + 1)
    pool = (a + b) / (2 * n)
    z = (b - a) / n / np.sqrt(pool * (1 - pool) * 2 / n)
    false_stop += np.any(np.abs(z) > 1.96)
print(f"A/A test with daily peeking: false positive rate {false_stop / sims:.1%} (nominal 5 %)")

# 3. Sample ratio mismatch check for a planned 50/50 split
counts = [50812, 49188]
stat, pval = chisquare(counts)
print(f"Users per arm {counts}: chi-squared p = {pval:.1e} -> investigate assignment before trusting results")Base 4 % conversion, detect +10% relative: 39,472 users per arm Base 4 % conversion, detect +5% relative: 154,301 users per arm Base 4 % conversion, detect +2% relative: 950,884 users per arm A/A test with daily peeking: false positive rate 26.3% (nominal 5 %) Users per arm [50812, 49188]: chi-squared p = 2.8e-07 -> investigate assignment before trusting results
The first lines show why small effects are expensive. At a 4 % base conversion rate, a 10 % relative lift (to 4.4 %) needs about 39,000 users per arm, a 5 % lift about 154,000, and a 2 % lift nearly a million. Because sample size scales with the inverse square of the effect, halving the MDE quadruples the sample. Many ML improvements produce effects of a few percent, so only high-traffic products can measure them in a reasonable time; smaller products must target larger effects, use more sensitive metrics, or accept uncertainty.
The peeking problem
It is tempting to watch the results every day and stop as soon as the difference is significant. This invalidates the test. The significance level of 5 % applies to a single analysis at a planned sample size; checking repeatedly gives chance many opportunities to cross the threshold. The simulation runs 2,000 A/A tests (both groups get the same model, so every "significant" result is false) for 20 days, checking daily: 26 % of them would have been stopped and declared winners, five times the nominal rate. Remedies are to fix the sample size in advance and analyze once, or to use sequential testing methods designed for continuous monitoring, such as group sequential designs with alpha spending or always-valid confidence sequences, which many experimentation platforms now provide. Guardrails, by contrast, can be monitored continuously with conservative thresholds, because stopping a harmful experiment early is always acceptable.
Trust checks
Before reading an experiment's results, check that it ran correctly. The most important check is for a sample ratio mismatch (SRM): if a test was designed as 50/50 and the groups differ more than chance allows, something went wrong with assignment or logging, for example the treatment crashing for some users so their sessions are lost, or a bot filter treating groups differently. In the output, 50,812 against 49,188 users looks close to equal, but the chi-squared test gives p ≈ 3 × 10⁻⁷: such an imbalance would almost never occur by chance. Results from an experiment with SRM should not be trusted until the cause is found. Other checks include A/A tests of the platform itself, confirming that pre-experiment metrics are balanced between groups, and verifying that the treatment was actually delivered.
Variance reduction
Much of the noise in user metrics comes from differences between users that existed before the experiment: heavy buyers buy more in both groups. CUPED (controlled-experiment using pre-experiment data), introduced at Microsoft by Deng and colleagues in 2013, adjusts each user's outcome using their own pre-experiment value of the metric, removing that predictable variation. With a pre-period metric correlated at ρ with the outcome, variance falls by a factor of 1 − ρ², so a correlation of 0.7 halves the variance and the required sample. Other techniques include trimming or capping extreme values, using more sensitive proxy metrics, and stratified randomization.
Worked problem
Planning a recommender experiment
A store has 400,000 active users a week, a 4 % weekly purchase rate, and wants to test a new recommender expected to lift purchases by about 5 %. Can it run the test in two weeks at 50/50? What if CUPED with ρ = 0.6 is used?
Show solution
- From the output, a 5 % relative lift at 4 % needs about 154,000 users per arm, 308,000 in total.
- In two weeks, with 50/50 assignment, about 400,000 distinct users (many return in the second week) are available, roughly 200,000 per arm: enough.
- With CUPED, variance falls by 1 − 0.6² = 0.64, so about 154,000 × 0.64 ≈ 99,000 users per arm suffice, allowing a smaller treatment share (for example 30 %) to limit risk, or detection of a smaller lift.
Answer: The test is feasible in two weeks, and variance reduction gives room to reduce exposure or sharpen the MDE. Two full weeks also cover weekly cycles.
Pitfalls in ML experiments
Several issues are specific to testing ML systems:
- Novelty and learning effects: users may click on new recommendations because they are new, or take time to adapt to a change. Running longer and examining effects over time helps.
- Interference: in marketplaces and social networks, treating some users affects others (a pricing model changes what sellers offer everyone). Cluster or switchback designs, which randomize by region or time period, reduce this.
- Shared training data: if both models later retrain on data from the whole population, the control is contaminated by the treatment's effects. Long-running holdouts help measure cumulative effects.
- Multiple metrics and segments: testing twenty metrics or slicing results by many segments will find "significant" differences by chance. Decide the primary metric in advance and treat other findings as hypotheses.
Alternatives: interleaving and bandits
For ranking systems, interleaving shows each user a single list that mixes results from both rankers and records which ranker's results get clicked. Because each user compares both, interleaving can detect preferences with far fewer users than an A/B test, though it measures preference rather than business impact. Multi-armed bandits shift traffic toward the better-performing variant during the test, reducing the cost of showing an inferior option, which suits short-lived decisions such as headline selection. Bandits trade some statistical clarity about the size of effects for lower regret, so A/B tests remain the standard for decisions that need a clear, unbiased estimate.
Analyzing the results
At the end of a test, the analysis reports the estimated effect on the primary metric with a confidence interval, not just a p-value: "revenue per user rose by 1.8 %, 95 % interval 0.6 % to 3.0 %" says how large the effect plausibly is. Guardrails are checked, and segments are examined to understand the effect, while remembering that segment findings are hypotheses for future tests. Teams should also record experiments that showed no effect or a negative one; across many organizations, a large share of ideas that looked promising offline do not improve the business metric, and a shared archive of results prevents the same idea from being tested again and again.
Experimentation platforms automate much of this: assignment by hashing user IDs, exposure logging, metric computation, trust checks such as SRM, and standard reports, so that individual teams cannot accidentally peek or choose metrics after the fact.
Common mistakes
MistakeShipping a model because it won offline.
InsteadConfirm business impact with an online experiment where possible.
MistakeChoosing the primary metric after seeing results.
InsteadFix the OEC, guardrails and MDE before the test.
MistakeStopping when the result first becomes significant.
InsteadAnalyze at the planned sample size or use sequential methods.
MistakeIgnoring a sample ratio mismatch.
InsteadFind the cause before trusting any result.
MistakeRunning a test for three days.
InsteadCover at least one or two full weekly cycles.
Summary and key terms
- Offline wins often fail to translate online; experiments measure real impact.
- A/B tests randomize units to control and treatment and compare a pre-chosen OEC and guardrails.
- Sample size grows with the inverse square of the minimum detectable effect.
- Peeking inflates false positives; use fixed horizons or sequential methods.
- Sample ratio mismatch signals a broken experiment.
- CUPED and other variance reduction cut the sample needed.
- Novelty, interference and multiple comparisons need care; interleaving and bandits are alternatives.
- A/B test
- A randomized controlled experiment comparing two variants.
- Randomization unit
- The entity assigned to a variant, such as a user.
- OEC
- Overall evaluation criterion: the primary decision metric.
- Guardrail metric
- A metric that must not get worse.
- MDE
- Minimum detectable effect.
- Power
- The probability of detecting a true effect of a given size.
- Peeking
- Repeatedly checking results and stopping early.
- Sample ratio mismatch
- Group sizes inconsistent with the planned split.
- CUPED
- Variance reduction using pre-experiment data.
- Interleaving
- Mixing two rankers' results in one list to compare preferences.
Practice problems
Work each problem on paper first, then reveal the answer to check.
Give two reasons offline and online results disagree.
Show answer
Historical data cannot show reactions to unseen outputs; offline metrics may not track business metrics; behavioral effects such as novelty.
What is a guardrail metric?
Show answer
A metric that must not get worse, such as latency or complaints.
If the MDE is halved, how does the sample size change?
Show answer
It roughly quadruples.
From the output, how many users per arm detect a 10 % lift at 4 %?
Show answer
About 39,500.
From the output, what false positive rate did daily peeking produce?
Show answer
About 26 %.
What should you do when you find a sample ratio mismatch?
Show answer
Investigate assignment and logging before trusting the results.
With ρ = 0.8, by what factor does CUPED reduce variance?
Show answer
1 − 0.64 = 0.36.
Why run experiments for at least a full week?
Show answer
To cover weekly cycles in behavior.
What is interference in a marketplace experiment?
Show answer
Treating some users affects outcomes for others, such as via shared supply.
What advantage does interleaving have for rankers?
Show answer
It detects preferences with far fewer users.
Lesson quiz · 5 questions
Score 60% or more to complete this lesson.
Create a free account to save your progress, take quizzes and earn a certificate.