
AI-420 · Lesson 4 of 12 · 24 min
Testing machine learning systems
Software engineers test code to catch bugs before users do. ML systems need the same discipline, and more, because their behavior depends on data and learned parameters as well as code, and because their failures are usually silent. A model can pass every unit test and still have learned a spurious shortcut, perform badly for an important group of users, or break when a feature arrives in a different format. This lesson describes what to test in an ML system, from code and data to the model's behavior and the serving path, how tests fit into a release process, and how to decide whether a candidate is good enough to replace the model in production.
Layers of testing
An ML system has several layers, and each needs its own tests:
- Code: unit tests for feature transformations, preprocessing, loss functions and utilities, exactly as in ordinary software. A function that computes "days since last purchase" should be tested with known inputs, edge cases (no purchases, purchases today) and time zones.
- Data: validation of training and serving data against expectations (Lesson 2).
- Training: tests that the training pipeline runs end to end on a small sample, that the loss decreases, and that a model can overfit a tiny dataset, a quick check that the model and data are wired correctly.
- Model quality: evaluation on held-out data against thresholds and against the current production model.
- Model behavior: tests of specific capabilities and properties, described below.
- Serving and integration: tests that the deployed model, given the same inputs, produces the same outputs as in training, within the latency budget, and that the surrounding application handles its outputs correctly.
Breck and colleagues at Google proposed an "ML Test Score" rubric in 2017 that lists 28 such tests across data, model development, infrastructure and monitoring; teams can score themselves against it to find gaps.
Evaluation beyond a single number
A single aggregate metric, such as accuracy or AUC on a test set, hides a great deal. Pre-release evaluation should include:
- Metrics that reflect the business decision: precision at the operating threshold, expected cost of errors, calibration if probabilities are used directly.
- Slice-based evaluation: performance on important subgroups, such as new customers, each region, each product category, or demographic groups where fairness matters. A model can improve overall while getting worse on a small but important slice.
- Comparison with the production model on the same data, with uncertainty (Lesson 3), rather than against a fixed threshold alone.
- Error analysis: reading a sample of the model's mistakes, which often reveals labeling problems, missing features or data bugs that metrics cannot.
- Robustness checks: performance on recent data, on data from a later time period than training (a temporal split), and with plausible noise or missing values.
Behavioral testing
Behavioral tests, popularized for NLP by the CheckList approach of Ribeiro and colleagues (2020), test what the model does rather than how often it is right on average. Three kinds are especially useful:
- Minimum functionality tests: simple cases the model must get right, like unit tests for capabilities. A sentiment model must classify "This is great" as positive.
- Invariance tests: changes that should not affect the prediction. Changing a person's name or an irrelevant field should leave a credit score unchanged.
- Directional expectation tests: changes that should move the prediction in a known direction. Higher income, all else equal, should not lower the probability of approval.
import numpy as np
from sklearn.ensemble import GradientBoostingClassifier

# A loan approval model, then tests of its behavior run before release
rng = np.random.default_rng(3)
n = 8000
income = rng.lognormal(11, 0.5, n) / 1000          # thousands per year
debt_ratio = rng.uniform(0, 0.8, n)
region = rng.integers(0, 5, n)                      # should not matter
p = 1 / (1 + np.exp(-(0.04 * (income - 60) - 6 * (debt_ratio - 0.35))))
approved = rng.random(n) < p
X = np.column_stack([income, debt_ratio, region])
model = GradientBoostingClassifier(random_state=0).fit(X[2000:], approved[2000:])

def prob(X):
    return model.predict_proba(X)[:, 1]

test = X[:2000].copy()                     # held out from training
base = prob(test)

# 1. Invariance: changing region should barely change the score
moved = test.copy(); moved[:, 2] = (moved[:, 2] + 1) % 5
inv = np.abs(prob(moved) - base)
print(f"Invariance (region): max change {inv.max():.3f}; cases over 0.05: {(inv > 0.05).mean():.1%}")

# 2. Directional: 10 % more income should never lower the approval probability
richer = test.copy(); richer[:, 0] *= 1.10
dirn = prob(richer) - base
print(f"Directional (income +10 %): cases where probability fell by more than 0.01: {(dirn < -0.01).mean():.1%}")

# 3. Slice performance: accuracy by debt ratio band
pred = base > 0.5
truth = approved[:2000]
for lo, hi in [(0, 0.3), (0.3, 0.5), (0.5, 0.8)]:
    m = (test[:, 1] >= lo) & (test[:, 1] < hi)
print(f"Debt ratio {lo:.1f} to {hi:.1f}: n = {m.sum():4d}, accuracy {(pred[m] == truth[m]).mean():.3f}")Invariance (region): max change 0.186; cases over 0.05: 1.6% Directional (income +10 %): cases where probability fell by more than 0.01: 5.7% Debt ratio 0.0 to 0.3: n = 752, accuracy 0.722 Debt ratio 0.3 to 0.5: n = 477, accuracy 0.734 Debt ratio 0.5 to 0.8: n = 771, accuracy 0.817
The model was trained on data in which region has no real effect, yet changing a customer's region moves the approval probability by more than 0.05 in 1.6 % of cases, and by as much as 0.19 in the worst case: the model has learned noise. Raising income by 10 % lowers the predicted probability in 5.7 % of cases, violating a basic expectation, because tree ensembles fit small wiggles in the data. Neither problem shows up in the overall accuracy. Both have standard remedies: drop features that should not matter (or justify keeping them), and use monotonic constraints, which libraries such as scikit-learn's HistGradientBoosting, XGBoost and LightGBM support, to force the model to respect known directions. The slice results show accuracy ranging from 0.72 to 0.82 across debt ratio bands, which tells the team where the model is weakest and where more data or features might help.
Behavioral tests are written once and run on every candidate, so a regression in a capability is caught even if the overall metric improves. For models affecting people, invariance tests on protected attributes and their proxies are a core part of fairness review (Lesson 11).
Testing the serving path
The training-serving skew of Lesson 1 is caught by testing the serving path directly. A standard approach is a golden dataset: a few thousand examples with inputs, features and predictions computed by the training pipeline. Before release, the same raw inputs are sent through the production serving stack, and its features and predictions are compared with the golden values; any difference beyond floating-point tolerance fails the test. Serving tests also check the response to malformed inputs (missing fields, wrong types, extreme values), that the service returns a sensible default or error rather than crashing, and that latency meets its target under expected load (Lesson 6).
Worked problem
Designing a golden test
A churn model takes a customer ID, looks up 40 features in the online store, and returns a probability. The training pipeline computes the same features in the warehouse. Describe a golden test that would catch the cents-versus-dollars bug from Lesson 1.
Show solution
- Select 2,000 customers, including edge cases (new customers, customers with no spend, very large spenders).
- From the training pipeline, record each customer's 40 features and the model's predicted probability at a fixed time.
- Populate a test online store from the same raw data at that time, call the serving endpoint for each customer, and capture the features it used (via debug logging) and its prediction.
- Compare: every feature must match within a tolerance, such as 10⁻⁶ relative, and predictions within 10⁻⁴. Report the first mismatching feature.
Answer: The spend feature would differ by a factor of 100 for every customer, failing the test immediately and naming the feature. Golden tests run in continuous integration for every change to feature code, serving code or the model.
Release gates
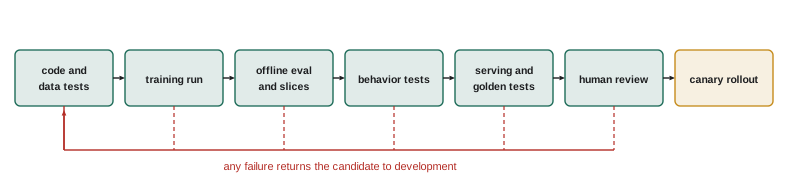
Tests are most useful when they are automated and decide whether a candidate can proceed. A typical release process for a model includes gates:
- All code, data and training tests pass.
- Offline metrics meet absolute thresholds and are not worse than production beyond a tolerance, overall and on each critical slice.
- Behavioral tests pass.
- Serving tests, including golden tests and latency tests, pass.
- Human review for high-impact models: a reviewer reads the evaluation report and model card and approves.
- Gradual rollout with online monitoring (Lessons 5 and 8).
The gate definitions are themselves versioned and reviewed, because a threshold set too loose lets regressions through and one set too tight blocks every improvement.
Testing in production
Some properties cannot be tested before release: how users react, how the model behaves on data that does not exist yet, and how it interacts with other systems. That is why testing continues after deployment, through shadow deployments that compare a candidate with production on live traffic without acting on its predictions (Lesson 5), online experiments (Lesson 8) and monitoring (Lesson 7). Pre-release tests catch what can be anticipated; production testing catches the rest, preferably with limited exposure.
Testing data and models together
Some of the most valuable tests check data and model together. Feature importance tests confirm that the features the model relies on most are ones that make sense; a top feature such as "record ID" or "row number" indicates leakage or a data bug. Calibration tests check that predicted probabilities match observed frequencies, which matters whenever probabilities are used directly, for example to price risk or to rank by expected value. Stability tests retrain the model on slightly different samples and confirm that predictions for the same individuals do not swing wildly, because users and regulators are rightly troubled when a decision depends on chance in the training process. And fairness tests compare error rates across groups (Lesson 11) as a release gate rather than an afterthought.
Tests should also be maintained like code. When a production incident reveals a failure no test caught, the fix includes a new test that would have caught it, so the suite grows from experience.
Finally, tests need realistic data. Synthetic edge cases are cheap and precise, while samples of recent production traffic reveal problems that nobody thought to write down. A good suite uses both, refreshes its production samples regularly, and stores them with versions so that a test failure can be reproduced exactly.
Common mistakes
MistakeTesting only the aggregate metric.
InsteadEvaluate slices, business metrics, calibration and errors.
MistakeAssuming the model respects obvious relationships.
InsteadWrite directional and invariance tests, and use monotonic constraints where needed.
MistakeTesting the model file but not the serving path.
InsteadCompare serving features and predictions against a golden dataset.
MistakeRunning tests by hand when someone remembers.
InsteadAutomate tests as gates in the release pipeline.
MistakeTreating pre-release tests as sufficient.
InsteadContinue testing in production with shadow, canary and experiments.
Summary and key terms
- ML systems need tests of code, data, training, model quality, behavior and serving.
- Evaluation should cover business metrics, slices, comparison with production and error analysis.
- Behavioral tests check minimum functionality, invariance and directional expectations.
- Tree models can violate monotonic expectations; constraints can enforce them.
- Golden datasets test that serving reproduces training features and predictions.
- Automated release gates decide whether a candidate proceeds.
- Testing continues in production with limited exposure.
- Slice
- A subgroup of data evaluated separately.
- Error analysis
- Examining a model's mistakes to find their causes.
- Temporal split
- Testing on data from a later period than training.
- Minimum functionality test
- A simple case the model must handle correctly.
- Invariance test
- A test that a change should not affect the prediction.
- Directional expectation test
- A test that a change should move the prediction in a known direction.
- Monotonic constraint
- A training constraint forcing predictions to move one way with a feature.
- Golden dataset
- Reference inputs and outputs used to test the serving path.
- Release gate
- A check a candidate must pass to proceed toward production.
- ML Test Score
- A rubric of tests for production ML readiness.
Practice problems
Work each problem on paper first, then reveal the answer to check.
Name the six layers of an ML system that need tests.
Show answer
Code, data, training, model quality, model behavior, serving and integration.
Why test that a model can overfit a tiny dataset?
Show answer
It quickly checks that the model, data and training loop are wired correctly.
Why evaluate on slices?
Show answer
A model can improve overall while getting worse for an important subgroup.
Give an example of an invariance test for a credit model.
Show answer
Changing the applicant's name or an irrelevant field should not change the score.
From the output, how often did higher income lower the probability?
Show answer
In 5.7 % of cases.
What remedy enforces that income never lowers approval probability?
Show answer
A monotonic constraint on income.
From the output, which debt ratio band has the lowest accuracy?
Show answer
0.0 to 0.3, accuracy 0.722.
What does a golden test compare?
Show answer
Features and predictions from the serving path against those from the training pipeline for the same inputs.
List four release gates.
Show answer
Code and data tests, offline metrics versus thresholds and production, behavioral tests, serving tests, human review, gradual rollout.
Why can pre-release tests never be sufficient?
Show answer
User reactions, future data and system interactions can only be observed in production.
Lesson quiz · 5 questions
Score 60% or more to complete this lesson.
Create a free account to save your progress, take quizzes and earn a certificate.