
AI-420 · Lesson 12 of 12 · 24 min
Case study and capstone project
This final lesson follows one machine learning system from idea to its second year in production, drawing on every earlier lesson, and then sets out the capstone project. The case is a customer retention system for a subscription business. It is deliberately ordinary: no exotic models, just the decisions about data, evaluation, deployment, serving, monitoring, cost and governance that determine whether an ML system creates value or quietly wastes money.
The business problem
A subscription service with about 1.2 million customers loses roughly 8 % of them each month to cancellation. The marketing team can offer a discount to customers who seem likely to leave, and wants a model to choose whom to contact each week. Early discussions surfaced the questions of Lesson 1: what decision does the model support (whom to offer a retention discount), what defines success (retained margin net of offer cost, not model accuracy), and is ML needed at all? A simple rule, such as contacting everyone whose usage fell by half, was adopted as the baseline that any model must beat.
Stage 1: data and features
The team built features from three sources: the billing database (plan, tenure, payment failures), product usage events (sessions, minutes, features used) and support tickets. The label was defined precisely: a customer churned if they canceled within 30 days after the weekly scoring date. Point-in-time joins (Lesson 2) ensured that features used only data available on the scoring date; an early version that joined the latest support ticket count leaked cancellation calls into the training data and scored an implausible AUC of 0.97, which dropped to 0.81 when fixed. Validation rules guarded each source, and the features were defined in a shared library used by both training and scoring.
Stage 2: experiments and evaluation
Experiments were tracked with code, data and configuration versions (Lesson 3). A gradient boosted tree model beat logistic regression by a clear margin across ten seeds, while a neural network gave no further gain at higher cost, so the trees were chosen. Testing (Lesson 4) included slice evaluation by plan, tenure band and region, invariance tests (customer ID and signup channel should not matter) and directional tests (more payment failures should not lower churn risk), with monotonic constraints added to fix two violations.
The most important evaluation question was the operating threshold. Because the decision has asymmetric costs and benefits, the threshold was chosen by expected profit rather than accuracy.
import numpy as np

# Choosing the operating threshold for a churn model by expected profit, not accuracy
rng = np.random.default_rng(12)
n = 100000
churn = rng.random(n) < 0.08
score = np.clip(rng.normal(np.where(churn, 0.62, 0.30), 0.16), 0, 1)

value_saved = 240.0      # margin kept if a would-be churner is retained
save_rate = 0.25         # share of contacted churners the offer retains
offer_cost = 12.0        # cost of the offer to anyone contacted

print("Threshold  contacted  churners reached  profit")
best = None
for t in np.arange(0.30, 0.81, 0.05):
    contact = score >= t
    reached = (contact & churn).sum()
    profit = reached * save_rate * value_saved - contact.sum() * offer_cost
    if best is None or profit > best[1]:
        best = (t, profit)
    print(f"  {t:.2f}     {contact.sum():7,d}      {reached:6,d}       {profit:10,.0f}")
print(f"Best threshold {best[0]:.2f} with expected profit {best[1]:,.0f}")
accs = {round(t, 2): ((score >= t) == churn).mean() for t in np.arange(0.30, 0.81, 0.05)}
t_acc = max(accs, key=accs.get)
print(f"Accuracy is highest at threshold {t_acc:.2f} ({accs[t_acc]:.3f}), contacting {(score >= t_acc).sum():,} customers")Threshold contacted churners reached profit 0.30 53,775 7,781 -178,440 0.35 42,260 7,577 -52,500 0.40 31,543 7,272 57,804 0.45 22,697 6,795 135,336 0.50 15,868 6,150 178,584 0.55 10,857 5,360 191,316 0.60 7,132 4,371 176,676 0.65 4,714 3,402 147,552 0.70 3,040 2,451 110,580 0.75 1,881 1,656 76,788 0.80 1,132 1,041 48,876 Best threshold 0.55 with expected profit 191,316 Accuracy is highest at threshold 0.65 (0.941), contacting 4,714 customers
Contacting everyone above a score of 0.55 maximizes expected profit, at about 191,000 per 100,000 customers scored, by reaching 5,360 of the 8,000 or so churners while contacting about 10,900 customers. The threshold that maximizes accuracy, 0.65, contacts fewer than half as many customers and earns about 23 % less, because it treats a missed churner (lost margin of 240 at a 25 % save rate) as no worse than an unnecessary offer (12). Too low a threshold is worse still: at 0.30 the campaign loses money by sending offers to tens of thousands of customers who were not leaving. The analysis also showed the assumptions to watch: the save rate and the offer cost, which an experiment must measure.
Stage 3: deployment and serving
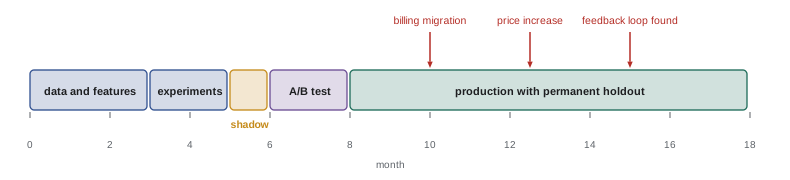
Because decisions were made weekly, batch prediction was the right design (Lesson 1): a pipeline (Lesson 10) ran every Sunday night, validated the week's data, scored all active customers, and wrote the list for Monday's campaign. There was no latency SLO to meet, and the whole scoring job ran on CPUs in about 20 minutes, costing a few dollars a week (Lesson 9). The first release went out as a shadow run alongside the rule-based baseline for three weeks (Lesson 5): both produced contact lists, only the baseline's was used, and the team compared the lists and checked score distributions.
Stage 4: the experiment
The team then ran an A/B test (Lesson 8). Customers were randomized into three groups: a control that received no offers, a group contacted by the rule-based baseline, and a group contacted by the model at the profit-maximizing threshold. Including a no-offer control was essential: without it, the team could not tell whether contacted customers stayed because of the offer or would have stayed anyway. The primary metric was retained margin net of offer costs per customer over 60 days; guardrails were complaint rates and unsubscribes. With about 400,000 customers per arm, the test ran for eight weeks to observe 30-day churn after each weekly campaign.
Worked problem
Reading the experiment
After eight weeks, net margin per customer relative to the no-offer control is +0.55 for the baseline rule (95 % interval +0.20 to +0.90) and +1.62 for the model (95 % interval +1.25 to +1.99). Complaints are unchanged. The measured save rate among contacted churners is 21 %, below the 25 % assumed. What should the team conclude and do?
Show solution
- Both approaches beat doing nothing, and the model's intervals do not overlap the baseline's: the model is clearly better, by about 1.07 per customer per eight weeks.
- Across 1.2 million customers, that is roughly 1.3 million over eight weeks compared with the rule.
- The lower save rate changes the optimal threshold: rerunning the profit analysis with 21 % moves it slightly higher, so the threshold is updated before full rollout.
Answer: Roll out the model to all customers with the recalibrated threshold, keeping a small permanent holdout (for example 2 % of customers receiving no offers) to keep measuring the true effect, because the effect itself can drift.
Stage 5: production life
In its first year, monitoring (Lesson 7) caught three notable events. A billing system migration changed how payment failures were coded; data validation blocked the batch and the pipeline fell back to the previous week's scores until the mapping was fixed. A price increase raised churn across the board (prior drift), and the profit analysis was rerun with the new base rate. And six months in, the permanent holdout showed the model's advantage shrinking: customers who repeatedly received discounts had learned to threaten cancellation to get them, a feedback loop the original design had not anticipated. The team added the number of past offers as a feature, capped offers per customer, and treated the problem as one of uplift modeling (predicting who is persuadable, not just who is at risk), which became the second-year project.
Governance (Lesson 11) placed the model in a medium risk tier: it affects prices offered to customers, so the team documented it in a model card, reviewed offer rates by region and age band for unintended disparities, and recorded every threshold change in the model inventory.
Lessons from the case
The case illustrates the course's main ideas. Business framing and the choice of threshold mattered more than the choice of algorithm. Leakage would have produced a misleading evaluation without point-in-time joins. Batch serving was cheaper and simpler than online serving and entirely adequate. A properly designed experiment with a no-treatment control was the only way to measure real value. Monitoring and a permanent holdout found problems that no offline test could. And the system needed continuous attention after launch: a model is a product with a lifecycle, not a one-off deliverable.
Capstone project
Design and, where possible, build an ML system for a problem of your choice using public or synthetic data. Suitable problems include demand forecasting, fraud or anomaly detection, document classification, recommendation, or predictive maintenance. Your submission should include:
- Problem framing: the decision supported, the business metric, the baseline, and whether batch or online prediction fits.
- A data design: sources, label definition, features with point-in-time logic, validation rules and a data versioning approach.
- Experiment records: tracked runs with at least two model families compared over several seeds, and a model card for the chosen model.
- A test suite: unit tests for features, behavioral tests (at least one invariance and one directional test), slice evaluation, and a golden serving test.
- A deployment and serving plan: packaging, release strategy with promotion and rollback criteria, and either a latency and capacity estimate (online) or a batch schedule and runtime (batch).
- A monitoring plan: what is monitored, drift measures and thresholds, alerts with runbook outlines, and a retraining strategy with champion-challenger gates.
- An experiment design: the A/B test you would run, with primary and guardrail metrics, sample size and duration.
- A cost estimate and a governance note: cost per prediction or per run, risk tier, fairness considerations and the applicable privacy and sector rules in your country.
Where your project uses personal information, explain how it would comply with the applicable federal sector laws and state privacy laws, and whether SR 11-7 model risk guidance or anti-discrimination laws such as ECOA would apply if the user were a bank or lender.
Projects are assessed on the soundness of the design decisions and the consistency between parts: the monitoring plan should watch the features and failure modes your tests identified, the release plan should use the metrics your experiment design defines, and your threshold should follow from the business metric, not from accuracy.
Common mistakes
MistakeChoosing the operating threshold by accuracy.
InsteadChoose it from the business costs and benefits, and revisit it as they change.
MistakeMeasuring a retention campaign without a no-offer control.
InsteadInclude a control to measure the causal effect of the intervention.
MistakeEnding measurement after the launch experiment.
InsteadKeep a small permanent holdout to track the true effect.
MistakeIgnoring how users respond to the model's actions.
InsteadWatch for feedback loops and strategic behavior.
MistakePresenting project parts that do not connect.
InsteadLink tests, monitoring, release and experiment design to the same risks and metrics.
Summary and key terms
- Frame the decision and business metric first, with a simple baseline to beat.
- Point-in-time joins exposed leakage that inflated offline AUC from 0.81 to 0.97.
- The profit-maximizing threshold differed from the accuracy-maximizing one and earned more.
- Batch serving, shadow runs and an experiment with a no-offer control measured real value.
- A permanent holdout revealed a feedback loop that offline testing could not.
- Governance placed the model in a risk tier with fairness reviews and documented changes.
- The capstone integrates data, experiments, tests, deployment, monitoring, experiments, cost and governance.
- Baseline
- A simple approach any model must beat.
- Operating threshold
- The score above which the model triggers an action.
- Expected profit
- Average net value of a decision policy.
- Save rate
- The share of contacted would-be churners retained by an offer.
- No-treatment control
- A group that receives no intervention, to measure causal effect.
- Permanent holdout
- A small group kept outside the model's actions over the long term.
- Uplift modeling
- Predicting the change in outcome caused by an action.
- Strategic behavior
- Users changing behavior in response to a model.
- Recalibration
- Adjusting thresholds or probabilities to new conditions.
- Capstone
- A project integrating the skills of a course.
Practice problems
Work each problem on paper first, then reveal the answer to check.
What baseline did the case use?
Show answer
A rule contacting everyone whose usage fell by half.
How did leakage show itself in the case?
Show answer
An implausible AUC of 0.97 that fell to 0.81 with point-in-time joins.
From the output, which threshold maximizes profit and what is the profit?
Show answer
0.55, about 191,000 per 100,000 customers.
From the output, why does the accuracy-maximizing threshold earn less?
Show answer
It treats missed churners and unnecessary offers as equal, though a missed churner costs far more.
Why was batch prediction appropriate?
Show answer
Decisions were weekly and no real-time features were needed.
Why did the experiment need a no-offer control?
Show answer
To tell whether customers stayed because of the offer or would have stayed anyway.
How should the lower measured save rate affect the threshold?
Show answer
It moves the optimal threshold higher; rerun the profit analysis.
What feedback loop appeared in production?
Show answer
Customers learned to threaten cancellation to get discounts.
What is uplift modeling?
Show answer
Predicting who will change behavior because of an action, not just who is at risk.
Name four parts of the capstone submission.
Show answer
Framing, data design, experiment records, tests, deployment plan, monitoring plan, experiment design, cost and governance.
Lesson quiz · 5 questions
Score 60% or more to complete this lesson.
Create a free account to save your progress, take quizzes and earn a certificate.