
ACCT-341 · Lesson 6 of 12 · 32 min
SQL for accountants II: window functions, CTEs and exception queries
Lesson 5 covered the core of SQL: selecting, filtering, joining and grouping. Those tools answer most summary questions, but accounting analysis often needs more. A running year-to-date total needs each row to see the rows before it. A month-over-month change needs each month to see the previous month. A test for gaps in journal entry numbers needs each entry to see its predecessor. And an exception query that combines several risk indicators quickly becomes unreadable if written as one block. This lesson introduces the features that handle these needs, window functions and common table expressions, and then builds a small toolkit of exception queries of the kind used in internal audit, fraud detection and external audit. The programs reuse the simulated Cedarbrook ledger from lesson 5.
Subqueries and common table expressions
A subquery is a query nested inside another. It can supply a list for IN, a single value for comparison, or a derived table in FROM. Subqueries work, but nesting several makes a query hard to read from the inside out. A common table expression (CTE) solves this by naming each step at the top of the query with WITH, so the logic reads from top to bottom like a series of working-paper schedules.
A CTE has the form WITH step_name AS (SELECT ...), next_step AS (SELECT ... FROM step_name) SELECT ... FROM next_step. Each step can refer to the ones before it. CTEs exist only for the duration of the query; they are not saved. When the same logic is needed repeatedly, a database view, which is a saved query that behaves like a table, can serve the same purpose across many queries. For analysis, CTEs have a further advantage: you can run each step on its own to check its row count and totals, which is exactly the stage-by-stage checking that lessons 3 and 4 recommended.
Window functions
An ordinary aggregate collapses many rows into one per group. A window function computes an aggregate or ranking across a set of rows related to the current row, called its window, but keeps every row in the output. The window is defined by an OVER clause, which can partition the rows into groups and order them within each group.
| Function | What it returns | Accounting use |
|---|---|---|
| SUM(x) OVER (ORDER BY period) | Running total up to the current row | Year-to-date totals; cumulative cash flow |
| SUM(x) OVER (PARTITION BY region) | Group total repeated on every row | Each line's share of its region's total |
| LAG(x) OVER (ORDER BY period) | The value from the previous row | Month-over-month change; gaps in sequences |
| LEAD(x) OVER (ORDER BY period) | The value from the next row | Time until the next payment |
| ROW_NUMBER() OVER (PARTITION BY k ORDER BY d) | A sequence number within each group | Pick the latest record per vendor; number duplicate rows |
| RANK() OVER (ORDER BY x DESC) | Rank with ties sharing a rank | Top customers; largest entries per user |
| AVG(x) OVER (ORDER BY period ROWS 2 PRECEDING) | A moving average over the current and two previous rows | Smoothing monthly sales |
The key distinction is between PARTITION BY, which divides the rows into independent groups, and ORDER BY inside OVER, which orders rows within each partition and, for aggregates, makes the window run from the start of the partition to the current row. SUM(sales) OVER (PARTITION BY region ORDER BY month) therefore gives a running total that restarts for each region. Window functions are evaluated after WHERE, GROUP BY and HAVING, so they can operate on aggregated results, which is why they combine so naturally with CTEs.
Running totals and changes
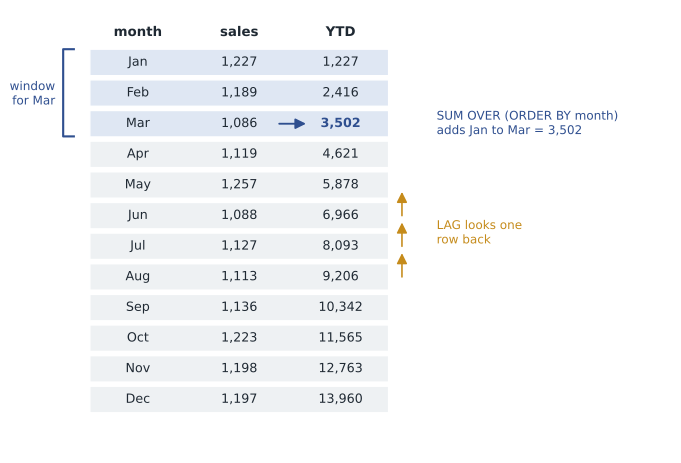
Maya's first query builds a monthly sales summary for the West region in a CTE, then uses two window functions on it: a running sum for the year-to-date total and LAG for the change from the previous month.
# Build a small invented Cedarbrook ledger in an in-memory SQLite database
import sqlite3, random, datetime as dt
random.seed(341)
db = sqlite3.connect(":memory:")
db.executescript("""
CREATE TABLE accounts (acct TEXT PRIMARY KEY, name TEXT, type TEXT);
CREATE TABLE je (je_id INTEGER PRIMARY KEY, posted TEXT, source TEXT,
                 created_by TEXT, approved_by TEXT);
CREATE TABLE lines (je_id INTEGER REFERENCES je, acct TEXT REFERENCES accounts,
                    region TEXT, amount REAL);   -- debit +, credit -
""")
db.executemany("INSERT INTO accounts VALUES (?,?,?)", [
    ("1000", "Cash", "Asset"), ("1100", "Receivables", "Asset"),
    ("1200", "Inventory", "Asset"), ("2100", "Accrued liabilities", "Liability"),
    ("4000", "Sales", "Revenue"), ("5000", "Cost of sales", "Expense"),
    ("6100", "Freight", "Expense"), ("6200", "Wages", "Expense")])
def post(day, source, user, appr, lines):
    cur = db.execute("INSERT INTO je (posted, source, created_by, approved_by)"
                     " VALUES (?,?,?,?)", (day.isoformat(), source, user, appr))
    db.executemany("INSERT INTO lines VALUES (?,?,?,?)",
                   [(cur.lastrowid, a, r, x) for a, r, x in lines])
target = {"North": 15.9, "Central": 23.1, "South": 14.6, "East": 18.4,
          "West": 13.9}                      # 2025 sales, $ millions
for m in range(1, 13):                       # three sales batches a month
    for r, t in target.items():
        for k in range(3):
            day = dt.date(2025, m, 8 + 7 * k)
            s = round(t * 1e6 / 36 * random.uniform(0.85, 1.15), 2)
            c = round(s * (0.85 if r == "West" and m >= 4 else 0.761), 2)
            post(day, "SALES", "batch", "batch", [("1100", r, s),
                 ("4000", r, -s), ("5000", r, c), ("1200", r, -c)])
users = ["mokafor", "jli", "dreyes", "tpatel"]
for n in range(60):                          # manual journal entries
    day = dt.date(2025, 1, 1) + dt.timedelta(days=random.randrange(365))
    amt = random.choice([round(random.uniform(500, 40_000), 2),
                         float(random.choice([5_000, 10_000, 25_000]))])
    u = random.choice(users)
    a = u if n in (17, 44) else random.choice([x for x in users if x != u])
    acct = random.choice(["6100", "6200"])
    post(day, "MANUAL", u, a, [(acct, random.choice(["North", "West"]), amt),
                               ("2100", None, -amt)])
# Monthly West sales with a running total and month-over-month change
q = """
WITH monthly AS (
    SELECT strftime('%m', j.posted) AS month, -SUM(l.amount) / 1e3 AS sales
    FROM lines AS l JOIN je AS j ON j.je_id = l.je_id
    WHERE l.acct = '4000' AND l.region = 'West'
    GROUP BY month
)
SELECT month, ROUND(sales) AS sales_k,
       ROUND(SUM(sales) OVER (ORDER BY month)) AS ytd_k,
       ROUND(sales - LAG(sales) OVER (ORDER BY month)) AS change_k
FROM monthly ORDER BY month;
"""
print("month  sales_k    ytd_k  change_k")
for m, s, y, c in db.execute(q):
print(f"{m:>5}{s:>9,.0f}{y:>9,.0f}{'' if c is None else format(c, ',.0f'):>10}")month sales_k ytd_k change_k 01 1,227 1,227 02 1,189 2,416 -39 03 1,086 3,502 -102 04 1,119 4,621 33 05 1,257 5,878 138 06 1,088 6,966 -169 07 1,127 8,093 39 08 1,113 9,207 -14 09 1,136 10,342 23 10 1,223 11,565 87 11 1,198 12,763 -25 12 1,197 13,960 -1
West's sales were steady through 2025, between about 1.09 and 1.26 million a month, and the year-to-date total reaches about 13.96 million in December, agreeing to the regional total in lesson 5. The month-over-month changes are small, with no sudden jump. Combined with the margin result from lesson 5, this tells Maya that the West margin problem is not a revenue spike but a change in the cost of what West sells from April onward, which narrows the diagnosis further. January has no change because LAG has no previous row and returns NULL, which the program prints as a blank.
Exception queries
An exception query lists the records that break a rule or match a risk profile. Internal auditors, fraud examiners and external auditors use them to direct attention to the transactions most likely to be wrong. Manual journal entries are a favorite subject because they can override the automated controls built into the system. Common risk indicators for journal entries include the following.
| Indicator | Why it matters | How to test in SQL |
|---|---|---|
| Posted on a weekend or holiday | Unusual timing; may avoid review | strftime('%w', posted) IN ('0','6'), or a join to a holiday calendar |
| Round amounts | Estimates and made-up figures are often round | amount % 1000 = 0 |
| Created and approved by the same person | Breaks segregation of duties | created_by = approved_by |
| Large relative to normal activity | Material impact | amount above a threshold or several standard deviations above the mean |
| Posted after period end or near the reporting deadline | Possible earnings management | Posting date after the close date for the period |
| Unusual account combinations | For example, a debit to revenue and credit to an expense | Join debit and credit lines and compare with expected pairs |
| Posted by senior management or rarely used users | Management override risk | created_by in a list, or users with few entries |
| Descriptions with words such as adjust, correct or plug | May signal unsupported entries | description LIKE '%adjust%' |
No single indicator proves anything. Plenty of legitimate entries are round, posted at month end or made by the controller. The power of exception queries comes from combining indicators and focusing on entries that hit several at once. A simple approach is to score each entry by the number of indicators it meets, as Maya does below.
# Build a small invented Cedarbrook ledger in an in-memory SQLite database
import sqlite3, random, datetime as dt
random.seed(341)
db = sqlite3.connect(":memory:")
db.executescript("""
CREATE TABLE accounts (acct TEXT PRIMARY KEY, name TEXT, type TEXT);
CREATE TABLE je (je_id INTEGER PRIMARY KEY, posted TEXT, source TEXT,
                 created_by TEXT, approved_by TEXT);
CREATE TABLE lines (je_id INTEGER REFERENCES je, acct TEXT REFERENCES accounts,
                    region TEXT, amount REAL);   -- debit +, credit -
""")
db.executemany("INSERT INTO accounts VALUES (?,?,?)", [
    ("1000", "Cash", "Asset"), ("1100", "Receivables", "Asset"),
    ("1200", "Inventory", "Asset"), ("2100", "Accrued liabilities", "Liability"),
    ("4000", "Sales", "Revenue"), ("5000", "Cost of sales", "Expense"),
    ("6100", "Freight", "Expense"), ("6200", "Wages", "Expense")])
def post(day, source, user, appr, lines):
    cur = db.execute("INSERT INTO je (posted, source, created_by, approved_by)"
                     " VALUES (?,?,?,?)", (day.isoformat(), source, user, appr))
    db.executemany("INSERT INTO lines VALUES (?,?,?,?)",
                   [(cur.lastrowid, a, r, x) for a, r, x in lines])
target = {"North": 15.9, "Central": 23.1, "South": 14.6, "East": 18.4,
          "West": 13.9}                      # 2025 sales, $ millions
for m in range(1, 13):                       # three sales batches a month
    for r, t in target.items():
        for k in range(3):
            day = dt.date(2025, m, 8 + 7 * k)
            s = round(t * 1e6 / 36 * random.uniform(0.85, 1.15), 2)
            c = round(s * (0.85 if r == "West" and m >= 4 else 0.761), 2)
            post(day, "SALES", "batch", "batch", [("1100", r, s),
                 ("4000", r, -s), ("5000", r, c), ("1200", r, -c)])
users = ["mokafor", "jli", "dreyes", "tpatel"]
for n in range(60):                          # manual journal entries
    day = dt.date(2025, 1, 1) + dt.timedelta(days=random.randrange(365))
    amt = random.choice([round(random.uniform(500, 40_000), 2),
                         float(random.choice([5_000, 10_000, 25_000]))])
    u = random.choice(users)
    a = u if n in (17, 44) else random.choice([x for x in users if x != u])
    acct = random.choice(["6100", "6200"])
    post(day, "MANUAL", u, a, [(acct, random.choice(["North", "West"]), amt),
                               ("2100", None, -amt)])
# Exception query: score manual entries on several risk indicators
q = """
WITH manual AS (
    SELECT j.je_id, j.posted, j.created_by, j.approved_by, l.amount
    FROM je AS j JOIN lines AS l ON l.je_id = j.je_id AND l.amount > 0
    WHERE j.source = 'MANUAL'
),
flags AS (
    SELECT *,
        (strftime('%w', posted) IN ('0', '6'))      AS weekend,
        (amount % 1000 = 0)                         AS round_amt,
        (created_by = approved_by)                  AS self_approved,
        (amount > 30000)                            AS large
    FROM manual
)
SELECT je_id, posted, created_by, amount, weekend, round_amt,
       self_approved, large,
       weekend + round_amt + self_approved + large AS score
FROM flags
WHERE weekend + round_amt + self_approved + large >= 2
ORDER BY score DESC, self_approved DESC, amount DESC;
"""
rows = db.execute(q).fetchall()
print(len(rows), "manual entries with two or more indicators; first eight:")
print(" je  posted      user       amount  wkd rnd self big score")
for r in rows[:8]:
    print(f"{r[0]:>3}  {r[1]}  {r[2]:<8}{r[3]:>10,.2f}"
+ "".join(f"{v:>4}" for v in r[4:8]) + f"{r[8]:>5}")15 manual entries with two or more indicators; first eight: je posted user amount wkd rnd self big score 198 2025-12-01 dreyes 10,000.00 0 1 1 0 2 225 2025-05-27 jli 10,000.00 0 1 1 0 2 209 2025-07-26 tpatel 38,746.09 1 0 0 1 2 228 2025-03-30 jli 34,146.30 1 0 0 1 2 213 2025-08-17 jli 25,000.00 1 1 0 0 2 217 2025-05-31 tpatel 25,000.00 1 1 0 0 2 234 2025-07-05 tpatel 25,000.00 1 1 0 0 2 235 2025-09-13 tpatel 25,000.00 1 1 0 0 2
Fifteen manual entries meet two or more of the four indicators. The two at the top are the most interesting from a control perspective: entries 198 and 225 were created and approved by the same person, which Cedarbrook's policy forbids, and both are for round amounts. Entries 209 and 228 were posted on a weekend for large amounts. Below them, a pattern jumps out: several round 25,000 entries posted on weekends, three of them by the same user. That might be a routine weekend accrual someone always posts, or something else. The query cannot tell; it tells Maya where to look. Her next step is to examine the supporting documents for the top-ranked entries and ask the people who posted them.
Scoring by counting indicators gives each one equal weight. In practice, teams often weight indicators by their risk, so that a self-approved entry counts for more than a round amount, and calibrate thresholds to the business, such as what counts as large. Whatever the method, record the logic and thresholds, because a reviewer will want to understand why particular entries were selected and others were not.
Worked problem
Adding an indicator
Cedarbrook closes each month on the fifth business day of the following month. Maya wants to flag entries posted for a period after that period was closed. Her data include the posting date and the accounting period. How could she add this indicator?
Show solution
- Build a small close calendar table with one row per period and its close date.
- Join entries to the close calendar on the accounting period.
- Add a flag (posted > close_date) in the flags CTE and include it in the score.
- Review any flagged entries for whether the period was reopened with approval, which is a control to check in its own right.
Answer: Join to a close calendar and flag entries whose posting date is after the close date for their period.
Gaps and sequences
Journal entries, invoices, checks and purchase orders are usually numbered in sequence by the system. A gap in the sequence may mean a voided document, a failed transaction, a deleted record or an incomplete extract, and auditors routinely test for gaps and duplicates as part of testing completeness. LAG makes the test easy: compare each number with the previous one and report any jump of more than one. The program below simulates an extract with two entries missing and finds the gap.
# Build a small invented Cedarbrook ledger in an in-memory SQLite database
import sqlite3, random, datetime as dt
random.seed(341)
db = sqlite3.connect(":memory:")
db.executescript("""
CREATE TABLE accounts (acct TEXT PRIMARY KEY, name TEXT, type TEXT);
CREATE TABLE je (je_id INTEGER PRIMARY KEY, posted TEXT, source TEXT,
                 created_by TEXT, approved_by TEXT);
CREATE TABLE lines (je_id INTEGER REFERENCES je, acct TEXT REFERENCES accounts,
                    region TEXT, amount REAL);   -- debit +, credit -
""")
db.executemany("INSERT INTO accounts VALUES (?,?,?)", [
    ("1000", "Cash", "Asset"), ("1100", "Receivables", "Asset"),
    ("1200", "Inventory", "Asset"), ("2100", "Accrued liabilities", "Liability"),
    ("4000", "Sales", "Revenue"), ("5000", "Cost of sales", "Expense"),
    ("6100", "Freight", "Expense"), ("6200", "Wages", "Expense")])
def post(day, source, user, appr, lines):
    cur = db.execute("INSERT INTO je (posted, source, created_by, approved_by)"
                     " VALUES (?,?,?,?)", (day.isoformat(), source, user, appr))
    db.executemany("INSERT INTO lines VALUES (?,?,?,?)",
                   [(cur.lastrowid, a, r, x) for a, r, x in lines])
target = {"North": 15.9, "Central": 23.1, "South": 14.6, "East": 18.4,
          "West": 13.9}                      # 2025 sales, $ millions
for m in range(1, 13):                       # three sales batches a month
    for r, t in target.items():
        for k in range(3):
            day = dt.date(2025, m, 8 + 7 * k)
            s = round(t * 1e6 / 36 * random.uniform(0.85, 1.15), 2)
            c = round(s * (0.85 if r == "West" and m >= 4 else 0.761), 2)
            post(day, "SALES", "batch", "batch", [("1100", r, s),
                 ("4000", r, -s), ("5000", r, c), ("1200", r, -c)])
users = ["mokafor", "jli", "dreyes", "tpatel"]
for n in range(60):                          # manual journal entries
    day = dt.date(2025, 1, 1) + dt.timedelta(days=random.randrange(365))
    amt = random.choice([round(random.uniform(500, 40_000), 2),
                         float(random.choice([5_000, 10_000, 25_000]))])
    u = random.choice(users)
    a = u if n in (17, 44) else random.choice([x for x in users if x != u])
    acct = random.choice(["6100", "6200"])
    post(day, "MANUAL", u, a, [(acct, random.choice(["North", "West"]), amt),
                               ("2100", None, -amt)])
# Gap test: are any journal entry numbers missing from the extract?
db.execute("DELETE FROM lines WHERE je_id IN (131, 132)")  # simulate an
db.execute("DELETE FROM je WHERE je_id IN (131, 132)")     # incomplete extract
q = """
SELECT prev_id + 1 AS first_missing, je_id - 1 AS last_missing
FROM (SELECT je_id, LAG(je_id) OVER (ORDER BY je_id) AS prev_id FROM je)
WHERE je_id - prev_id > 1;
"""
print(db.execute(q).fetchall())[(131, 132)]
The query reports that entries 131 to 132 are missing. Maya would ask why: were they voided, are they in a different extract, or was the extract incomplete? Note that some systems legitimately skip numbers, for example when several users reserve blocks of numbers at once, so a gap is a question, not a conclusion. The reverse test, numbers that appear more than once, uses GROUP BY with HAVING COUNT(*) > 1, which lesson 5 introduced.
Picking one row per group
A frequent need is to choose one record per entity: the most recent address for each vendor, the latest price for each item, the first payment after each invoice. ROW_NUMBER() OVER (PARTITION BY vendor ORDER BY changed_on DESC) numbers each vendor's records from newest to oldest, and an outer query keeps rows where the number is 1. The same pattern numbers duplicate rows so that all but the first can be flagged, which is a cleaner alternative to deleting duplicates. It is also how analysts build point-in-time views, such as the vendor bank account in effect on the date of each payment, which lesson 11 uses to test changes to vendor bank details.
Exceptions with a purpose
Exception queries are powerful, and with power comes the risk of drowning in results. A query that returns 4,000 exceptions is not a test; it is a new population. Before running exception queries, decide what you will do with the results, how many you can investigate, and how you will treat false positives. Refine indicators on a sample, tighten thresholds, combine conditions, and rank results so that investigation effort goes to the highest-risk items first. Lesson 11 discusses how auditors handle large numbers of exceptions in a way that meets the standards.
Once an exception query is reliable, it can be scheduled to run every month or every day, turning a one-off analysis into continuous monitoring. Many companies run exception reports on journal entries, vendor master changes and payments automatically and route results to a reviewer. That is the act and track step of the analytics cycle in practice.
Common mistakes
MistakeNesting subqueries several levels deep.
InsteadUse CTEs so each step is named, readable and testable.
MistakeExpecting a window function to reduce the number of rows.
InsteadWindow functions keep every row; use GROUP BY to collapse rows.
MistakeForgetting PARTITION BY when totals should restart for each group.
InsteadPartition by the grouping column so each group has its own window.
MistakeTreating every exception as an error.
InsteadExceptions are leads; investigate with supporting documents before concluding.
MistakeRunning exception queries without a plan for the results.
InsteadSet thresholds, rank results and decide in advance how many items will be followed up.
Summary and key terms
- CTEs name each step of a query with WITH, making complex logic readable and checkable stage by stage.
- Window functions compute across related rows while keeping every row; OVER defines the window.
- PARTITION BY restarts the window for each group; ORDER BY inside OVER makes running totals.
- LAG and LEAD compare a row with the previous or next row: changes, gaps and time between events.
- ROW_NUMBER picks one row per group, such as the latest record per vendor.
- Exception queries combine risk indicators such as weekend postings, round amounts and self-approval.
- Indicators are leads, not conclusions; rank results and investigate the highest-risk items first.
- Subquery
- A query nested inside another query.
- Common table expression (CTE)
- A named, temporary result defined with WITH at the start of a query.
- View
- A saved query that can be used like a table.
- Window function
- A function computed over a set of rows related to the current row, without collapsing rows.
- PARTITION BY
- The part of an OVER clause that divides rows into independent groups.
- LAG
- A window function returning a value from a previous row.
- ROW_NUMBER
- A window function that numbers rows within each partition.
- Exception query
- A query that lists records breaking a rule or matching a risk profile.
- Risk indicator
- A characteristic associated with a higher likelihood of error or fraud.
- Continuous monitoring
- Running analytics automatically and repeatedly to detect issues as they arise.
Practice problems
Work each problem on paper first, then reveal the answer to check.
What does SUM(sales) OVER (PARTITION BY region ORDER BY month) return?
Show answer
A running total of sales that restarts for each region.
Why does January show no change in the first program?
Show answer
LAG has no previous row and returns NULL.
Change the first program to show a three-month moving average. What window frame would you use?
Show answer
AVG(sales) OVER (ORDER BY month ROWS BETWEEN 2 PRECEDING AND CURRENT ROW).
In the exception program, why are entries 198 and 225 listed first?
Show answer
They were created and approved by the same person, which the sort ranks first among entries with the same score.
Change the round-amount test to multiples of 5,000. Would the 25,000 entries still be flagged?
Show answer
Yes; 25,000 is a multiple of 5,000.
Name two legitimate reasons for a gap in journal entry numbers.
Show answer
Voided entries, failed postings, or blocks of numbers reserved by different users.
How would you list vendor numbers that appear more than once in the vendor master?
Show answer
GROUP BY vendor number HAVING COUNT(*) > 1.
What pattern picks the latest bank account record for each vendor?
Show answer
ROW_NUMBER() OVER (PARTITION BY vendor ORDER BY changed_on DESC), then keep row number 1.
Why weight risk indicators rather than count them?
Show answer
Some indicators, such as self-approval, signal much higher risk than others, such as round amounts.
What turns an exception query into continuous monitoring?
Show answer
Scheduling it to run automatically and routing results to a reviewer.
Lesson quiz · 5 questions
Score 60% or more to complete this lesson.
Create a free account to save your progress, take quizzes and earn a certificate.