
ACCT-341 · Lesson 1 of 12 · 29 min
The analytics mindset: from question to insight
Accountants have always analyzed data. A ratio, a variance report, a reconciliation and an aging schedule are all analytics. What has changed is the volume of data, the tools available to work with it, and the expectations of the people who rely on accountants. A mid-sized company now records millions of transactions a year in an enterprise resource planning (ERP) system, and every one of them can be extracted, filtered, joined and summarized in minutes. Managers expect finance to explain not just what happened last month but why it happened and what is likely to happen next. Auditors are expected to look at whole populations rather than small samples where the data allow it. This course teaches the skills to meet those expectations: preparing data, querying it with SQL, analyzing it with spreadsheets and Python, visualizing it honestly, and applying analytics in audit, tax and advisory work.
This first lesson is about mindset rather than tools. The most common failure in analytics is not a coding error or a wrong formula. It is a well-executed analysis of the wrong question, on data nobody checked, presented in a way that does not lead to a decision. A good analyst starts with the decision someone needs to make, works out what evidence would help, and only then opens the data.
The running example
Throughout the course we follow one invented company, Cedarbrook Supply Inc., a wholesale distributor of plumbing, heating and electrical supplies headquartered in Fargo, North Dakota. Cedarbrook sells to about 3,000 contractor and institutional customers through five regional branches, which its reports call North, Central, South, East and West. It buys from about 900 vendors, employs 240 people and had revenue of roughly $86 million in its fiscal year ended December 31, 2025. It runs a mid-market cloud ERP system, reports under US GAAP, and is audited by an invented firm, Halden Rowe LLP. Its controller, Daniel Reyes, has asked a staff accountant with an interest in data, Maya Okafor, to build Cedarbrook's analytics capability. Every company, person and figure in the course is invented for teaching.
Four kinds of analytics
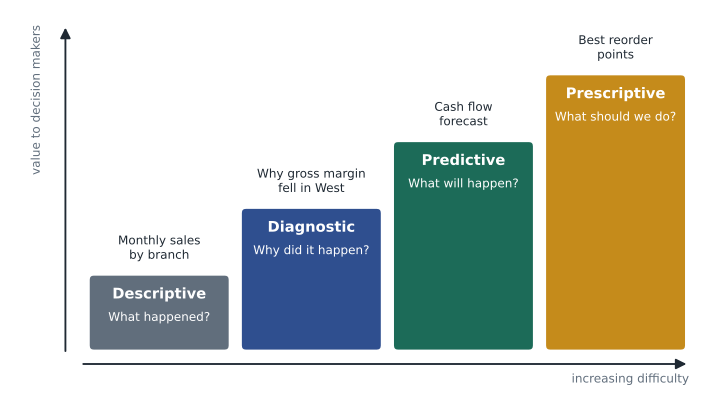
Analytics is often described in four levels, each answering a harder question than the one before. The levels are a convenient way to think about what an analysis is for, not a strict hierarchy: most real projects mix them.
| Type | Question it answers | Accounting examples | Typical techniques |
|---|---|---|---|
| Descriptive | What happened? | Monthly sales by branch; trial balance; aging summary | Totals, averages, counts, pivot tables, ratios |
| Diagnostic | Why did it happen? | Why gross margin fell; why a cost center is over budget; why receivables days rose | Drill-down, variance analysis, segmentation, correlation |
| Predictive | What is likely to happen? | Cash flow forecast; which customers will pay late; expected returns | Regression, time series, classification models |
| Prescriptive | What should we do? | Optimal reorder points; which invoices to pay early for a discount; staffing | Optimization, simulation, decision rules |
Descriptive analytics is the bread and butter of accounting and should not be dismissed as simple. A correct, well-reconciled description of what happened is the foundation for everything else, and many costly errors come from descriptive work done carelessly: a filter that silently dropped a branch, a join that duplicated rows, a date field read as text. Diagnostic analytics is where accountants often add the most value, because explaining a variance requires knowing how the business works and how transactions are recorded. Predictive and prescriptive analytics borrow more from statistics and operations research. Lesson 10 introduces regression and forecasting; prescriptive methods are touched on only lightly in this course.
The analytics cycle
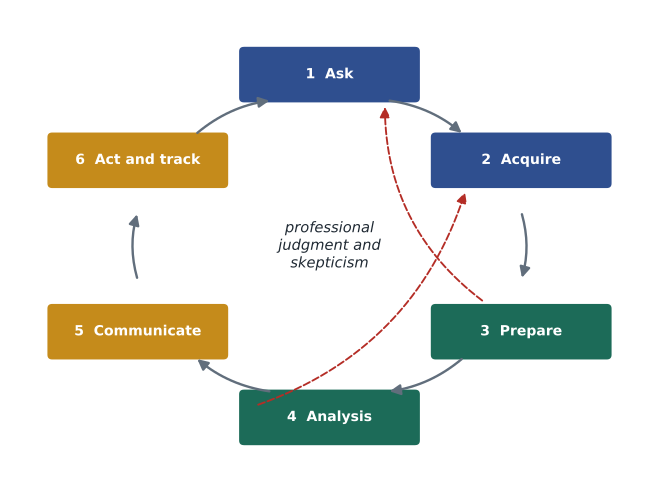
Several frameworks describe how an analytics project runs. CRISP-DM, the cross-industry standard process for data mining, dates from the late 1990s and is still widely used. Accounting textbooks often teach the IMPACT model: identify the question, master the data, perform the test plan, address and refine results, communicate insights, and track outcomes. This course uses a simple six-step cycle that matches both.
| Step | What it involves | Key question for the accountant |
|---|---|---|
| 1. Ask | Define the decision, the question and what a useful answer looks like | Who will use the answer, and what will they do differently? |
| 2. Acquire | Identify and extract the data; confirm it is complete | Does the extract reconcile to the ledger or another trusted total? |
| 3. Prepare | Clean, transform, join and document the data | What did I change, and could someone repeat it? |
| 4. Analyze | Apply the test plan: summaries, comparisons, models | Is the result plausible, and what else could explain it? |
| 5. Communicate | Present findings clearly to the decision maker | Does the visual or memo lead to the decision without distorting it? |
| 6. Act and track | Implement the decision and monitor the outcome | Did the action work, and should the analysis be repeated? |
The cycle is iterative. Preparing data often reveals that the question was poorly framed, and the first analysis usually raises new questions. Experienced analysts expect to loop back. What they avoid is skipping steps: jumping straight from a vague request to a chart, or presenting a result without checking that the data were complete.
Step 1: asking a good question
Requests to finance usually arrive as vague concerns. "Margins look soft." "Can you look at our receivables?" "The auditors want analytics." The analyst's first job is to turn the concern into a question specific enough to answer with data. A useful test is to ask what decision the answer will support and what result would change that decision. If no plausible result would change anything, the analysis is not worth doing.
Good analytical questions share a few features. They are specific about the measure, the population and the period: not "are margins soft?" but "which branches and product categories account for the fall in gross margin percentage from fiscal 2024 to fiscal 2025?" They are answerable with data that exist or can be obtained at reasonable cost. They are tied to a decision or a risk. And they come with a sense of what a material answer looks like, so the analyst knows when to stop digging.
It also helps to state hypotheses before looking at the data. If Maya suspects that margins fell because of a price war in one region, rising freight costs, a shift toward lower-margin products, or a costing error, she can write those down and design tests to distinguish them. Writing hypotheses first guards against a well-known trap: looking at enough slices of data until something interesting appears and then telling a story about it. With dozens of branches, categories and months, some slices will look unusual by chance alone.
Worked problem
Framing the margin question
Daniel Reyes tells Maya that Cedarbrook's gross margin "fell off a cliff" last year and asks her to find out why before the board meeting. How should she frame the work?
Show solution
- Clarify the decision: the board will decide whether to change pricing policy, renegotiate a large contract or investigate costing.
- State the question: which branches, customers and product categories explain the change in gross margin percentage from fiscal 2024 to fiscal 2025?
- List hypotheses: a regional price war; higher freight costs; a shift to lower-margin products; a large low-margin contract; an error in standard costs or inventory valuation.
- Decide the materiality of the answer: a change of more than half a percentage point in any segment is worth explaining.
- Identify the data: invoice lines with revenue and cost, the customer and item masters, and the general ledger totals to reconcile to.
Answer: A specific question with stated hypotheses, a materiality threshold and a plan to reconcile the data to the ledger.
A first look at the data
Maya starts with a descriptive summary. She takes revenue and cost of goods sold by region for both years, already reconciled to the general ledger, and computes the margin percentage overall and by region. The program below uses pandas, the Python library for tabular data that we use throughout the course. You do not need to follow every line yet; lessons 3 and 4 build these skills step by step. Focus on the logic: compute the overall change, then break it down to see where it comes from.
# Cedarbrook: why did gross margin fall? (invented data)
import pandas as pd
sales = pd.DataFrame({
    "year":    [2024]*5 + [2025]*5,
    "region":  ["North", "Central", "South", "East", "West"] * 2,
    "revenue": [15.2, 22.4, 14.1, 17.8, 11.3, 15.9, 23.1, 14.6, 18.4, 13.9],
    "cogs":    [11.5, 17.0, 10.7, 13.5,  8.6, 12.1, 17.6, 11.1, 14.0, 11.5],
})                                   # $ millions
sales["margin_pct"] = (1 - sales["cogs"] / sales["revenue"]) * 100
total = sales.groupby("year")[["revenue", "cogs"]].sum()
total["margin_pct"] = (1 - total["cogs"] / total["revenue"]) * 100
print(total.round(1))
wide = sales.pivot(index="region", columns="year", values="margin_pct")
wide["change"] = wide[2025] - wide[2024]
print(wide.round(1).sort_values("change"))revenue cogs margin_pct year 2024 80.8 61.3 24.1 2025 85.9 66.3 22.8 year 2024 2025 change region West 23.9 17.3 -6.6 North 24.3 23.9 -0.4 Central 24.1 23.8 -0.3 East 24.2 23.9 -0.2 South 24.1 24.0 -0.1
The overall margin fell from 24.1 percent to 22.8 percent, a drop of 1.3 percentage points on revenue of about $86 million, worth roughly a million dollars of gross profit. The regional breakdown shows that the change is concentrated in one place. Four regions moved by less than half a point, but the West region's margin fell from 23.9 percent to 17.3 percent while its revenue jumped from 11.3 million to 13.9 million. The diagnosis has narrowed from "margins are soft" to "something happened in the West, and it came with a lot of new revenue." That points toward the large-contract hypothesis, though it does not prove it. The next step is to drill into West's customers and products, which Maya does in lesson 7.
Two habits stand out in this small example. First, the data were reconciled to the ledger before any analysis: the regional figures add up to the reported revenue and cost of sales. Second, the analysis compared like with like and expressed the change in a way the reader can judge, in both percentage points and dollars. A margin change of 1.3 points sounds small until it is translated into a million dollars.
Professional skepticism and judgment
Analytics does not replace professional judgment; it depends on it. Data can be incomplete, mislabeled or manipulated. A strong pattern can have a boring explanation, such as a change in how a field was coded or a system migration midway through the year. An absence of exceptions can mean that controls work, or that the test was designed so it could never find anything. Skepticism in analytics means asking, at every step, how the result could be wrong.
- Where did the data come from, who controls that system, and could anyone have changed it?
- Does the data reconcile to an independent total, such as the general ledger or a bank statement?
- Is the population complete, or did a filter, a join or an extraction parameter drop records?
- Is the result plausible given what I know about the business? If not, is the business different from what I thought, or is the analysis wrong?
- What other explanations fit the same pattern, and what test would distinguish them?
Judgment also matters in deciding how far to go. Analytics has costs: staff time, software, data access and the risk of drawing conclusions from noise. The aim is not the most sophisticated analysis but the simplest one that answers the question reliably. A pivot table that settles the matter in ten minutes beats a machine learning model that takes a week and that nobody can explain.
Tools of the trade
Accountants use a layered set of tools, and part of the skill is choosing the right one for the job. Spreadsheets remain the most widely used analytics tool in finance because they are flexible, visible and understood by everyone. Their weaknesses are scale, auditability and the ease of introducing silent errors, such as a formula range that misses new rows. Modern spreadsheet features such as Power Query in Excel reduce some of these risks by recording each data preparation step so it can be repeated.
| Tool | Strengths | Limits | Used in this course for |
|---|---|---|---|
| Spreadsheets (Excel, Google Sheets) | Flexible, visible, universal; pivot tables and Power Query | Limited scale; hidden formula errors; weak version control | Quick analysis, cleaning recipes, small models |
| SQL databases | Handles large data; precise, repeatable queries; the language of ERP data | Requires knowing the table structure; less suited to statistics | Extracting, joining, aggregating, exception queries |
| Python or R | Repeatable scripts; statistics and machine learning; automation | Programming skill; needs review and version control | Cleaning, analysis, forecasting, anomaly detection |
| Business intelligence (Power BI, Tableau) | Interactive dashboards; data models; sharing | Can hide weak data behind attractive visuals; licensing | Dashboards and communicating results |
| Audit data analytics software | Read-only access to data; logs of every step; built-in audit tests | Specialized; licensing | Concepts discussed in lesson 11 |
This course uses Python with pandas and SQLite for its worked examples because they are free, run anywhere and make every step explicit, so you can rerun each program and get exactly the output shown. The concepts transfer directly to Excel, Power Query, Power BI, Tableau, and the audit tools that firms license. Where a spreadsheet technique is the natural choice, the lessons describe it.
Why this matters for your career
Data analytics is now part of the core expectations of the profession. Since January 2024, the Uniform CPA Examination has followed the CPA Evolution model, with core sections that test data and technology skills alongside accounting, auditing and tax, and a Business Analysis and Reporting discipline section that covers data analytics in more depth. Firms and employers increasingly hire for the combination of accounting knowledge and data skills, because an accountant who understands both the ledger and the query can find problems that neither a pure accountant nor a pure data scientist would see.
The rest of the course follows the analytics cycle. Lessons 2 to 4 cover acquiring and preparing data. Lessons 5 and 6 teach SQL. Lesson 7 covers descriptive and diagnostic analysis, and lessons 8 and 9 cover visualization and dashboards. Lesson 10 introduces prediction. Lesson 11 applies everything to audit, and lesson 12 covers governance, ethics and artificial intelligence, then ties it all together in a capstone.
Common mistakes
MistakeStarting with the data and looking for something interesting.
InsteadStart with a decision and a specific question, state hypotheses, then choose the data and tests.
MistakeTreating descriptive analytics as too basic to matter.
InsteadCorrect, reconciled descriptions are the foundation; many costly errors are descriptive errors.
MistakePresenting a result without reconciling the data to a trusted total.
InsteadReconcile extracts to the general ledger or another independent source before analyzing them.
MistakeReporting a change only in percentages.
InsteadExpress changes in units the decision maker can judge, such as dollars as well as percentage points.
MistakeReaching for the most sophisticated tool.
InsteadUse the simplest method that answers the question reliably and that others can review.
Summary and key terms
- Analytics in accounting ranges from descriptive (what happened) through diagnostic (why) and predictive (what will happen) to prescriptive (what to do).
- The analytics cycle runs ask, acquire, prepare, analyze, communicate, and act and track, with frequent loops back.
- A good question is specific about the measure, population and period, tied to a decision, and answerable at reasonable cost.
- Stating hypotheses first protects against finding patterns in noise.
- Professional skepticism applies to data: check the source, completeness, plausibility and alternative explanations.
- Spreadsheets, SQL, Python, BI tools and audit software form a layered toolkit; choose the simplest tool that works.
- In the Cedarbrook example, a 1.3-point fall in gross margin, about a million dollars, is concentrated in the West region.
- Descriptive analytics
- Analysis that summarizes what has happened.
- Diagnostic analytics
- Analysis that explains why something happened.
- Predictive analytics
- Analysis that estimates what is likely to happen.
- Prescriptive analytics
- Analysis that recommends a course of action.
- Analytics cycle
- The iterative process of asking, acquiring, preparing, analyzing, communicating, and acting and tracking.
- Hypothesis
- A proposed explanation, stated before testing, that the data can support or contradict.
- Reconciliation
- Agreeing a data set to an independent trusted total to confirm completeness and accuracy.
- Percentage point
- The arithmetic difference between two percentages.
- ERP system
- Enterprise resource planning software that records a company's transactions in an integrated database.
- pandas
- A Python library for working with tables of data.
Practice problems
Work each problem on paper first, then reveal the answer to check.
Classify this question: "Which customers are likely to pay more than 60 days late next quarter?"
Show answer
Predictive.
Classify: "Why did freight expense rise 18 percent?"
Show answer
Diagnostic.
Rewrite "look at our receivables" as a specific analytical question.
Show answer
For example: which customers and branches account for the rise in days sales outstanding from 41 to 48 days between December 2024 and December 2025?
Why should hypotheses be written down before the analysis?
Show answer
To design tests that distinguish them and to avoid telling stories about patterns found by chance.
In the program, by how many percentage points did the West region's margin fall?
Show answer
6.6 points, from 23.9 to 17.3 percent.
Roughly what is the overall margin decline worth in gross profit?
Show answer
About 1.3 percent of 86 million, or roughly 1.1 million dollars.
Name two checks that show an extract is complete.
Show answer
Reconcile totals to the general ledger; compare record counts and date ranges to the source system.
Give one weakness of spreadsheets for analytics.
Show answer
Limited scale, hidden formula errors, or weak version control.
What is the IMPACT model?
Show answer
A six-step analytics framework: identify the question, master the data, perform the test plan, address and refine results, communicate insights, track outcomes.
Change the West region's 2025 cost of goods sold to 10.6 in the program. Roughly what is its new margin?
Show answer
About 23.7 percent, close to the other regions.
Lesson quiz · 5 questions
Score 60% or more to complete this lesson.
Create a free account to save your progress, take quizzes and earn a certificate.