
ACCT-341 · Lesson 2 of 12 · 30 min
Accounting data: sources, structures and quality
Before any analysis, an accountant has to know where the data live, how they are structured and how far they can be trusted. This lesson surveys the sources of accounting data, from the general ledger to e-mail, explains how transaction data are organized in an ERP system, and introduces the dimensions of data quality. It ends with two techniques that every analysis should begin with: profiling the data to find problems, and reconciling the data to independent control totals to prove they are complete. Lesson 3 then turns to fixing the problems that profiling uncovers.
Where accounting data live
Most of a company's financial data originates in its ERP system and the specialized applications around it. An ERP system integrates modules for sales, purchasing, inventory, payroll and the general ledger in a single database, so that one business event, such as shipping goods to a customer, updates every affected record at once. Around the ERP there are usually other systems: a point-of-sale or e-commerce platform, a payroll provider, a bank portal, an expense management app, a customer relationship management (CRM) system, spreadsheets maintained by individual staff, and documents such as contracts, invoices and e-mails.
Cedarbrook's ERP holds its general ledger, receivables, payables, inventory and order management. Payroll is run by an outside payroll provider and summarized into the ledger each pay period. Customer contracts and rebate agreements are PDF files on a shared drive, and the sales team tracks quotes in a separate CRM. Bank transactions arrive daily as an electronic file from Cedarbrook's bank.
| Kind of data | What it describes | Cedarbrook examples | How often it changes |
|---|---|---|---|
| Master data | The relatively stable entities the business deals with | Customers, vendors, items, employees, chart of accounts | Occasionally; changes should be controlled and logged |
| Transaction data | Business events, each with a date and amount | Sales invoices, purchase orders, receipts, payments, journal entries | Continuously; high volume |
| Reference data | Codes and lookup values used by other data | Branch codes, payment terms, tax codes, currency rates | Rarely |
| Audit and log data | Who did what and when in the system | User logins, master file change logs, approval histories | Continuously |
| Unstructured data | Content without a fixed table layout | Contracts, e-mails, scanned receipts, meeting notes | Varies |
The distinction between master and transaction data matters for analytics because errors behave differently in each. A single wrong transaction affects one entry. A wrong master record, such as a vendor with the wrong bank account or a customer with an excessive credit limit, affects every transaction that uses it. That is why changes to master data are a favorite target for both controls and fraud, and why lesson 11 includes tests of the vendor master file.
How transaction data are structured
ERP systems store data in relational tables, which ACCT-240 introduced. Each table holds one kind of thing, each row is one instance, and each column is one attribute. A primary key uniquely identifies each row, and foreign keys link rows in one table to rows in another. A sales invoice, for example, is usually stored as a header row (invoice number, customer, date, terms) in one table and several line rows (item, quantity, price) in another, linked by the invoice number.
Journal entries follow the same header-and-line pattern. The header records the entry number, the posting date, the effective date, the source (such as sales, payables or manual), the user who created it and who approved it. The lines record the account, the debit or credit amount, and often dimensions such as branch, department or project. Every journal entry must balance: total debits equal total credits. Analysts who understand this structure can test it directly, for example by checking that every entry balances or that no manual entry was approved by the person who created it.
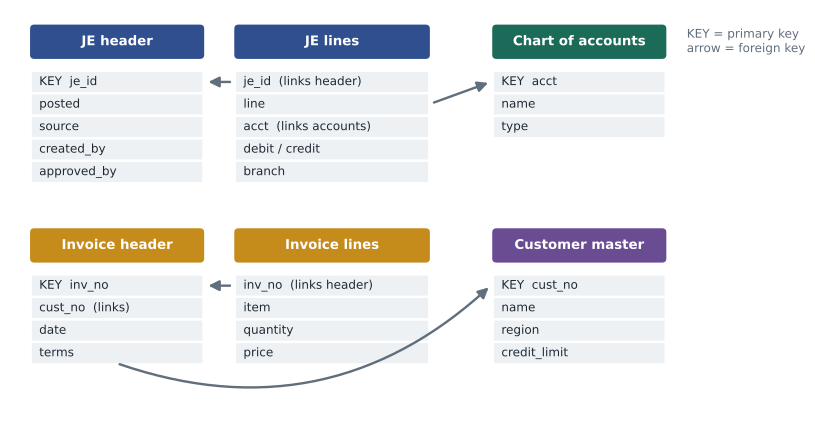
Granularity is the level of detail in each row. An invoice line table is more granular than an invoice header table, which is more granular than a monthly sales summary. Analysts should use the finest granularity they need and no finer, and they must be careful never to mix levels in one calculation. Adding header-level freight charges to every line of an invoice, for instance, counts the freight once per line rather than once per invoice. Lesson 4 returns to this trap when it covers joins.
File formats
Data reach the analyst in many formats. Each has quirks that can corrupt the data on the way in.
| Format | Description | Watch out for |
|---|---|---|
| CSV (comma-separated values) | Plain text, one row per line, fields separated by commas | Commas inside fields; leading zeros dropped from codes; dates read in the wrong order; text encoding |
| Excel workbook | Spreadsheet file with sheets, formatting and formulas | Merged cells, subtotals mixed with data, hidden rows, numbers stored as text |
| Fixed-width text | Fields in fixed character positions, common in older systems | Wrong column boundaries; implied decimal points |
| JSON and XML | Nested text formats used by APIs and web services | Nested records must be flattened; missing keys |
| XBRL | XML-based tagged financial statements | Taxonomy versions; extension elements; sign conventions |
| PDF reports | Formatted documents meant for people, not machines | Extraction errors; page headers and footers inside the data |
| Database extract or API | Direct read from the system | Access rights; query parameters that silently filter records |
A classic example is the loss of leading zeros. Cedarbrook's general ledger account codes are four-digit strings, and its vendor numbers start with zeros, such as 00417. When a CSV file is opened in a spreadsheet, the program may treat these as numbers and display 417, which no longer matches the vendor master. Dates are another trap: 03/04/2025 is March 4 in the United States and 3 April in much of the world. The safe practice is to import data with explicit types, reading codes as text and dates with a stated format, rather than letting software guess.
Audit data standards
Because every ERP system stores data differently, extracting comparable data for analysis can take more time than the analysis itself. To reduce that effort, the AICPA's Assurance Services Executive Committee published voluntary Audit Data Standards that define a common layout for general ledger, accounts receivable, accounts payable, inventory and other data, with standard field names and formats. Some software vendors and firms use these layouts so that one set of tests can run on data from many clients. You do not need to memorize the standards, but you should recognize that agreeing a data layout and a data dictionary up front makes analysis faster and more reliable.
A data dictionary describes each field: its name, meaning, data type, allowed values, source system and owner. When Maya receives a new extract, the first thing she asks for is the data dictionary, or she writes one herself. Knowing that the field called date is the posting date and not the document date, or that amounts are stored in cents, prevents some of the most embarrassing analytical errors.
Dimensions of data quality
Data quality is usually described along several dimensions. Different sources list slightly different sets, but the following six are widely used and map naturally onto accounting concerns. Note how closely they resemble the financial statement assertions you know from auditing: completeness, accuracy, occurrence and cut-off all have data quality counterparts.
| Dimension | Meaning | Example test on Cedarbrook data |
|---|---|---|
| Completeness | All expected records and values are present | Record counts and totals agree to the ledger; no missing account codes |
| Accuracy | Values correctly describe the real-world event | Invoice amounts agree to shipping records and price lists |
| Validity | Values conform to rules and allowed formats | Dates are real dates; account codes exist in the chart of accounts |
| Consistency | The same thing is recorded the same way across records and systems | Customer names match between ERP and CRM; one sign convention |
| Uniqueness | Each real-world item is recorded once | No duplicate invoice numbers or duplicate vendor records |
| Timeliness | Data are available and current when needed | Bank feed loaded daily; month-end entries posted before reporting |
Poor data quality has direct costs, such as duplicate payments and mispriced invoices, and indirect costs, such as decisions based on wrong numbers and time spent fixing reports. For analytics, the most dangerous problems are the silent ones: errors that do not cause a program to fail but quietly change the result. A missing account code may drop a line from a total. A duplicated row may double a sale. The defense is to test data quality explicitly, before analyzing, rather than trusting that an extract is clean.
Profiling the data
Data profiling is a systematic first look at a data set to understand its structure and spot quality problems. A basic profile counts rows and distinct values, finds missing values in each column, checks that dates and numbers parse, looks for duplicate keys, and tests simple business rules. For a journal entry extract, the most important business rule is that each entry balances.
Maya profiles a small extract of journal entry lines from Cedarbrook's ERP. Real extracts have thousands or millions of rows, but the same checks apply.
# Profiling a general ledger extract before using it (invented data)
import pandas as pd
gl = pd.DataFrame({
    "je_id":   ["J1001", "J1001", "J1002", "J1002", "J1003", "J1003",
                "J1004", "J1004", "J1004", "J1005", "J1005", "J1005"],
    "line":    [1, 2, 1, 2, 1, 2, 1, 2, 3, 1, 2, 2],
    "posted":  ["2025-03-02", "2025-03-02", "2025-03-05", "2025-03-05",
                "2025-03-31", "2025-03-31", "2025-13-01", "2025-13-01",
                "2025-13-01", "2025-03-09", "2025-03-09", "2025-03-09"],
    "account": ["4000", "1100", "5000", "2000", "6100", "2000",
                "1100", "4000", None, "6200", "1000", "1000"],
    "debit":   [0, 1250, 830, 0, 410, 0, 990, 0, 0, 75, 0, 0],
    "credit":  [1250, 0, 0, 830, 0, 410, 0, 900, 90, 0, 75, 75],
    "user":    ["mokafor", "mokafor", "jli", "jli", "dreyes", "dreyes",
                "jli", "jli", "jli", "batch", "batch", "batch"],
})
print("rows:", len(gl), " journal entries:", gl["je_id"].nunique())
print("missing values by column:")
print(gl.isna().sum()[lambda s: s > 0].to_string())
dates = pd.to_datetime(gl["posted"], errors="coerce")
print("unparseable dates:", dates.isna().sum())
dup = gl.duplicated(["je_id", "line"], keep=False)
print("duplicate je_id/line keys:", dup.sum())
bal = gl.groupby("je_id")[["debit", "credit"]].sum()
bal["diff"] = bal["debit"] - bal["credit"]
print("unbalanced entries:")
print(bal[bal["diff"] != 0].to_string())rows: 12 journal entries: 5
missing values by column:
account 1
unparseable dates: 3
duplicate je_id/line keys: 2
unbalanced entries:
debit credit diff
je_id
J1005 75 150 -75The profile finds four problems in twelve rows. One line has no account code. Three lines carry the date 2025-13-01, which is not a real date: month 13 may be how the system records a year-end adjustment period, a common ERP practice, or it may be an error, and Maya must find out which before treating these lines as invalid. Two rows share the key J1005 line 2, a duplicate that makes entry J1005 appear unbalanced by 75 dollars. Entry J1004 balances, so its missing account is a separate problem. None of these problems would stop a program from producing a total. All of them would make the total wrong.
Worked problem
Interpreting a profile
Maya's profile of a full year of Cedarbrook journal lines shows 1.84 million rows, 212 lines with no branch code, 3,406 lines dated in period 13, and 41 duplicate entry-and-line keys. What should she do with each finding?
Show solution
- Missing branch codes: check whether they belong to balance sheet accounts that are not tracked by branch; if so they are valid, and the profile rule should be refined.
- Period 13 lines: confirm with the controller that period 13 is the year-end adjustment period; if so, map it to December for monthly analysis and keep a flag so these entries can be examined separately.
- Duplicate keys: determine whether the duplicates are in the ERP itself or were created by the extraction, for example by an overlapping date range; re-extract if necessary.
- Record the findings and their resolution in a data preparation log.
Answer: Each finding needs an explanation before the data are used; some will turn out to be valid features of the system rather than errors.
Reconciling to control totals
Profiling finds problems inside the data. It cannot tell you whether records are missing altogether. For that you need an independent total to compare against. The standard practice is to reconcile an extract to control totals from the source system: the trial balance, a subledger total, a record count from the system, or a bank statement balance. If the extract does not reconcile, something is missing or duplicated, and any analysis of it will be wrong.
# Reconciling an extract to control totals from the ERP (invented data)
import pandas as pd
extract = pd.DataFrame({
    "account": ["1100", "1100", "4000", "4000", "4000", "5000", "5000"],
    "net":     [52_340.00, 18_115.50, -61_200.00, -9_455.50, 200.00,
                40_110.00, 6_950.00],
})                                    # debit positive, credit negative
tb = pd.DataFrame({                   # trial balance printed from the ERP
    "account": ["1100", "4000", "5000"],
    "tb_net":  [70_455.50, -70_455.50, 48_420.00],
})
by_acct = extract.groupby("account", as_index=False)["net"].sum()
rec = tb.merge(by_acct, on="account", how="outer").fillna(0)
rec["difference"] = (rec["net"] - rec["tb_net"]).round(2)
print(rec.to_string(index=False))
print("records:", len(extract),
" hash total of accounts:", extract["account"].astype(int).sum())account tb_net net difference 1100 70455.5 70455.5 0.0 4000 -70455.5 -70455.5 0.0 5000 48420.0 47060.0 -1360.0 records: 7 hash total of accounts: 24200
Two accounts agree exactly, but account 5000, cost of goods sold, is short by 1,360 dollars in the extract. The most likely causes are an extraction cut-off that missed entries posted late, a filter that excluded a source code, or entries in a period the query did not include. Maya should find the cause and re-extract rather than analyze data she knows to be incomplete. The program also prints a record count and a hash total, the sum of a field that has no meaning on its own, such as account numbers. If the source system reports the same count and hash total, the analyst has extra assurance that no records were lost or altered in transfer.
Reconciliation is so central that auditing standards build it into the use of company data. PCAOB AS 1105, Audit Evidence, and the AICPA's AU-C 500 require the auditor to evaluate whether information produced by the company is sufficiently reliable, including its accuracy and completeness. In practice, that means reconciling extracts to the general ledger and understanding how they were produced, which is exactly the habit this lesson recommends for every analysis.
Getting the data out
There are several ways to obtain data from an ERP, each with trade-offs. Standard reports are easy to run and familiar to users but are formatted for people, often include subtotals and page breaks, and may apply hidden filters. Ad hoc queries written by IT staff can return exactly the fields needed but depend on the query being correct. Direct read-only access to the database or a data warehouse gives the analyst full control but requires knowledge of the table structure and appropriate access rights. Application programming interfaces (APIs) let programs request data in a structured way and are common for cloud systems.
Whatever the method, the analyst should document what was requested, who ran the extraction, when, with what parameters, and what control totals were provided. This record, sometimes called the chain of custody, lets someone else repeat the extraction and lets a reviewer confirm the data were not altered. It is also the first line of the data preparation log that lesson 3 describes.
Common mistakes
MistakeOpening a CSV file in a spreadsheet and accepting the defaults.
InsteadImport with explicit types: codes as text, dates with a stated format.
MistakeAssuming an extract is complete because the program ran without errors.
InsteadReconcile record counts and totals to the source system or trial balance.
MistakeTreating every profile exception as an error.
InsteadInvestigate first; some exceptions, such as period 13 entries, are valid features of the system.
MistakeMixing header-level and line-level amounts in one calculation.
InsteadKeep track of granularity and aggregate to a common level before combining.
MistakeStarting analysis without a data dictionary.
InsteadObtain or write one, so the meaning, type and source of every field are clear.
Summary and key terms
- Accounting data come from ERP modules, surrounding applications, spreadsheets and unstructured documents.
- Master data are stable entities, transaction data are events, reference data are codes, and log data record system activity.
- Transaction data are stored in related header and line tables linked by keys; every journal entry must balance.
- File formats introduce errors such as lost leading zeros and misread dates; import with explicit types.
- Six common data quality dimensions are completeness, accuracy, validity, consistency, uniqueness and timeliness.
- Profiling finds problems within the data; reconciliation to control totals finds missing or extra records.
- Document how data were extracted so the work can be repeated and reviewed.
- Master data
- Relatively stable records of entities such as customers, vendors, items and accounts.
- Transaction data
- Records of business events, each with a date and amount.
- Primary key
- A field or combination of fields that uniquely identifies each row in a table.
- Foreign key
- A field in one table that refers to the primary key of another.
- Granularity
- The level of detail represented by each row of a data set.
- Data dictionary
- A description of each field's meaning, type, allowed values and source.
- Data profiling
- A systematic examination of a data set to understand its structure and quality.
- Control total
- An independent total, such as a record count or ledger balance, used to check completeness.
- Hash total
- A sum of a field with no meaning of its own, used to detect lost or altered records.
- Audit Data Standards
- Voluntary AICPA layouts for common accounting data extracts.
Practice problems
Work each problem on paper first, then reveal the answer to check.
Is a vendor's bank account number master data or transaction data?
Show answer
Master data.
Why is an error in master data often more serious than an error in one transaction?
Show answer
It affects every transaction that uses that master record.
An invoice header holds a freight charge of 50 and the invoice has four lines. What goes wrong if the header is joined to the lines and freight is summed?
Show answer
Freight is counted four times, giving 200 instead of 50.
Name the data quality dimension tested by checking that every account code exists in the chart of accounts.
Show answer
Validity.
In the profile program, why does J1005 appear unbalanced?
Show answer
Its line 2 appears twice, so its credits are double counted.
Remove the duplicated J1005 row in the program. What does the unbalanced list show?
Show answer
Nothing; every remaining entry balances.
In the reconciliation program, what is the difference for account 5000 and what might cause it?
Show answer
1,360 short; a cut-off, filter or period omitted from the extraction.
What is a hash total?
Show answer
The sum of a field with no meaning on its own, compared before and after transfer to detect lost or altered records.
Give one weakness of using a standard ERP report as a data source.
Show answer
Formatting, subtotals, page breaks or hidden filters.
What should a chain of custody record include?
Show answer
What was requested, who extracted it, when, with which parameters, and the control totals.
Lesson quiz · 5 questions
Score 60% or more to complete this lesson.
Create a free account to save your progress, take quizzes and earn a certificate.