
PHYS-430 · Lesson 5 of 12 · 21 min
Stellar spectra, classification and the Hertzsprung–Russell diagram
A star's spectrum is its fingerprint. Spread starlight into its wavelengths and you find a continuous rainbow crossed by dark lines, and from the shape of the continuum and the pattern of lines an astronomer can read the star's temperature, composition, surface gravity, rotation and motion toward or away from us. This lesson explains how, using the blackbody radiation of thermal physics and the atomic physics of modern physics. It then introduces the most important diagram in astronomy, the Hertzsprung–Russell diagram, which plots luminosity against temperature and turns out to sort stars by their stage of life.
Continuous spectra and effective temperature
A star's interior is opaque, and the light that escapes comes from a thin layer called the photosphere, where the gas becomes transparent. Because the photosphere is dense and nearly in thermal equilibrium, its continuous spectrum is close to that of a blackbody, the Planck spectrum you derived in thermal physics. Hotter stars are bluer, because Wien's law puts the peak of the spectrum at
and they emit far more power per unit area, \(\sigma T^4\) by the Stefan–Boltzmann law. A star is not an exact blackbody, so astronomers define its effective temperature \(T_\text{eff}\) as the temperature of a blackbody of the same radius that would emit the same total power: \(L = 4\pi R^2 \sigma T_\text{eff}^4\). The Sun's effective temperature is 5772 K. In practice the temperature is usually found from a colour index such as \(B - V\), the difference between the blue and visual magnitudes. A hot star is brighter in blue light, so its \(B\) magnitude is smaller and \(B - V\) is small or negative; Vega, at about 9600 K, has \(B - V \approx 0\) by construction of the scale, the Sun has \(B - V = 0.65\), and the cool red supergiant Betelgeuse has about 1.85.
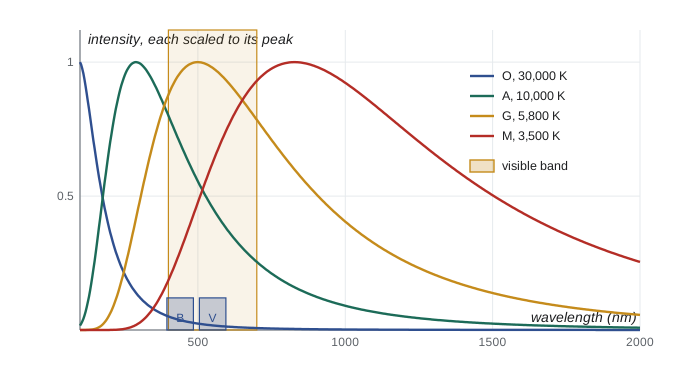
Total power over all wavelengths is the bolometric luminosity, and the corresponding magnitude is the bolometric magnitude. Since a V filter catches only part of the spectrum, astronomers add a bolometric correction, \(M_\text{bol} = M_V + BC\), that is near zero for stars like the Sun and large and negative for very hot and very cool stars, which put most of their light in the ultraviolet or infrared. The Sun has \(M_\text{bol} = 4.74\) by definition of the scale.
Absorption lines and Kirchhoff's laws
In 1859 and 1860 Gustav Kirchhoff and Robert Bunsen summarized what spectroscopy shows in three rules. A hot dense object produces a continuous spectrum. A hot thin gas produces bright emission lines at wavelengths characteristic of its atoms. A cooler thin gas in front of a continuous source produces dark absorption lines at those same wavelengths. Stellar spectra are of the third kind: the photosphere supplies the continuum, and the slightly cooler atmosphere above it absorbs at the wavelengths of its atoms and ions. Each line corresponds to a transition between two energy levels, so the line pattern identifies the element and its state of ionization. The hydrogen lines in the visible, the Balmer series, come from transitions with lower level \(n = 2\), as you saw for the hydrogen atom: \(\mathrm{H\alpha}\) at 656.3 nm, \(\mathrm{H\beta}\) at 486.1 nm and so on.
The spectral sequence
In the 1880s Edward Pickering began a huge photographic survey of stellar spectra at Harvard College Observatory, and the classification was carried out by a team of women astronomers, notably Williamina Fleming, Antonia Maury and Annie Jump Cannon. Spectra were first lettered A, B, C and so on by the strength of their hydrogen lines. Cannon, who personally classified about 350,000 stars, reordered and simplified the classes into the sequence O, B, A, F, G, K, M, published in 1901 and adopted internationally in 1922. Each class is divided into ten subclasses, 0 to 9, so the Sun is G2 and Vega A0. The order is not alphabetical because it was found to be a sequence of temperature, from about 40,000 K for O stars to about 3000 K for M stars. Classes L, T and Y have since been added for brown dwarfs, objects too small to sustain hydrogen fusion, with temperatures down to a few hundred kelvins.
Why should temperature, rather than composition, control which lines appear? The answer came from atomic physics in the 1920s. To absorb a Balmer photon, a hydrogen atom must already be in its first excited state, \(n = 2\), 10.2 eV above the ground state. In cool stars almost all hydrogen is in the ground state, so Balmer lines are weak. In very hot stars almost all hydrogen is ionized and has no electron to absorb anything. The Balmer lines are strongest in between, near 10,000 K, in the A stars. Two equations describe this. The Boltzmann equation gives the ratio of atoms in two energy levels, and the Saha equation, derived by Meghnad Saha in 1920, gives the ratio of ions to neutral atoms:
where \(g\) counts the states in each level, \(Z\) are the partition functions of the two ionization stages, \(n_e\) is the electron density and \(\chi\) the ionization energy, 13.6 eV for hydrogen. The program below combines them for a stellar atmosphere.
import math
k, h, me, eV = 1.380649e-23, 6.62607015e-34, 9.1093837e-31, 1.602176634e-19
Pe = 20.0                                # electron pressure in a typical photosphere, N/m^2
def frac_n2(T):
    """fraction of all hydrogen in the n = 2 level"""
    ne = Pe / (k * T)
    saha = (2 * 1 / (ne * 2)) * (2 * math.pi * me * k * T / h**2) ** 1.5 * math.exp(-13.6 * eV / (k * T))
    boltz = (8 / 2) * math.exp(-10.2 * eV / (k * T))       # g2 = 8, g1 = 2
    return boltz / (1 + boltz) / (1 + saha)
print("   T (K)   ionized fraction   fraction in n = 2")
for T in (4000, 6000, 8000, 9000, 10000, 12000, 15000, 20000, 30000):
    ne = Pe / (k * T)
    s = (1 / ne) * (2 * math.pi * me * k * T / h**2) ** 1.5 * math.exp(-13.6 * eV / (k * T))
    print(f"{T:8d}   {s / (1 + s):16.4f}   {frac_n2(T):17.2e}")
best = max(range(4000, 30001, 50), key=frac_n2)
print(f"Balmer absorption strongest near {best} K (spectral class A)") T (K) ionized fraction fraction in n = 2
4000 0.0000 5.63e-13
6000 0.0000 1.08e-08
8000 0.0252 1.46e-06
9000 0.2368 5.93e-06
10000 0.6999 8.68e-06
12000 0.9808 4.00e-06
15000 0.9992 1.21e-06
20000 1.0000 3.02e-07
30000 1.0000 5.32e-08
Balmer absorption strongest near 9850 K (spectral class A)Even at the peak only about one hydrogen atom in a hundred thousand is in the \(n = 2\) level, yet hydrogen is so abundant that the Balmer lines dominate the spectra of A stars. The calculation also shows how sharply ionization switches on, over a few thousand kelvins. Using exactly this reasoning, Cecilia Payne, in her 1925 doctoral thesis at Harvard, showed that the differences between stellar spectra are almost entirely due to temperature, not composition, and that stars are made overwhelmingly of hydrogen and helium. Her conclusion was so contrary to the belief of the time, that stars had roughly the Earth's composition, that she was persuaded to call it spurious; within a few years it was accepted. By mass the Sun is about 74 per hundred hydrogen, 25 helium, and just under 2 everything else, which astronomers call metals.
Luminosity classes and line widths
Two stars of the same temperature can have very different sizes, and the spectrum reveals this too. A giant star's atmosphere is far less dense than a dwarf's, so collisions are rarer and spectral lines are narrower, a pressure effect. In 1943 William Morgan, Philip Keenan and Edith Kellman at Yerkes Observatory added a luminosity class to the spectral type, written in Roman numerals: I for supergiants, III for giants, V for main-sequence dwarfs, with II and IV in between. The Sun is G2 V, Betelgeuse M1–2 Ia, Arcturus K1.5 III. The full MK class locates a star on the diagram below, and with it the star's luminosity, so it can serve as a distance indicator called spectroscopic parallax, although the method uses no parallax at all.
Line positions also carry motion. The Doppler shift \(\Delta\lambda/\lambda = v_r/c\), valid for speeds much less than \(c\), gives the radial velocity, the component of velocity along the line of sight. Modern spectrographs measure stellar radial velocities to better than a metre per second, the precision needed to detect Earth-like planets in lesson 11. Rotation broadens lines, because one side of the star approaches while the other recedes, and magnetic fields split them by the Zeeman effect, which is how magnetic fields on the Sun and other stars are measured.
The Hertzsprung–Russell diagram
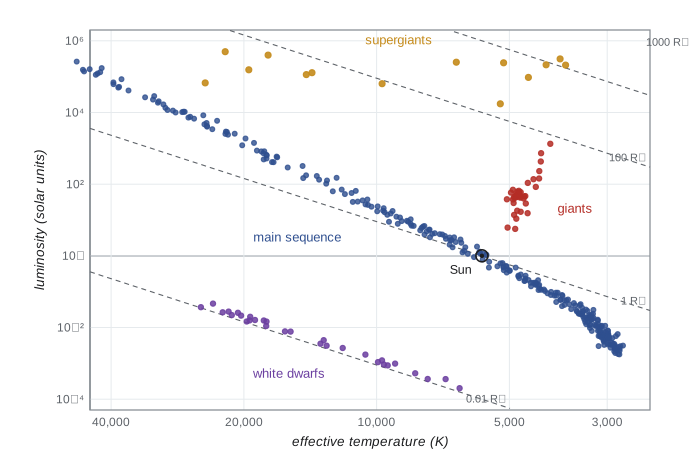
Around 1911 Ejnar Hertzsprung in Denmark plotted the brightness of stars in clusters against their colour, and in 1913 Henry Norris Russell in Princeton plotted absolute magnitude against spectral type for stars with known parallaxes. Both found that stars do not fill the diagram at random. The resulting Hertzsprung–Russell, or HR, diagram plots luminosity upward against temperature, by tradition with temperature increasing to the left. About nine stars in ten lie on a diagonal band from hot, luminous stars at upper left to cool, faint ones at lower right: the main sequence. A second group, the giants and supergiants, lies above it at cool temperatures, and a third, the white dwarfs, lies far below it at hot temperatures.
The Stefan–Boltzmann law explains the positions in terms of size. Since \(L = 4\pi R^2 \sigma T^4\), stars of the same radius lie on straight lines of slope 4 in a plot of \(\log L\) against \(\log T\), and moving up at fixed temperature means larger radius. Giants are cool yet luminous, so they must be huge; white dwarfs are hot yet faint, so they must be tiny. Lesson 7 shows that the main sequence is a sequence of mass, from about 0.08 solar masses at the bottom to more than 100 at the top, and lesson 8 shows that giants and white dwarfs are later stages in the lives of main-sequence stars.
import math
sigma, L_sun, R_sun, T_sun = 5.670374419e-8, 3.828e26, 6.957e8, 5772.0
def radius(L_Lsun, T):
    return math.sqrt(L_Lsun * L_sun / (4 * math.pi * sigma * T**4)) / R_sun
stars = [("Sun (G2 V)", 1.0, 5772), ("Sirius A (A1 V)", 25.4, 9940), ("Sirius B (white dwarf)", 0.025, 25000),
         ("Proxima Centauri (M5.5 V)", 0.00155, 3040), ("Arcturus (K1.5 III)", 170, 4290),
         ("Rigel (B8 Ia)", 120000, 12100), ("Betelgeuse (M1-2 Ia)", 100000, 3600)]
print(f"{'star':28s}{'L/L_sun':>10s}{'T (K)':>8s}{'R/R_sun':>10s}{'lambda_max (nm)':>17s}")
for name, L, T in stars:
    print(f"{name:28s}{L:10.4g}{T:8d}{radius(L, T):10.3g}{2.898e6 / T:17.0f}")
R_bet = radius(100000, 3600) * R_sun
print(f"Betelgeuse would reach {R_bet / 1.496e11:.1f} AU, beyond the orbit of Mars (1.52 AU)")
print(f"Sirius B: radius {radius(0.025, 25000) * R_sun / 1e3:,.0f} km, comparable to the Earth (6,371 km)")star L/L_sun T (K) R/R_sun lambda_max (nm) Sun (G2 V) 1 5772 1 502 Sirius A (A1 V) 25.4 9940 1.7 292 Sirius B (white dwarf) 0.025 25000 0.00843 116 Proxima Centauri (M5.5 V) 0.00155 3040 0.142 953 Arcturus (K1.5 III) 170 4290 23.6 676 Rigel (B8 Ia) 1.2e+05 12100 78.8 240 Betelgeuse (M1-2 Ia) 1e+05 3600 813 805 Betelgeuse would reach 3.8 AU, beyond the orbit of Mars (1.52 AU) Sirius B: radius 5,864 km, comparable to the Earth (6,371 km)
The radii span a factor of more than 100,000. Betelgeuse, if placed at the Sun, would swallow the orbits of Mercury, Venus, the Earth and Mars; Sirius B, the faint companion of Sirius, packs about a solar mass into a sphere the size of the Earth, a mean density about two million times that of water. Sirius B's existence was first inferred by Bessel in 1844 from the wobble of Sirius, and its spectrum, taken by Walter Adams in 1915, revealed its high temperature and therefore its tiny size, a puzzle that only quantum mechanics could solve, as lesson 8 explains.
Worked problem
The radius of a red giant
A red giant has an effective temperature of 4000 K and a luminosity of 300 \(L_\odot\). Find its radius in solar radii without using SI units.
Show solution
- Ratios cancel the constants: \(R/R_\odot = (L/L_\odot)^{1/2} (T_\odot/T)^2\).
- \((300)^{1/2} = 17.3\) and \((5772/4000)^2 = 2.08\).
- \(R = 17.3 \times 2.08 = 36\ R_\odot\).
Answer: About 36 solar radii, roughly a sixth of an astronomical unit. Working in solar units avoids large powers of ten and is how astronomers usually do such calculations.
Common mistakes
MistakeThinking the spectral sequence OBAFGKM is ordered by composition.
InsteadIt is a sequence of temperature; most stars have nearly the same composition, dominated by hydrogen and helium.
MistakeExpecting the hottest stars to show the strongest hydrogen lines.
InsteadHydrogen lines peak near 10,000 K; hotter stars ionize their hydrogen and the lines weaken.
MistakeReading temperature increasing to the right on an HR diagram.
InsteadBy tradition temperature increases to the left, with hot blue stars on the left.
MistakeAssuming a luminous star must be hot.
InsteadCool giants are luminous because they are enormous; luminosity depends on \(R^2 T^4\).
Summary and key terms
- Stellar continua are close to blackbodies; the effective temperature is defined by \(L = 4\pi R^2 \sigma T_\text{eff}^4\), and colour indices measure it.
- Absorption lines come from atoms in the cooler atmosphere and identify elements, ionization states and radial velocities.
- Cannon's sequence O B A F G K M runs from about 40,000 K to 3000 K; L, T and Y are brown dwarfs.
- The Saha and Boltzmann equations explain why line strengths depend on temperature; Payne showed stars are mostly hydrogen and helium.
- The HR diagram plots luminosity against temperature; most stars lie on the main sequence, with giants above and white dwarfs below.
- Lines of constant radius on the HR diagram follow from the Stefan–Boltzmann law.
- Effective temperature
- The temperature of a blackbody with the same radius and total power as the star.
- Colour index
- A difference of magnitudes in two filters, such as \(B - V\), measuring temperature.
- Spectral class
- A star's place in the sequence O B A F G K M, set by its temperature.
- Luminosity class
- Roman numeral I to V indicating a star's size, from supergiant to dwarf.
- Main sequence
- The band on the HR diagram where stars fuse hydrogen in their cores.
Practice problems
Work each problem on paper first, then reveal the answer to check.
At what wavelength does a 3000 K star's spectrum peak?
Show answer
\(2.898 \times 10^{-3}/3000 = 966\) nm, in the near infrared.
Two stars have the same radius; one is twice as hot. How do their luminosities compare?
Show answer
\(2^4 = 16\) times.
A line at rest wavelength 656.3 nm is observed at 656.5 nm. What is the radial velocity?
Show answer
\(v = c \times 0.2/656.3 = 91\) km/s, moving away.
Why do M stars show molecular bands while A stars do not?
Show answer
Molecules survive only at low temperatures; in hotter atmospheres they are broken apart by collisions.
A white dwarf has \(T = 10{,}000\) K and \(L = 0.001\ L_\odot\). Find its radius in solar radii.
Show answer
\(\sqrt{0.001} \times (5772/10000)^2 = 0.0316 \times 0.333 = 0.0105\ R_\odot\), about the size of the Earth.
Lesson quiz · 5 questions
Score 60% or more to complete this lesson.
Create a free account to save your progress, take quizzes and earn a certificate.