
NET-110 · Lesson 11 of 12 · 32 min
Network tools: ping, traceroute and packet capture
▶ Video coming soon A video version of this lesson is on the way.
When something breaks, guessing is slow and confident guessing is worse. A network technician's real advantage is a small set of tools that answer precise questions: does this host answer, which routers lie on the path, what address and settings does this device have, what does the DNS server actually say, which programs are listening on which ports, and what is really crossing the wire? Sam keeps a page of these commands taped inside the cabinet door, and by the end of this lesson you will be able to use and read every one.
This lesson covers ping and ICMP, traceroute and how it uses the TTL, the commands that show a host's own configuration, DNS lookup tools, connection and port listings, packet capture with Wireshark and tcpdump, and how to combine them into a methodical troubleshooting process. Terminal listings show the prompt as a greater-than sign; Windows and Unix versions of a command are given where they differ. Python examples parse the output of these tools, a common way to turn a one-off check into a routine report.
ICMP and ping
The Internet Control Message Protocol carries error reports and diagnostic messages for IP. Routers use it to say a destination is unreachable, that a packet's TTL ran out, or that a packet was too big for the next link. Ping uses two ICMP messages: it sends an echo request and waits for an echo reply, then reports whether a reply came back and how long the round trip took. Ping answers the most basic question in networking, whether two hosts can reach each other at layer 3, and the round-trip times and losses it reports give a first view of the path's health.
> ping -c 4 10.20.20.1
PING 10.20.20.1 (10.20.20.1) 56(84) bytes of data.
64 bytes from 10.20.20.1: icmp_seq=1 ttl=64 time=0.412 ms
64 bytes from 10.20.20.1: icmp_seq=2 ttl=64 time=0.388 ms
64 bytes from 10.20.20.1: icmp_seq=3 ttl=64 time=0.401 ms
64 bytes from 10.20.20.1: icmp_seq=4 ttl=64 time=0.395 ms

--- 10.20.20.1 ping statistics ---
4 packets transmitted, 4 received, 0% packet loss, time 3061ms
rtt min/avg/max/mdev = 0.388/0.399/0.412/0.009 ms
On Windows, ping sends four requests by default and uses -n to change the count; on Linux and macOS it runs until stopped with Ctrl+C unless -c gives a count. The TTL in each reply hints at the remote system and the distance: many systems start at 64 or 128, so a reply with TTL 116 has probably crossed twelve routers from a Windows host. Variation in round-trip times, called jitter, matters for voice and video even when the average looks fine.
A failed ping does not always mean a host is down. Many firewalls, including the Windows firewall by default on public networks, drop ICMP echo requests, so a host can be perfectly healthy and still not answer. The useful pattern is to ping in steps outward: the device's own loopback address 127.0.0.1, which tests its network software; its own IP address; its default gateway; an address beyond the gateway, such as a public DNS resolver; and finally a name, which adds DNS. The first step that fails shows where to look.
import re

output = """64 bytes from 10.20.20.1: icmp_seq=1 ttl=64 time=0.412 ms
64 bytes from 10.20.20.1: icmp_seq=2 ttl=64 time=0.388 ms
Request timeout for icmp_seq 3
64 bytes from 10.20.20.1: icmp_seq=4 ttl=64 time=3.901 ms
64 bytes from 10.20.20.1: icmp_seq=5 ttl=64 time=0.395 ms"""

times = [float(t) for t in re.findall(r'time=([0-9.]+) ms', output)]
sent = len(re.findall(r'icmp_seq[= ](\d+)', output))
lost = sent - len(times)
print('sent', sent, 'received', len(times), 'lost', lost)
print('min/avg/max ms:', min(times), round(sum(times) / len(times), 3), max(times))
print('jitter (max - min) ms:', round(max(times) - min(times), 3))sent 5 received 4 lost 1 min/avg/max ms: 0.388 1.274 3.901 jitter (max - min) ms: 3.513
Try it yourself
Summarize ping results
PING holds the output of a ping run in which each reply line contains time=<number> ms and each lost request has a line containing timeout. Write summarize(text) that returns a dictionary with keys sent (reply lines plus timeout lines), received, loss (the share lost, as a whole number out of 100, rounded) and avg (the average time of the replies, rounded to 2 decimal places, or None if nothing was received).
def summarize(text):
    lines = text.splitlines()
    return {'sent': len(lines), 'received': len(lines), 'loss': 0, 'avg': None}

print(summarize(PING))
Traceroute
Traceroute shows every router on the path to a destination. It works by sending packets with deliberately small TTL values: the first with TTL 1, which the first router decrements to zero, so it drops the packet and sends back an ICMP time exceeded message, revealing its address; then TTL 2, which reaches the second router; and so on until the destination itself replies. Each hop is usually probed three times, giving three round-trip times. Windows calls the command tracert and uses ICMP echo requests; Linux traceroute uses UDP by default and macOS can use either, and mtr and pathping combine traceroute with repeated pings to show loss at each hop over time.
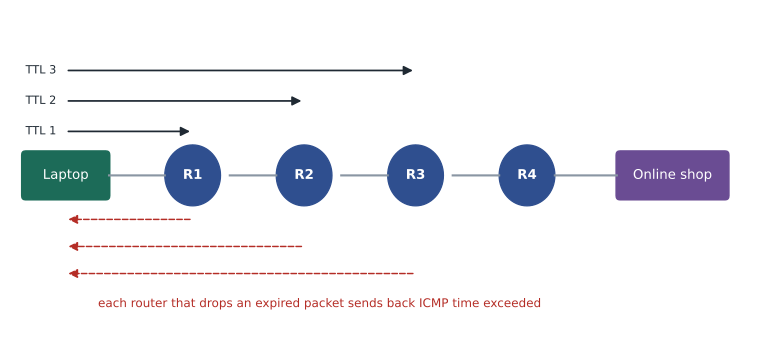
> traceroute shop.ridgelinecoffee.example
traceroute to shop.ridgelinecoffee.example (198.51.100.80), 30 hops max
 1  10.20.10.1      0.512 ms   0.431 ms   0.447 ms
 2  203.0.113.41    3.218 ms   3.104 ms   3.390 ms
 3  192.0.2.17      4.877 ms   5.012 ms   4.930 ms
 4  * * *
 5  198.51.100.1   19.442 ms  19.380 ms  19.610 ms
 6  198.51.100.80  20.118 ms  20.002 ms  20.341 ms
Reading a traceroute takes some care. Asterisks mean no reply came back for that probe, which is common: many routers rate-limit or ignore traceroute probes while still forwarding real traffic perfectly. A single silent hop in the middle of an otherwise normal trace, like hop 4 above, is not a problem. A trace that stops completely at some hop and never reaches the destination points to a real break at or after that hop. Latency that jumps at one hop and stays high for every hop after it shows a slow link at that point; a jump at one hop that disappears at the next usually just means that router is slow to answer probes, not slow at forwarding.
Try it yourself
Find where a trace stops
TRACE holds traceroute output: each line starts with a hop number, followed either by an address and three times, or by * * * when there was no reply. Write last_responding_hop(text) that returns a tuple (hop, address) for the last hop that replied, and jump(text, threshold) that returns the hop number of the first responding hop whose first time is more than threshold milliseconds greater than the first time of the previous responding hop, or None.
def last_responding_hop(text):
    last = text.strip().splitlines()[-1].split()
    return int(last[0]), last[1]

def jump(text, threshold):
    return None

print(last_responding_hop(TRACE), jump(TRACE, 20))
Checking a host's own configuration
Before blaming the network, check the device. Every operating system has a command that shows its interfaces, addresses, masks, gateways and DNS servers. On Windows it is ipconfig, with ipconfig /all for full details including the MAC address, DHCP server and lease times, ipconfig /release and /renew to get a fresh DHCP lease, and ipconfig /flushdns to clear the DNS cache. On Linux the modern commands are ip address and ip route, which replaced the older ifconfig and route; macOS still uses ifconfig alongside its own tools. The arp -a command, available everywhere, lists the IP-to-MAC mappings a host has learned, which is handy when two devices are fighting over one address.
> ip address show dev eth0
2: eth0: <BROADCAST,MULTICAST,UP,LOWER_UP> mtu 1500 state UP
    link/ether 3c:22:fb:10:00:21 brd ff:ff:ff:ff:ff:ff
    inet 10.20.20.21/24 brd 10.20.20.255 scope global dynamic eth0
    inet6 fe80::3e22:fbff:fe10:21/64 scope link
> ip route
default via 10.20.20.1 dev eth0
10.20.20.0/24 dev eth0 proto kernel scope link src 10.20.20.21import re
ipconfig = """Ethernet adapter Office:
Physical Address. . . . . . . . . : 9C-B6-D0-41-7E-10
DHCP Enabled. . . . . . . . . . . : Yes
IPv4 Address. . . . . . . . . . . : 10.20.10.37(Preferred)
Subnet Mask . . . . . . . . . . . : 255.255.255.0
Default Gateway . . . . . . . . . : 10.20.10.1
DHCP Server . . . . . . . . . . . : 10.20.10.1
DNS Servers . . . . . . . . . . . : 10.20.10.1"""
settings = {}
for line in ipconfig.splitlines():
match = re.match(r'\s+([A-Za-z0-9 ]+?)[ .]*: (.*)', line)
if match:
settings[match.group(1).strip()] = match.group(2).replace('(Preferred)', '')
for key in ('IPv4 Address', 'Subnet Mask', 'Default Gateway', 'DNS Servers'):
print(key.ljust(16), settings[key])IPv4 Address 10.20.10.37 Subnet Mask 255.255.255.0 Default Gateway 10.20.10.1 DNS Servers 10.20.10.1
DNS lookup tools
nslookup, available on every system, and dig, standard on Linux and macOS, query DNS servers directly. They show which server answered, what records came back and, with dig, the TTL of each record and how long the query took. Naming a server explicitly, as in nslookup shop.ridgelinecoffee.example 10.20.10.1 or dig @10.20.10.1 shop.ridgelinecoffee.example, tests that specific resolver, which is how you tell whether a problem lies in the device's settings, the local resolver or the authoritative record. Asking for a record type, such as dig MX ridgelinecoffee.example, checks mail and other records, and dig -x 198.51.100.80 does a reverse lookup.
> dig @10.20.10.1 shop.ridgelinecoffee.example A +noall +answer
shop.ridgelinecoffee.example. 287 IN A 198.51.100.80
> nslookup -type=MX ridgelinecoffee.example
Non-authoritative answer:
ridgelinecoffee.example  mail exchanger = 10 mail.provider.example.
The 287 in the dig answer is the remaining TTL in the resolver's cache, counting down from 300. A non-authoritative answer simply means it came from a resolver's cache rather than directly from the authoritative server, which is normal.
Connections and listening ports
netstat, available on every system, and ss, its faster replacement on Linux, list a host's network connections and the ports on which it is listening for new ones. Options such as -a for all, -n for numeric addresses and ports, -t and -u for TCP and UDP, and -p or -b to show the program responsible, answer questions like: is the web server actually running on port 443, which program is talking to that strange address, or why can nothing connect to this service? A port in the LISTEN state accepts connections; ESTABLISHED marks a live connection; TIME_WAIT marks one recently closed.
> ss -tln
State   Recv-Q  Send-Q  Local Address:Port   Peer Address:Port
LISTEN  0       128     0.0.0.0:22            0.0.0.0:*
LISTEN  0       511     0.0.0.0:443           0.0.0.0:*
LISTEN  0       50      127.0.0.1:5432        0.0.0.0:*
The database line is worth a second look: it listens on 127.0.0.1, the loopback address, so only programs on the same machine can reach it, which is exactly what you want for a database behind a web application. A service listening on 0.0.0.0, meaning every interface, can be reached from the network unless a firewall blocks it.
Try it yourself
Find exposed services
SS holds the output of ss -tln. Write listening(text) that returns a sorted list of (address, port) tuples, with ports as integers, for every LISTEN line. Then write exposed(text) that returns the sorted list of ports listening on any address other than the loopback addresses 127.0.0.1 and [::1], because those are reachable from the network.
In the ss output, the local address and port are in the fourth column, joined by the last colon.
def listening(text):
    return []

def exposed(text):
    return [p for a, p in listening(text)]

print(exposed(SS))
Packet capture
When the other tools cannot explain a problem, capturing the actual packets usually can. Wireshark, a free graphical analyzer, and tcpdump, its command-line counterpart, record every frame passing through an interface and decode each layer: Ethernet addresses, IP addresses and TTL, TCP flags and sequence numbers, and the application protocol inside, such as a DHCP exchange or a DNS query and its answer. Capture filters limit what is recorded, such as only traffic to port 53 or only one host's packets, and display filters in Wireshark narrow down what is shown, such as dns or tcp.flags.reset == 1. Captures are saved as pcap files that can be analyzed later or sent to a vendor.
> tcpdump -i eth0 -n port 67 or port 68
10:42:07.101 IP 0.0.0.0.68 > 255.255.255.255.67: BOOTP/DHCP, Request from 9c:b6:d0:41:7e:10, length 300
10:42:07.104 IP 10.20.10.1.67 > 10.20.10.163.68: BOOTP/DHCP, Reply, length 300
10:42:07.110 IP 0.0.0.0.68 > 255.255.255.255.67: BOOTP/DHCP, Request from 9c:b6:d0:41:7e:10, length 300
10:42:07.113 IP 10.20.10.1.67 > 10.20.10.163.68: BOOTP/DHCP, Reply, length 300
A switch sends each device only its own frames, so a laptop plugged into an ordinary switch port sees only its own traffic and broadcasts. To capture someone else's traffic, the switch must copy it to the capture port, a feature called port mirroring or SPAN, or a hardware tap must be placed in the cable. Packet capture also raises privacy and legal issues: captures can contain passwords, personal data and payment information, so capture only with permission, only what you need, and store and delete the files carefully. On Ridgeline's network, captures on the payments VLAN are forbidden by the payment security policy except by the payment provider's own technicians.
A troubleshooting method
Tools work best inside a method. The process taught for Network+ follows the same logic as any good diagnosis. Identify the problem: gather information, question users, identify symptoms, find out what changed, and reproduce it if possible. Establish a theory of probable cause, starting with the obvious and using the layers to organize the search. Test the theory to confirm it, and if it fails, form a new one or escalate. Establish a plan of action to fix it, considering side effects. Implement the solution or escalate. Verify that the whole system works, and put in place measures to prevent a repeat. Document the findings, actions and outcomes.
| Question | Tool | Example |
|---|---|---|
| What are this device's address, mask, gateway and DNS? | ipconfig /all, ip address, ip route | Spot a wrong mask or missing gateway |
| Can this device reach that address? | ping | Ping the gateway, then a public address |
| Where along the path does traffic stop or slow? | traceroute, tracert, mtr, pathping | Find the hop where the trace dies |
| What does DNS say about this name? | nslookup, dig | Query the local resolver and a public one |
| Is the service listening? Who is connected? | netstat, ss | Check that port 443 is in LISTEN |
| Which MAC address has this IP? | arp -a | Find a duplicate address |
| What is actually on the wire? | Wireshark, tcpdump | Watch a DHCP exchange or a failing handshake |
Worked problem
The roast controller loses its connection every afternoon
Kai reports that the roast controller's cloud dashboard goes offline for a few minutes most afternoons. Plan the investigation with the tools from this lesson.
Show solution
- Identify: ask when exactly it happens and what else happens then. Kai notices it coincides with the afternoon roast, when the large roaster's motor starts.
- Theory: electrical interference or a cable problem near the roaster (layer 1), or a DHCP lease problem (layer 3).
- Test: run a continuous ping from the office to the controller during the next roast. Replies stop when the motor starts and resume a minute later, and the switch log shows the controller's port going down and up.
- A link that drops when a big motor starts points to the cable: it runs alongside the motor's power cable. Plan: reroute the network cable away from the power cable, or replace it with shielded cable.
- Implement during closed hours, verify with a ping running through the next roast, and document the new cable route on the floor plan.
Answer: Continuous ping and the switch's port log tied the drops to the roaster motor; rerouting the cable away from the power line fixed a layer 1 interference problem.
Common mistakes
MistakeConcluding a host is down because it does not answer ping.
InsteadMany hosts block ICMP; test the actual service as well.
MistakeTreating asterisks in the middle of a traceroute as a fault.
InsteadRouters often ignore probes; only a trace that stops completely points to a break.
MistakeSkipping the device's own configuration.
InsteadCheck address, mask, gateway and DNS first with ipconfig or ip.
MistakeTesting DNS only through the device's default resolver.
InsteadQuery specific servers with nslookup or dig to locate the fault.
MistakeCapturing traffic without permission or on payment networks.
InsteadGet authorization, capture only what is needed and protect the files.
MistakeFixing a problem without documenting it.
InsteadRecord symptoms, cause, fix and verification for next time.
Summary and key terms
- ICMP carries IP error and diagnostic messages; ping uses echo request and reply to test reachability and round-trip time.
- Ping outward in steps: loopback, own address, gateway, remote address, then a name.
- Traceroute uses increasing TTL values to reveal each router; asterisks often mean a router ignores probes.
- ipconfig, ip address and ip route show a host's own settings; arp -a shows learned MAC addresses.
- nslookup and dig query DNS servers directly and show records and TTLs.
- netstat and ss list connections and listening ports; services on 127.0.0.1 are reachable only locally.
- Wireshark and tcpdump capture and decode packets; use them with permission and care.
- A structured method: identify, theorize, test, plan, implement, verify and document.
- ICMP
- Internet Control Message Protocol: carries IP error and diagnostic messages.
- Ping
- A tool that sends ICMP echo requests to test reachability and measure round-trip time.
- Round-trip time
- The time for a packet to reach a destination and the reply to return.
- Jitter
- Variation in delay between packets.
- Traceroute
- A tool that lists the routers on a path by sending packets with increasing TTL values.
- ipconfig
- The Windows command that shows and refreshes IP settings.
- dig
- A DNS lookup tool that queries servers and shows full answers.
- ss
- A Linux command that lists sockets: connections and listening ports.
- Packet capture
- Recording frames from a network interface for analysis.
- Port mirroring
- A switch feature that copies traffic from some ports to a capture port.
Practice problems
Work each problem on paper first, then reveal the answer to check.
Which ICMP messages does ping use?
Show answer
Echo request and echo reply.
A host does not answer ping, but its website loads. What is the likely explanation?
Show answer
Its firewall blocks ICMP echo requests.
What does traceroute rely on to discover each router?
Show answer
Routers send ICMP time exceeded when a packet's TTL reaches zero.
What does * * * at one hop in the middle of a trace usually mean?
Show answer
That router does not answer probes; traffic is still passing.
Which Windows command clears the DNS cache?
Show answer
ipconfig /flushdns.
Which Linux command shows the default gateway?
Show answer
ip route.
How do you query a specific DNS server with dig?
Show answer
dig @server name, for example dig @10.20.10.1 shop.ridgelinecoffee.example.
A database listens on 127.0.0.1:5432. Who can connect?
Show answer
Only programs on the same machine.
Why might a laptop on a switch port not capture other devices' traffic?
Show answer
The switch forwards only the laptop's own frames; port mirroring is needed.
What is the last step of the troubleshooting method?
Show answer
Document findings, actions and outcomes.
Lesson quiz · 5 questions
Score 60% or more to complete this lesson.
Create a free account to save your progress, take quizzes and earn a certificate.