
MSAZ-289 · Lesson 6 of 12 · 21 min
Review: monitoring and optimization
▶ Video coming soon A video version of this lesson is on the way.
Monitoring and optimization is Walt's strongest group: 11 of 14 on the diagnostic. It is also the largest group by number of bullets, and at 20 to 25 parts in 100 it carries as much weight as security. Elena's warning is that strength in a familiar area can make a candidate careless. Several of the questions Walt missed here were about features that did not exist when he learned tuning, such as intelligent query processing feedback and the retirement of database watcher, and about settings that differ between Azure SQL Database, Managed Instance and a VM. This review moves through the three parts of the group: monitoring activity, monitoring and tuning queries, and configuring for performance.
Baselines and metric sources
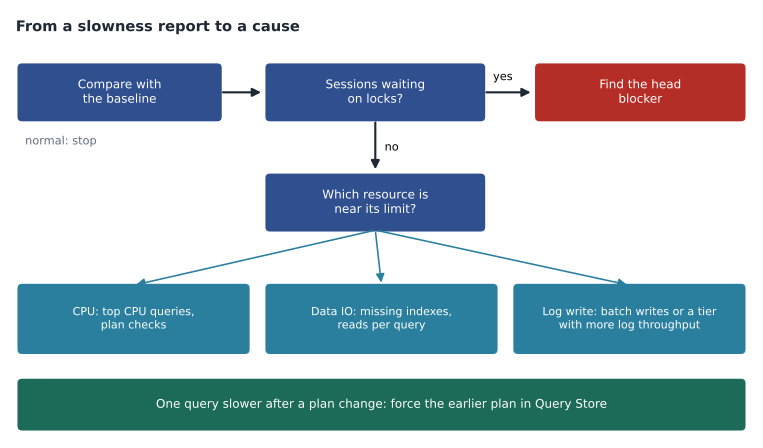
An operational performance baseline records how a workload normally behaves over a full business cycle: resource use by hour and day, the busiest queries, typical waits and response times. Questions often ask what to do first when users report slowness; the answer that involves comparing current numbers to a baseline is usually better than one that changes a setting straight away. Azure Monitor platform metrics, such as CPU, data IO and log write use as shares of their limits, are collected automatically and kept for 93 days; they drive charts and metric alerts. Diagnostic settings send resource logs, such as query statistics, waits, errors and deadlocks, to Log Analytics, a storage account or Event Hubs. Inside the engine, sys.dm_db_resource_stats shows resource use every 15 seconds for about an hour in Azure SQL Database, and the wider set of dynamic management views shows sessions, requests, waits and cached plans.
Interpreting metrics means knowing which limit a workload reaches. High CPU with SOS_SCHEDULER_YIELD waits means compute; high data IO with PAGEIOLATCH waits means reads from storage, often from missing indexes; log write near its limit with LOG_RATE_GOVERNOR waits means the log throughput of the tier; many sessions waiting on LCK_M waits means blocking, not a resource limit. The right fix follows: tune or scale compute, add indexes or memory, move to a tier with more log throughput, or find the head blocker.
Database watcher and Extended Events
The outline still lists monitoring by using database watcher, so candidates should know what it did: a managed service that used a remote collector to gather detailed monitoring data from Azure SQL databases, elastic pools and managed instances, stored it in Azure Data Explorer or Real-Time Analytics in Fabric and showed it in dashboards. Its current status matters too. It remained in preview and will not reach general availability; new watchers cannot be created after November 9, 2026, and collection ends April 30, 2027. Microsoft recommends Database Hub in Microsoft Fabric, itself in preview, as the successor. An exam question written before the retirement might still offer database watcher as the answer for detailed managed monitoring; the candidate should recognize what it does, while knowing that in real planning it is no longer the tool to adopt.
Extended Events capture individual events with chosen fields, such as statements that run longer than a threshold, deadlock graphs or errors, into targets like an event file in storage or a ring buffer in memory. In Azure SQL Database, sessions are database-scoped and event files go to Azure Blob storage. The built-in system_health session already records deadlocks and serious errors, which is often the fastest place to look after a deadlock is reported.
Query Store, blocking and DMVs
Query Store records each query's text, its plans over time and runtime statistics per plan, inside the database, so the history survives restarts and failovers. It is on by default in Azure SQL Database and Managed Instance. The settings that matter on the exam are operation mode (READ_WRITE, or READ_ONLY when it is full), capture mode (AUTO to skip trivial queries), maximum size, size-based cleanup and the stale query threshold. The Regressed Queries report shows queries that got slower compared with an earlier period, and forcing a known good plan is the quickest fix for a plan regression.
Blocking questions describe sessions waiting on locks and ask how to find or resolve the cause. sys.dm_exec_requests shows each request's blocking_session_id; following the chain to the session that is not itself blocked finds the head blocker, often an idle session with an open transaction. Killing it ends the incident; fixing the application's transaction handling prevents a repeat. Deadlocks are different: SQL Server detects the cycle and ends one session, the victim, with error 1205. Read committed snapshot isolation, on by default in Azure SQL Database, removes most reader-writer blocking.
| Question asks to find | Use |
|---|---|
| The head of a blocking chain | sys.dm_exec_requests blocking_session_id, sys.dm_exec_sessions |
| Top waits for a database | sys.dm_db_wait_stats (Azure SQL Database), sys.dm_os_wait_stats (MI, VM) |
| Expensive cached queries | sys.dm_exec_query_stats with sys.dm_exec_sql_text |
| Resource use in the last hour | sys.dm_db_resource_stats |
| Missing indexes the optimizer wanted | sys.dm_db_missing_index_details and related views |
| Unused indexes | sys.dm_db_index_usage_stats |
| A query that got slower after a plan change | Query Store Regressed Queries |
Indexes, query constructs and plans
Index questions ask which index helps a query, or which index to remove. A nonclustered index keyed on the filtered and joined columns, with the selected columns in INCLUDE, covers a query and avoids key lookups. A filtered index covers a common subset, such as open orders. Columnstore indexes suit analytic scans over many rows. Every index costs writes and storage, so unused indexes found with sys.dm_db_index_usage_stats are candidates for removal, after checking a full business cycle. Missing index suggestions are hints, not orders; they ignore existing indexes and can overlap.
Query construct questions show a slow query and ask for a rewrite. Functions on columns in WHERE clauses, such as CONVERT(date, SaleTime) = @d, prevent index seeks; the sargable form is a range on the bare column. Implicit conversions between varchar and nvarchar can do the same. SELECT * reads more than needed. Scalar user-defined functions called per row were a classic problem; scalar UDF inlining in recent compatibility levels removes some of the cost. Execution plan questions ask candidates to spot a scan where a seek was expected, a key lookup repeated thousands of times, a large gap between estimated and actual rows, or a warning such as a spill to tempdb.
Configuring for performance
Maintenance bullets cover index maintenance, statistics maintenance and integrity checks. Rebuilding or reorganizing indexes is needed far less often than old rules suggested; fragmentation matters little on SSD storage, and many teams rebuild only above high thresholds or not at all. Statistics matter more: auto-update statistics is on by default, and large tables may need scheduled updates with a bigger sample. DBCC CHECKDB checks integrity; on Azure SQL Database and Managed Instance Microsoft also runs its own checks, but the customer can run CHECKDB too and on VMs must schedule it.
Automatic tuning in Azure SQL Database offers FORCE_LAST_GOOD_PLAN, which is on for new servers, and CREATE_INDEX and DROP_INDEX, which are off; Managed Instance supports only FORCE_LAST_GOOD_PLAN. Changes are validated after they are applied and reverted if they make things worse. Server settings such as max degree of parallelism, cost threshold for parallelism and max server memory are set at the instance level on VMs and Managed Instance; in Azure SQL Database, MAXDOP is set with database-scoped configuration. Other database-scoped configurations include LEGACY_CARDINALITY_ESTIMATION and parameter sniffing options. Resource Governor, which divides CPU, memory and IO between workload groups, is available on Managed Instance and VMs, not in Azure SQL Database, where the service objective and elastic pool limits do that job.
Intelligent query processing is a set of features that improve plans without code changes, enabled by the database compatibility level: memory grant feedback, adaptive joins, batch mode on rowstore, degree of parallelism feedback, cardinality estimation feedback, parameter-sensitive plan optimization and approximate count distinct. Questions usually describe a symptom, such as memory spills that vary between runs or one query that is fast for some parameter values and slow for others, and ask which feature addresses it. Compute and storage scaling is the last bullet: scaling up the vCores, moving to a tier with more log throughput or local storage, or adding storage to raise IOPS on Managed Instance General Purpose.
A query worth recognizing
Some T-SQL appears in monitoring questions so often that a candidate should recognize it at a glance. The query below finds requests that are blocked and the sessions blocking them. In an exam, a hot area question might hide the column name blocking_session_id or the view name behind a drop-down list.
SELECT r.session_id, r.blocking_session_id, r.wait_type, r.wait_time,
       s.status, s.open_transaction_count, t.text AS running_sql
FROM sys.dm_exec_requests AS r
JOIN sys.dm_exec_sessions AS s ON r.session_id = s.session_id
CROSS APPLY sys.dm_exec_sql_text(r.sql_handle) AS t
WHERE r.blocking_session_id <> 0;
The blocker itself may not appear as a row, because an idle session has no current request. Its session_id appears only in the blocking_session_id column of the sessions it blocks. To see what it last ran, a DBA joins sys.dm_exec_connections to its most recent SQL handle, or checks sys.dm_exec_sessions for its open_transaction_count and last request time. That detail is exactly the kind of fact an exam question tests: a candidate who expects the blocker to show as a running request will look in the wrong place.
Where Walt lost marks
Walt's three misses in this group were instructive. The first offered database watcher, Extended Events and Query Store for capturing every deadlock graph over a week, and he chose Query Store, which does not record deadlocks; the system_health Extended Events session or a custom session with the xml_deadlock_report event does. The second asked for MAXDOP on an Azure SQL database, and he chose sp_configure, which is an instance setting not available there. The third asked which automatic tuning option a managed instance supports, and he chose CREATE_INDEX. Each miss was a fact about where a familiar feature lives in Azure, not a gap in tuning skill. Elena adds all three to his 'Why it was wrong' page and a fourth line of her own: when a question names the platform, check that the feature exists on that platform before judging anything else.
For the weeks before May, Elena sets him one monitoring task per clinic session in the sandbox: create an Extended Events session that writes to Blob storage, cause a deadlock on purpose between two query windows and read the graph, fill Query Store until it turns read-only, and force a plan and then unforce it. None of these takes more than twenty minutes, and each one turns a fact he might misremember into something he has seen happen.
Worked problem
Reading the symptom
A report query on SalesHistory is fast for small stores and very slow for the two largest stores. Query Store shows one plan, chosen when the query was first compiled for a small store, with an estimated 400 rows and an actual 2.1 million rows for the large stores. The database runs at compatibility level 160. What is the cause, and which feature can help without code changes?
Show solution
- One plan is used for all parameter values, compiled for a small store: a parameter-sensitivity problem.
- The estimate of 400 rows against 2.1 million actual rows shows the plan's assumptions fail for large stores.
- \[2{,}100{,}000 \div 400 = 5{,}250 \text{ times more rows than estimated}\]
- Parameter-sensitive plan optimization, part of intelligent query processing at compatibility level 160, can keep several plans for different parameter ranges.
- Forcing one plan in Query Store would not help, because no single plan suits both small and large stores.
Answer: The query suffers from parameter sensitivity. Parameter-sensitive plan optimization, available at compatibility level 160, lets the optimizer cache different plans for different parameter ranges; forcing one plan would not solve it.
Common mistakes
MistakeDatabase watcher is the recommended tool for new monitoring deployments.
InsteadIt will not reach general availability; no new watchers since November 9, 2026, with Database Hub in Fabric as the successor.
MistakeResource Governor is available in Azure SQL Database.
InsteadIt is available on Managed Instance and VMs; Azure SQL Database uses service objectives and elastic pool limits.
MistakeAutomatic tuning can create indexes on Managed Instance.
InsteadManaged Instance supports only FORCE_LAST_GOOD_PLAN.
MistakeIndex fragmentation should be fixed every night.
InsteadOn modern storage, statistics maintenance usually matters more; rebuild only when there is evidence.
MistakeLCK_M waits mean the server needs more CPU.
InsteadLock waits mean blocking; find the head blocker.
Summary and key terms
- Compare with a baseline first; read waits and limits to find which resource is the bottleneck.
- Azure Monitor metrics (93 days), resource logs, DMVs, Extended Events and Query Store are the data sources; database watcher is retiring in favour of Database Hub.
- Query Store finds plan regressions; DMVs find blockers, waits, expensive queries and index use.
- Covering, filtered and columnstore indexes and sargable rewrites fix most slow queries; read plans for scans, lookups and estimate gaps.
- Maintain statistics and integrity, use automatic tuning, database-scoped configuration and Resource Governor where available, and know which IQP feature fixes which symptom.
- Head blocker
- The session at the front of a blocking chain that holds locks others are waiting for.
- Sargable
- Written so that an index seek can be used, typically with no function applied to the filtered column.
- Covering index
- An index that contains every column a query needs, avoiding lookups to the base table.
- Database-scoped configuration
- Settings such as MAXDOP that apply to one database, used in Azure SQL Database instead of some server settings.
- Intelligent query processing
- A family of optimizer features that improve plans automatically at newer compatibility levels.
- Parameter-sensitive plan optimization
- An IQP feature that keeps several cached plans for one query across ranges of parameter values.
Practice problems
Work each problem on paper first, then reveal the answer to check.
Which wait type points to the log throughput limit of an Azure SQL tier?
Show answer
LOG_RATE_GOVERNOR.
Which automatic tuning option does Managed Instance support?
Show answer
FORCE_LAST_GOOD_PLAN only.
Where is MAXDOP set for Azure SQL Database?
Show answer
With database-scoped configuration.
What makes WHERE CONVERT(date, SaleTime) = @d non-sargable?
Show answer
The function on the column prevents an index seek; use a range on SaleTime instead.
Which built-in Extended Events session already records deadlocks?
Show answer
system_health.
Lesson quiz · 5 questions
Score 60% or more to complete this lesson.
Create a free account to save your progress, take quizzes and earn a certificate.