
MBA-513 · Lesson 6 of 12 · 20 min
Six Sigma and continuous improvement
Hana opens the sixth session with a number that has bothered her since MBA-501. About 8 per cent of the claims Lakeview submits for payment are rejected the first time, and each rejected claim must be researched, corrected and resubmitted, delaying the cash by an average of five weeks. Her billing team has tried reminders, retraining and a new form, and each time the rate dipped for a month and then crept back. Dr. Raman says that what Hana describes is a familiar pattern: well-meaning fixes applied without data, to symptoms rather than causes, and without a way to hold the gain. The structured method developed to break that pattern is called Six Sigma.
Where Six Sigma came from
Six Sigma was developed at Motorola in the mid-1980s, when an engineer named Bill Smith and his colleagues concluded that the company's defect rates, while acceptable by the standards of the time, were far higher than those of its Japanese competitors. Motorola set a goal of reducing variation so far that the nearest specification limit would lie six standard deviations from the process mean, and built a training and project system to get there. It won the first Malcolm Baldrige National Quality Award in 1988. The approach spread through AlliedSignal and, most visibly, General Electric, where Jack Welch made it a company-wide program in 1995 and tied managers' bonuses to it. By the 2000s, thousands of companies, hospitals and government agencies ran Six Sigma programs, often combined with lean methods as Lean Six Sigma.
The name comes from the statistics of lesson 4. A process whose nearest specification limit is six standard deviations away has a Cpk of 2. Motorola's engineers observed that over the long run, process means drift by about 1.5 standard deviations, so they conventionally assume that a six-sigma process in the short term behaves like a 4.5-sigma process in the long term. Under that assumption, six sigma corresponds to 3.4 defects per million opportunities. The 1.5-sigma shift is a convention rather than a law, and statisticians have criticized it, but it remains the basis of the published conversion tables, and Dr. Raman asks the cohort to treat the sigma level as a convenient scale rather than a precise description of any process.
Measuring defects
Six Sigma counts defects per opportunity, so that processes of different complexity can be compared. An opportunity is a chance for a defect that matters to the customer, a characteristic called critical to quality. A claim form might have six fields that can cause rejection; an order line at a warehouse has three opportunities, the right item, the right size and the right quantity. Defects per million opportunities, DPMO, is the number of defects divided by the number of units times opportunities per unit, multiplied by one million. The sigma level is then the number of standard deviations of a normal distribution that leaves that tail probability, plus the conventional 1.5. A process with 66,800 DPMO is at about three sigma; one with 6,210 DPMO is at four; 233 DPMO is five; and 3.4 DPMO is six.
| Sigma level | Defects per million opportunities | Yield |
|---|---|---|
| 2 | 308,500 | 69.1 per cent |
| 3 | 66,800 | 93.3 per cent |
| 4 | 6,210 | 99.38 per cent |
| 5 | 233 | 99.977 per cent |
| 6 | 3.4 | 99.99966 per cent |
DMAIC
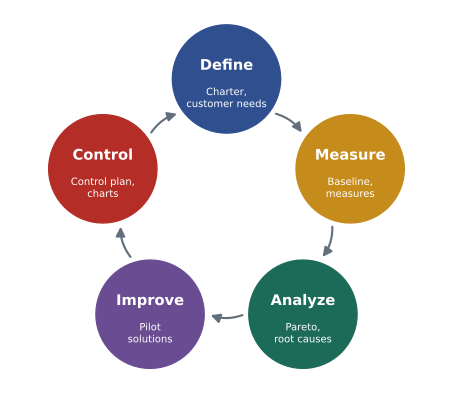
Six Sigma improvement projects follow five phases: define, measure, analyze, improve and control. In the define phase, the team writes a charter that states the problem, the customer and the critical-to-quality characteristics, the scope, the financial case and the people involved. A SIPOC diagram, listing the suppliers, inputs, process steps, outputs and customers at a high level, sets the boundaries. In the measure phase, the team establishes a baseline: how often the defect occurs, with what variation, measured how reliably. A measurement system analysis checks that the measurements are trustworthy, because a gauge whose error is large compared with the tolerance, or two clerks who classify the same claim differently, can make a capable process look poor or a poor one look capable.
In the analyze phase, the team looks for root causes. A Pareto chart ranks causes by frequency or cost and usually shows Juran's vital few. A cause-and-effect diagram, the fishbone diagram developed by Kaoru Ishikawa, organizes possible causes under headings such as people, methods, machines, materials, measurement and environment. Asking why five times, a practice from Toyota, pushes past the first plausible explanation. Hypotheses are then tested with data, by comparing groups, running regressions of the kind the cohort learned in MBA-504 or, where possible, designed experiments that vary several factors at once. In the improve phase, the team designs and pilots solutions to the root causes, using tools such as mistake-proofing and failure mode and effects analysis to anticipate how the new process could fail. In the control phase, it builds a control plan, with a control chart, standard procedures and a clear owner, so that the gain is held after the team disbands.
Hana's project
Hana's team defines the defect as a claim rejected on first submission and counts six opportunities per claim: patient identification, coverage details, referral or authorization information, procedure coding, diagnosis coding and provider details. In a baseline month, Lakeview submitted 9,400 claims and 752 were rejected, a rejection rate of 8.0 per cent. Some claims had more than one defect, for a total of 810 defects, so DPMO is 810 / (9,400 × 6) × 1,000,000, about 14,400, a sigma level of about 3.7. The team then classifies a month of rejections by cause.
Because Lakeview bills the provincial health insurance plan for physician services and uses the province's electronic claims system, the main causes are errors in health card numbers and version codes, missing referring physician numbers on specialist claims, incorrect fee codes and diagnostic codes, and claims for patients whose coverage has lapsed or who are insured in another province. The team's Pareto chart shows that missing or wrong referring physician numbers account for 38 per cent of rejections, health card and version code errors for 24 per cent, fee code errors for 17 per cent, out-of-province patients billed to the wrong plan for 11 per cent and other causes for 10 per cent.
The five whys take the largest cause back to its source. Why are referral numbers missing? Because registration clerks do not enter them. Why not? Because the referral letter is often not with the patient. Why not? Because referring offices fax the letter to a general number and it reaches the clinic only days later. Why? Because there is no shared way for referring offices to send it electronically. The fix is not more reminders to the clerks but a change to the system: an electronic referral intake that attaches the number to the appointment before the patient arrives, and a mandatory field in the registration screen that will not accept a blank, a poka-yoke. Together with a real-time eligibility check at registration, the pilot cuts rejections in two clinics from 8.0 to 3.1 per cent over six weeks. The control plan puts the weekly rejection rate on a p chart owned by the billing manager.
from statistics import NormalDist

def sigma_level(dpmo):
    return NormalDist().inv_cdf(1 - dpmo / 1e6) + 1.5

def dpmo(defects, units, opportunities):
    return defects / (units * opportunities) * 1e6

base = dpmo(810, 9400, 6)
print(f"Baseline: DPMO {base:,.0f}, sigma level {sigma_level(base):.2f}")
pilot = dpmo(320, 9400, 6)   # pilot defect rate applied to a full month
print(f"After pilot: DPMO {pilot:,.0f}, sigma level {sigma_level(pilot):.2f}")

# Pareto of rejection causes (share of rejections)
causes = {'Referral or authorization': 0.38, 'Identifier errors': 0.24, 'Coding': 0.17,
          'Eligibility': 0.11, 'Other': 0.10}
cum = 0
for name, share in sorted(causes.items(), key=lambda kv: -kv[1]):
    cum += share
    print(f"  {name:26} {share:4.0%}  cumulative {cum:4.0%}")

# Value of the improvement: rework cost and the cost of carrying delayed cash
rejected_before, rejected_after = 752, 9400 * 0.031
rework = 38          # dollars of staff time per rejected claim
value, delay = 610, 35 / 365   # average claim value, delay in years
rate = 0.06
saving = (rejected_before - rejected_after) * (rework + value * rate * delay)
print(f"Rejected claims a month: {rejected_before} -> {rejected_after:.0f}; annual saving about {saving * 12:,.0f} dollars")Baseline: DPMO 14,362, sigma level 3.69 After pilot: DPMO 5,674, sigma level 4.03 Referral or authorization 38% cumulative 38% Identifier errors 24% cumulative 62% Coding 17% cumulative 79% Eligibility 11% cumulative 90% Other 10% cumulative 100% Rejected claims a month: 752 -> 291; annual saving about 229,432 dollars
The output puts the project in financial terms. The baseline of about 14,400 DPMO is a 3.7-sigma process; the pilot's results would move it to about 4.0 sigma. The first two causes in the Pareto account for 62 per cent of rejections, and the first three for 79 per cent, so the team was right to focus there. The saving, counting the staff time spent reworking each rejected claim and the cost of waiting five weeks longer for the cash, comes to roughly 230,000 dollars a year for Lakeview, before counting the benefit to patients of fewer billing problems. Hana notes that the saving is modest compared with the cost of a black belt's year, but that the same tools can now be used on the next four problems.
Organizing for improvement
Six Sigma programs typically create a hierarchy of trained roles. Executive champions select projects and remove obstacles. Master black belts train and coach. Black belts lead projects full time for a year or two, and green belts, often front-line managers, lead smaller projects part time. Projects are chosen for their financial impact and tracked by finance, which gave Six Sigma credibility with executives and was one reason for its rapid spread. Lean and Six Sigma were often combined because they are complementary: lean removes waste and speeds flow, while Six Sigma reduces variation and defects. A process full of waiting needs lean first; a fast process with too many defects needs Six Sigma.
Continuous improvement does not always need formal projects. Toyota's kaizen relies on large numbers of small improvements suggested and made by the people who do the work, supported by managers who coach rather than direct. Kaizen events, also called rapid improvement events, bring a cross-functional team together for a few days to redesign one process, often with immediate changes on the floor. Daily huddles at a visual board, where a team reviews yesterday's results, problems and actions in ten minutes, keep improvement in the routine of the work. Dr. Raman's own plant had about four suggestions per worker per year, most of them small, and she says that the volume mattered more than the size of any one.
Criticisms and limits
Six Sigma has critics. Some programs became bureaucracies, with certification counts and project tallies that mattered more than results. Studies of firms that adopted it found mixed effects on performance, and several prominent adopters later scaled their programs back. The method is designed for repetitive processes with measurable defects; applied to research, design or creative work, its emphasis on reducing variation can discourage the experimentation that innovation requires. 3M, which adopted Six Sigma in 2001, was widely reported to have found that its new-product pipeline suffered when the methods were applied to research laboratories, and later loosened the program there. The lesson, Dr. Raman suggests, is to match the method to the work: use DMAIC for stable, repetitive processes where defects and variation are the problem, and use experimentation and design methods where the problem is discovering something new.
Worked problem
Picking accuracy at Cedarline's distribution centre
In a month, Cedarline's distribution centre shipped 214,000 online order lines. Customer complaints and audits found 1,820 lines with the wrong item, 1,350 with the wrong size and 420 with the wrong quantity. Each line has three opportunities for a defect. Compute DPMO and the sigma level, and suggest where to start.
Show solution
- Total defects = 1,820 + 1,350 + 420 = 3,590.
- DPMO = 3,590 / (214,000 × 3) × 1,000,000 ≈ 5,590.
- The sigma level is the inverse normal of 1 - 0.00559 plus 1.5: about 2.54 + 1.5 = 4.04.
- Wrong items and wrong sizes account for 88 per cent of defects. A five-whys analysis would probably point to the layout problems of lesson 3, with similar items slotted side by side and pickers working from paper lists, so barcode scanning at the pick face, which refuses a wrong item or size, is a natural mistake-proofing improvement.
Answer: At about four sigma, Cedarline ships roughly one wrong line in every sixty. Each wrong line costs a return, a replacement shipment and some customer goodwill, so scanning at the pick face is likely to pay for itself quickly.
Common mistakes
MistakeSix Sigma means a process with no defects.
InsteadIt refers to a target of 3.4 defects per million opportunities under a conventional 1.5 sigma shift, and is best treated as a scale.
MistakeImprovement starts with a solution.
InsteadDMAIC starts by defining the problem and measuring a baseline; solutions come after root causes are found.
MistakeThe first plausible cause is the root cause.
InsteadAsking why repeatedly and testing with data usually leads to a system cause behind the symptom.
MistakeA successful pilot means the problem is solved.
InsteadWithout a control plan, an owner and a chart, gains often decay once attention moves on.
Summary and key terms
- Six Sigma, developed at Motorola in the 1980s, aims to reduce variation so that defects are very rare.
- Defects per million opportunities and sigma levels compare processes of different complexity; six sigma corresponds to 3.4 DPMO under the 1.5 sigma convention.
- DMAIC projects move through define, measure, analyze, improve and control.
- Tools include SIPOC, measurement system analysis, Pareto charts, fishbone diagrams, five whys, designed experiments, FMEA and control plans.
- Lean speeds flow and removes waste; Six Sigma reduces variation and defects; kaizen engages everyone in small improvements.
- Six Sigma suits repetitive processes; applied to innovation, it can discourage useful experimentation.
- DPMO
- Defects per million opportunities.
- Critical to quality
- A characteristic that matters to the customer and is used to define a defect.
- DMAIC
- Define, measure, analyze, improve and control: the Six Sigma project method.
- Pareto chart
- A bar chart of causes ranked by frequency or cost, showing the vital few.
- Fishbone diagram
- Ishikawa's cause-and-effect diagram grouping possible causes under headings.
- Black belt
- A specialist who leads improvement projects full time.
- Kaizen
- Continuous improvement through many small changes by the people doing the work.
Practice problems
Work each problem on paper first, then reveal the answer to check.
A process produced 50,000 invoices with four opportunities each and 1,300 defects. What are DPMO and the approximate sigma level?
Show answer
DPMO = 1,300 / 200,000 × 10⁶ = 6,500, about 4.0 sigma.
A Pareto chart shows causes with shares of 41, 22, 15, 9, 7 and 6 per cent. Which causes make up about 80 per cent of the problem?
Show answer
The first three: 41 + 22 + 15 = 78 per cent.
Why does a measurement system analysis come before analysing causes?
Show answer
If the measurements are unreliable, apparent differences and improvements may be measurement error.
Give one reason Six Sigma might be inappropriate for a product design group.
Show answer
Its focus on reducing variation and on defined defects can discourage experimentation and risk-taking that innovation needs.
Lesson quiz · 5 questions
Score 60% or more to complete this lesson.
Create a free account to save your progress, take quizzes and earn a certificate.