
JS-250 · Lesson 3 of 12 · 26 min
Core Web Vitals
▶ Video coming soon A video version of this lesson is on the way.
On Tuesday, August 29, Mira brings the baseline table to the session and asks the obvious question: which of all these numbers should the studio actually aim at? Gareth's answer is the three metrics Google calls the Core Web Vitals. They are not the only things worth measuring, but they were chosen because each one describes something a visitor feels, they can be measured in real browsers on real visits, and the same three are used by Chrome, by PageSpeed Insights, by the Chrome UX Report and by Google Search. A team that improves them is improving the experience its visitors actually have.
| Metric | Question it answers | Good | Needs improvement | Poor |
|---|---|---|---|---|
| Largest Contentful Paint (LCP) | Has the main content appeared? | 2.5 s or less | Over 2.5 s, up to 4 s | Over 4 s |
| Interaction to Next Paint (INP) | Does the page respond quickly to taps, clicks and keys? | 200 ms or less | Over 200 ms, up to 500 ms | Over 500 ms |
| Cumulative Layout Shift (CLS) | Does the page stay still while it loads and as it is used? | 0.1 or less | Over 0.1, up to 0.25 | Over 0.25 |
A page passes the Core Web Vitals assessment when all three metrics are good at the 75th percentile of its visits, measured separately on phones and on desktop computers. The 75th percentile is a deliberate compromise. It is high enough that most visitors, including many on slow devices, get a good experience, but it does not let a few visits on terrible connections fail a page that is fine for almost everyone. Google has said it intends to keep the definitions and thresholds stable and to announce any change well in advance, and they have not changed since INP joined the set in 2024.
Largest Contentful Paint
Largest Contentful Paint is the time from the start of the navigation until the largest image or block of text in the visible part of the page has been drawn. It stands for the moment a visitor sees that the page has loaded its main content. The browser keeps a running candidate as the page loads: the first heading may be the largest element at first, then a big photo replaces it when it appears. The last candidate before the visitor first taps, scrolls or presses a key is the page's LCP.
- What can be the LCP element: images (including an image inside an SVG and a video's poster image), elements with a background image loaded from CSS, and blocks of text.
- What is ignored: elements outside the visible area, images that are essentially blank or very low in detail, and elements with no visible content.
- What it measures in the field: the real visitor's device, network and cache, so the same page can have a different LCP element on a phone and on a desktop.
On the Food Hub home page the LCP element is the first slideshow photo on both phones and desktops. On the recipe pages it is the recipe photo. On the volunteer portal's shift list it is the heading with the volunteer's name, because the list of shifts is text in a table made of many smaller blocks. Knowing which element is the LCP element is the first step in improving it, and Chrome's live metrics view in the Performance panel names it.
An LCP time is useful, but a breakdown is more useful, because it says which part of the load to fix. Google's guidance splits the time into four parts, each of which has its own causes and fixes.
| Part | From | To | Typical causes when it is long |
|---|---|---|---|
| Time to first byte | Navigation start | First byte of the HTML | Slow server, redirects, long connection setup |
| Resource load delay | First byte of the HTML | Start of the LCP image download | The image is discovered late or given low priority |
| Resource load duration | Start of the image download | End of the image download | The image is too big or the network is slow |
| Element render delay | End of the image download | The element painted | Render-blocking CSS or scripts, a long task, a hidden slide |
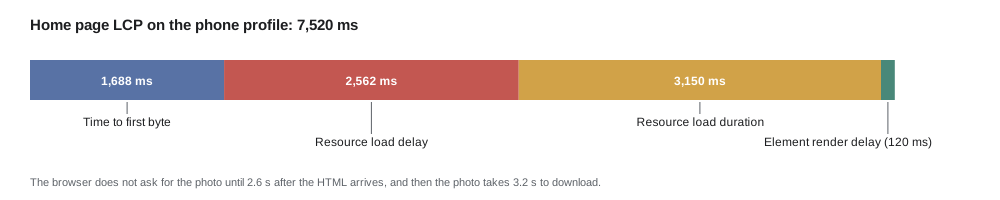
// Split an LCP time into its four parts (timestamps in ms from one phone-profile run).
const run = { ttfb: 1688, lcpRequestStart: 4250, lcpResponseEnd: 7400, lcpRenderTime: 7520 };

function lcpParts(r) {
  return {
    'time to first byte': r.ttfb,
    'resource load delay': r.lcpRequestStart - r.ttfb,
    'resource load duration': r.lcpResponseEnd - r.lcpRequestStart,
    'element render delay': r.lcpRenderTime - r.lcpResponseEnd,
  };
}

const parts = lcpParts(run);
for (const [name, ms] of Object.entries(parts)) {
  const share = ms / run.lcpRenderTime;
  console.log(`${name.padEnd(24)}${String(ms).padStart(6)} ms  ${'#'.repeat(Math.round(share * 40))}`);
}
console.log(`${'LCP'.padEnd(24)}${String(run.lcpRenderTime).padStart(6)} ms`);time to first byte 1688 ms ######### resource load delay 2562 ms ############## resource load duration 3150 ms ################# element render delay 120 ms # LCP 7520 ms
What this code does
The four parts are differences between timestamps that the browser already records: the first byte of the HTML, the start and end of the image's request, and the moment the element was painted. They always add up to the LCP time, and the row of hash marks shows each part's share of it. On the home page the two middle parts dominate, so the fixes are to start the photo download earlier and to make the photo smaller.
Gareth points out a pattern that Google's analysis of real sites has found too: on many slow pages, the image download itself is not the biggest problem. The resource load delay, the time the browser spends not yet knowing about the image, is often longer. The home page waits more than two and a half seconds after the HTML arrives before it even asks for the photo, because the slideshow script has to load first. Lesson 5 fixes that by putting the first photo in the HTML with a high fetch priority.
Interaction to Next Paint
Interaction to Next Paint measures responsiveness: how long a visitor waits, after a tap, click or key press, before the page visibly responds. For each interaction the browser measures the time from the input until the next frame is painted, which includes three parts. The input delay is the time before the page's event handlers can start, usually because the main thread is busy with something else. The processing time is how long the event handlers run. The presentation delay is the time the browser then needs to calculate styles and layout and paint the result.
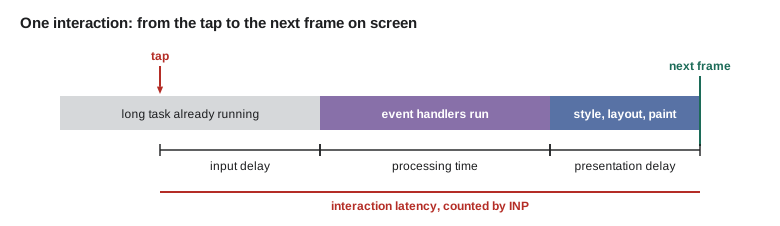
A page's INP is close to the slowest interaction on the visit. To stop a single unusual hiccup from defining a long session, the browser ignores the slowest interaction for every 50 interactions: on a visit with 120 interactions, the two slowest are set aside and the third slowest is the INP. Scrolling and hovering are not interactions for INP; taps, clicks and key presses are. A visit with no interactions at all has no INP.
// INP for one visit: ignore the slowest interaction for every 50 interactions.
function inp(latencies) {
  if (latencies.length === 0) return null;
  const sorted = [...latencies].sort((a, b) => b - a);
  const skip = Math.min(Math.floor(latencies.length / 50), sorted.length - 1);
  return sorted[skip];
}

const shortVisit = [80, 64, 312, 96, 120];
const longVisit = Array.from({ length: 120 }, (_, i) => 40 + (i * 37) % 150);
longVisit[17] = 980; longVisit[60] = 610;   // two hiccups

console.log('short visit:', inp(shortVisit), 'ms');
console.log('long visit: ', inp(longVisit), 'ms (from', longVisit.length, 'interactions)');
console.log('no taps: ', inp([]));short visit: 312 ms long visit: 189 ms (from 120 interactions) no taps: null
What this code does
The latencies are sorted from slowest to fastest, and the number to skip is one for every full 50 interactions, never so many that nothing is left. The short visit has fewer than 50 interactions, so its slowest, 312 ms, is its INP. On the long visit the two hiccups of 980 and 610 ms are skipped and the INP is the next slowest, 189 ms.
INP replaced an older metric, First Input Delay, as a Core Web Vital in March 2024. First Input Delay measured only the input delay of the first interaction, so a page could score well while every later tap felt sluggish. INP looks at every interaction and at all three parts of each one, which makes it much harder to pass by accident and much closer to what visitors feel. The volunteer portal is the studio's INP problem: its shift list runs a 1,180 ms task when a volunteer taps a day, which on a slow phone means a tap that does nothing visible for more than a second.
Cumulative Layout Shift
Cumulative Layout Shift measures visual stability. Whenever a visible element moves from where it was drawn in the previous frame without the visitor causing it, the browser records a layout shift with a score. The score multiplies two fractions: the impact fraction, the share of the viewport covered by the moving elements before and after they move, and the distance fraction, the largest distance any of them moved, as a share of the viewport's larger dimension.
Shifts that happen within 500 ms of a tap, click or key press are excluded, because a page that opens a menu when you tap the menu button is behaving as expected. What CLS punishes is the page that jumps on its own: an image without dimensions that pushes the text down when it arrives, a banner inserted above the content, or a web font that changes the size of every line.
Shifts are grouped into session windows. A window starts with a shift and keeps collecting shifts as long as each comes less than one second after the previous one, up to a maximum of five seconds for the whole window. The page's CLS is the total of the window with the largest total. This rule makes CLS fair to long-lived pages such as the volunteer portal: a few small shifts spread over an hour do not add up to a failing score, but a burst of shifts while the page loads does.
// CLS from a list of layout shifts: [time in ms, score, hadRecentInput].
const shifts = [
  [1950, 0.02, false], [2700, 0.11, false], [3100, 0.06, false],   // fonts swap, slideshow inserted
  [3150, 0.04, true],                                              // menu opened by a tap: ignored
  [7450, 0.12, false],                                             // photo arrives without a height
  [42000, 0.01, false],                                            // late shift much later
];

function cls(list) {
  let best = 0, current = 0, windowStart = -Infinity, last = -Infinity;
  for (const [t, score, input] of list) {
    if (input) continue;
    if (t - last >= 1000 || t - windowStart >= 5000) { current = 0; windowStart = t; }
    current += score;
    last = t;
    best = Math.max(best, current);
  }
  return Number(best.toFixed(4));
}

console.log('CLS:', cls(shifts));
console.log('CLS if every shift were simply added:', Number(shifts.filter((s) => !s[2]).reduce((a, s) => a + s[1], 0).toFixed(4)));CLS: 0.19 CLS if every shift were simply added: 0.32
What this code does
Shifts caused by recent input are skipped, and a new session window starts when a shift comes a second or more after the previous one or five seconds after the window began. The first three shifts arrive close together and form one window worth 0.19, which is larger than the 0.12 window for the late photo, so the CLS is 0.19. Simply adding every unexpected shift would give 0.32, which would unfairly punish a page for small shifts spread far apart.
The home page's CLS of 0.31 in the baseline comes almost entirely from the first few seconds: the fonts swapping in, the slideshow being inserted above the welcome text, and the first photo arriving without a reserved height. All three are fixable with well-known techniques that lessons 4 and 7 cover: giving images their dimensions, reserving space for content inserted later, and choosing fonts whose fallback takes up the same space.
Measuring the vitals in the field
Lab tools measure LCP and CLS directly and estimate INP through Total Blocking Time. Field measurement needs code in the page. The browser reports the entries behind each metric through PerformanceObserver: Largest Contentful Paint entries for LCP, Event Timing entries for INP and Layout Instability entries for CLS. LCP and INP became Baseline in December 2025, when Safari 26.2 added the last missing support, so all three major engines now report them. The details of collecting them correctly are fiddly: LCP must stop at the first input, CLS must be reported when the page is hidden rather than when it unloads, and INP must count interactions across the whole visit. Google's small web-vitals library does all of that and is what the studio will use.
import { onCLS, onINP, onLCP } from 'web-vitals';

function send(metric) {
  const body = JSON.stringify({
    name: metric.name,            // 'LCP', 'INP' or 'CLS'
    value: metric.value,          // ms for LCP and INP, a score for CLS
    rating: metric.rating,        // 'good', 'needs-improvement' or 'poor'
    id: metric.id,                // one id per page view, for de-duplication
    page: location.pathname,
  });
  // sendBeacon still works while the page is being hidden or closed.
  navigator.sendBeacon('/rum', body);
}

onLCP(send);
onINP(send);
onCLS(send);
What this code does
Each on function registers a callback that the library calls with the final value of a metric, usually when the visitor leaves or hides the page. sendBeacon queues the small report so that it is sent even if the page is closing, which is when CLS and INP are usually final. Lesson 11 builds the endpoint that receives these reports and turns them into percentiles.
Field data still has gaps worth knowing. At the time of writing, the Layout Instability interface behind CLS is available only in Chromium-based browsers, so CLS numbers from the studio's own collector describe Chrome, Edge and Samsung Internet visitors but not iPhone or Firefox users. Browsers can also differ slightly in exactly when they stop the clock for LCP. And the Chrome UX Report, which PageSpeed Insights shows, comes from Chrome users only. For the Food Hub, where many visitors use iPhones, the field numbers describe much but not all of the audience, so the lab tests on a slow profile remain important.
Turning visits into an assessment
Mira's last task in the session is to turn a set of field values into the pass or fail that PageSpeed Insights shows. Each metric is rated at its 75th percentile, and the page passes only if all three are good.
const THRESHOLDS = { LCP: [2500, 4000], INP: [200, 500], CLS: [0.1, 0.25] };

function rate(name, value) {
  const [good, poor] = THRESHOLDS[name];
  return value <= good ? 'good' : value <= poor ? 'needs improvement' : 'poor';
}

function p75(values) {
  const s = [...values].sort((a, b) => a - b);
  return s[Math.ceil(0.75 * s.length) - 1];
}

// A small set of field values for the home page on phones.
const field = {
  LCP: [2100, 3900, 4400, 2600, 5100, 3300, 4800, 2900],
  INP: [96, 180, 240, 150, 310, 120, 200, 168],
  CLS: [0.05, 0.31, 0.22, 0.12, 0.08, 0.27, 0.18, 0.02],
};

let passes = true;
for (const [name, values] of Object.entries(field)) {
  const v = p75(values);
  const r = rate(name, v);
  if (r !== 'good') passes = false;
  console.log(`${name}  p75 ${String(v).padStart(5)}  ${r}`);
}
console.log('assessment:', passes ? 'passed' : 'failed');LCP p75 4400 poor INP p75 200 good CLS p75 0.22 needs improvement assessment: failed
What this code does
Each metric's values are sorted and the 75th percentile is taken with the nearest-rank method, then rated against the two thresholds. A value equal to a threshold counts as the better rating, as Google's definitions say. One metric that is not good is enough to fail the assessment, and the home page fails on LCP and CLS even though its INP is just good.
Worked problem
A layout shift score
On a phone with a viewport 412 CSS pixels wide and 823 tall, the welcome text block is 412 wide and 300 tall. When the slideshow is inserted above it, the block moves down by 206 pixels. What is the layout shift score?
Show solution
- Before the move the block covers rows 0 to 300; after it, rows 206 to 506. Together they cover rows 0 to 506 across the full width.
- Impact fraction = (412 × 506) ÷ (412 × 823) = 506 ÷ 823 ≈ 0.615.
- The larger viewport dimension is the height, 823 pixels, so the distance fraction = 206 ÷ 823 ≈ 0.250.
- Score = 0.615 × 0.250 ≈ 0.154.
Answer: The single shift scores about 0.15, already over the 0.1 good threshold by itself.
Common mistakes
MistakeJudging the Core Web Vitals by the average visit.
InsteadUse the 75th percentile, separately for phones and desktops.
MistakeOptimizing the wrong element for LCP.
InsteadFind the actual LCP element in the Performance panel or with the web-vitals attribution build first.
MistakeFixing only the image download when LCP is slow.
InsteadCheck all four parts; the resource load delay is often the biggest.
MistakeAssuming a good Total Blocking Time means a good INP.
InsteadMeasure INP in the field; slow interactions after load, such as the portal's day tap, do not show in TBT.
MistakeCounting every layout shift.
InsteadRemember that shifts within 500 ms of input are excluded and that CLS is the worst session window, not the total.
Summary and key terms
- The Core Web Vitals are LCP (main content shown, good at 2.5 s or less), INP (responses to taps, clicks and keys, good at 200 ms or less) and CLS (visual stability, good at 0.1 or less).
- A page passes when all three are good at the 75th percentile, for phones and desktops separately.
- LCP is the last largest image or text block before the first input and splits into time to first byte, resource load delay, resource load duration and element render delay.
- INP is close to a visit's slowest interaction, ignoring one for every 50, and each interaction has an input delay, processing time and presentation delay.
- INP replaced First Input Delay in March 2024.
- CLS is the largest session window of unexpected layout shifts, each scored as impact fraction times distance fraction.
- The web-vitals library collects the three metrics in the field.
- Core Web Vitals
- Three user-centred metrics, LCP, INP and CLS, with thresholds for good, needs improvement and poor.
- Largest Contentful Paint (LCP)
- The time until the largest image or text block in the viewport has been painted.
- Resource load delay
- The time between the HTML's first byte and the start of the LCP image's download.
- Interaction to Next Paint (INP)
- A measure of responsiveness close to the slowest tap, click or key press on a visit.
- Input delay
- The time between an input and the moment its event handlers can start running.
- Cumulative Layout Shift (CLS)
- The largest burst of unexpected layout shift scores during a visit.
- Session window
- A group of layout shifts each less than 1 s apart, lasting at most 5 s in total.
- web-vitals
- Google's small JavaScript library that measures the Core Web Vitals in real browsers.
Practice problems
Work each problem on paper first, then reveal the answer to check.
Why is the 75th percentile used for the Core Web Vitals assessment?
Show answer
It ensures most visits are good, including many slow ones, without letting a few very bad connections decide the result.
A visit has 75 interactions. How many of the slowest are ignored when choosing its INP?
Show answer
One, because one is ignored for every full 50 interactions.
Which LCP part is long when the browser finds the image only after a script runs?
Show answer
The resource load delay.
Why is a menu that slides open after a tap not counted in CLS?
Show answer
Shifts within 500 ms of a tap, click or key press are excluded as expected movement.
Try it yourself
Session windows
Complete sessionWindows(shifts) so that it returns the total of each session window, in order. Each shift is [timeMs, score]. A new window starts when a shift comes 1,000 ms or more after the previous shift, or 5,000 ms or more after the current window started.
Round each total to two decimal places with Number(x.toFixed(2)).
function sessionWindows(shifts) {
  return [];
}

const shifts = [[500, 0.05], [900, 0.04], [1200, 0.1], [3000, 0.02], [3500, 0.03], [4200, 0.01], [8100, 0.2]];
const windows = sessionWindows(shifts);
console.log(JSON.stringify(windows));
console.log('CLS:', windows.length ? Math.max(...windows) : 0);
Try it yourself
Pass or fail
Complete assess(p75s) so that it returns 'passed' only if LCP is at most 2,500 ms, INP at most 200 ms and CLS at most 0.1. Otherwise return 'failed' followed by the names of the metrics that are not good, for example 'failed: LCP, CLS'.
The metrics must be listed in the order LCP, INP, CLS.
function assess(p75s) {
  return 'passed';
}

console.log(assess({ LCP: 2400, INP: 180, CLS: 0.05 }));
console.log(assess({ LCP: 4400, INP: 200, CLS: 0.27 }));
console.log(assess({ LCP: 2500, INP: 240, CLS: 0.1 }));
Lesson quiz · 5 questions
Score 60% or more to complete this lesson.
Create a free account to save your progress, take quizzes and earn a certificate.