
ITIL-120 · Lesson 11 of 12 · 30 min
Continual improvement and measurement
The guiding principles and governance give direction, but organizations also need a repeatable way to get better over time. ITIL provides one: the continual improvement model, a structured sequence of questions that takes any improvement from vision to lasting change. This lesson explains the model step by step, introduces the continual improvement register for capturing and prioritizing ideas, and shows how to measure improvement with baselines, targets, critical success factors and key performance indicators. Worked examples cover baseline-to-target arithmetic and two measures that matter to almost every IT organization: change success rate and mean time to restore service.
Continual improvement in ITIL
Continual improvement is a recurring organizational activity performed at all levels to ensure that an organization's performance continually meets stakeholders' expectations. ITIL treats it in three ways: as a component of the service value system (covered in ITIL-130), as a general management practice, and through the continual improvement model described here. Improvement is everyone's responsibility, though many organizations also have a small team that coordinates it, supports others and maintains the register.
The continual improvement model in this lesson comes from ITIL 4, where it is described in detail. ITIL (Version 5) keeps continual improvement central and keeps the seven guiding principles unchanged; check your exam syllabus for the exact way your edition presents the model.
The seven steps of the model
The model is a sequence of seven questions. It can be applied to a small improvement, such as a change to one knowledge article, or to a major organizational transformation.
- What is the vision? Understand the organization's vision and objectives, and how this improvement supports them.
- Where are we now? Assess the current state objectively, with a measured baseline (lesson 3).
- Where do we want to be? Define the target state with measurable objectives, based on the gap between vision and current state.
- How do we get there? Plan the improvement, often as a series of iterations.
- Take action: carry out the plan, measuring progress and managing risks along the way.
- Did we get there? Check whether the objectives were achieved and the expected value realized.
- How do we keep the momentum going? Embed the change, communicate success and identify the next improvement.
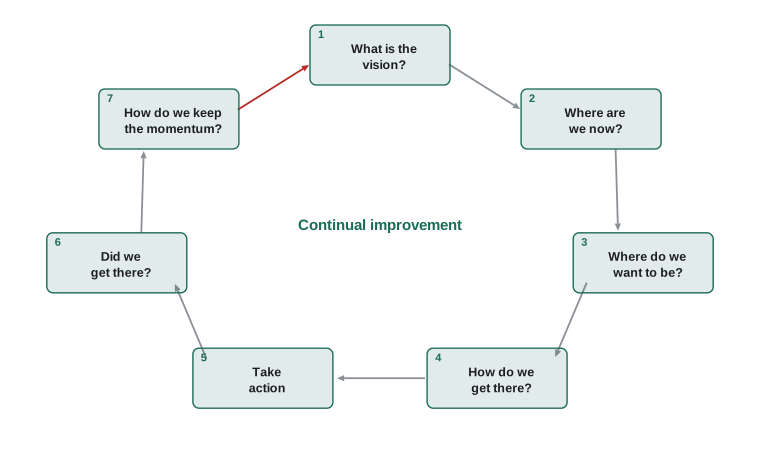
Observe how the steps reflect the guiding principles. "Where are we now?" is start where you are. "How do we get there?" and "Take action" usually progress iteratively with feedback. "Did we get there?" provides the feedback. The whole model starts from the vision, which is focus on value at the organizational level.
The continual improvement register
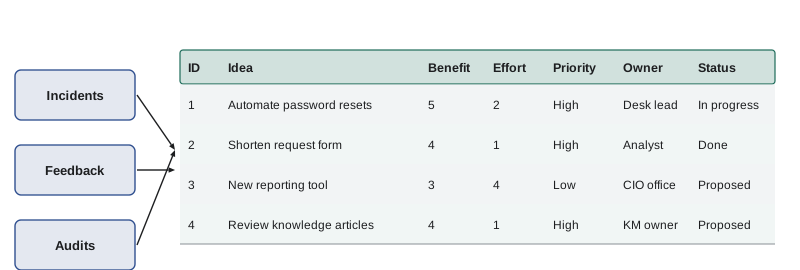
Improvement ideas come from everywhere: incident reviews, customer complaints, staff suggestions, audits, supplier meetings and monitoring data. Without a place to record them, good ideas are lost and effort is spread across too many initiatives. The continual improvement register (CIR) is a database or structured document that tracks and manages improvement ideas from identification to final action.
A typical register entry records the idea, who raised it, the date, the expected benefit, the estimated effort, its priority, the owner, its status and the result once complete. Organizations may keep several registers at different levels (for a team, a value stream or the whole organization), linked so ideas can move to the right level.
Worked problem
Prioritizing register entries
A register holds five ideas, each scored 1–5 for benefit and effort: (1) self-service password reset, benefit 5, effort 2; (2) new reporting tool, benefit 3, effort 4; (3) knowledge article review, benefit 4, effort 1; (4) supplier contract renegotiation, benefit 4, effort 4; (5) change calendar automation, benefit 3, effort 2. Rank them by benefit divided by effort.
Show solution
- Ratios: (1) 5 ÷ 2 = 2.5; (2) 3 ÷ 4 = 0.75; (3) 4 ÷ 1 = 4.0; (4) 4 ÷ 4 = 1.0; (5) 3 ÷ 2 = 1.5.
- Rank: knowledge article review (4.0), self-service password reset (2.5), change calendar automation (1.5), supplier renegotiation (1.0), new reporting tool (0.75).
- The ranking guides, but does not replace, judgment: the supplier renegotiation may be time-critical if the contract expires soon.
Answer: Order: knowledge article review, password reset, change calendar automation, supplier renegotiation, reporting tool, adjusted for any deadlines.
Baselines and targets
"Where are we now?" and "Where do we want to be?" both need numbers. A baseline is the measured starting point; a target is the measured goal. The gap between them defines the improvement, and progress can be expressed as the share of the gap closed.
The share of the gap closed is \( \dfrac{\text{baseline} - \text{current}}{\text{baseline} - \text{target}} \times 100\% \) for measures where lower is better, such as resolution time.
Worked problem
Baseline-to-target arithmetic
The baseline first-contact resolution rate is 58 %. The target in 12 months is 72 %. After 6 months it is 66 %. What share of the gap has been closed, and what monthly improvement is needed to reach the target on time?
Show solution
- Total gap: 72 − 58 = 14 percentage points.
- Closed so far: 66 − 58 = 8 points, so 8 ÷ 14 ≈ 57 % of the gap in half the time.
- Remaining: 72 − 66 = 6 points over 6 months, or 1 point a month.
- The first six months averaged 8 ÷ 6 ≈ 1.33 points a month, so the required pace is slower than achieved so far, but later gains are often harder.
Answer: About 57 % of the gap is closed; 1 percentage point a month is needed to reach 72 % on time, slightly below the pace so far.
Targets should be realistic and linked to value. A target set without a baseline is a guess, and a target that cannot be influenced by the people responsible for it is a source of frustration rather than improvement.
Critical success factors and key performance indicators
Measurement in ITIL is often structured around critical success factors (CSFs) and key performance indicators (KPIs). A CSF is a necessary precondition for achieving intended results: something that must go well. A KPI is an important metric used to evaluate success in meeting an objective. Each CSF is usually supported by a small number of KPIs.
| Objective | Critical success factor | Key performance indicators |
|---|---|---|
| Reliable services | Changes are implemented without causing incidents | Change success rate; incidents caused by changes |
| Fast recovery | Service is restored quickly after failure | Mean time to restore service; share restored within target |
| Satisfied users | Support resolves issues effectively | First-contact resolution; user satisfaction score |
| Efficient support | Repetitive work is minimized | Share of requests via self-service; cost per contact |
Good KPIs are relevant to the objective, measurable from reliable data, understandable by the people who use them, and few in number. Organizations that track dozens of KPIs often learn little from any of them.
Change success rate
Change success rate is the share of changes implemented without causing an incident, needing remediation or being rolled back. It is one of four key measures used in DevOps research, alongside deployment frequency, lead time for changes and time to restore service. Its complement, the change failure rate, is often reported instead.
Worked problem
Improving change success rate
In a quarter, a team implements 420 changes, of which 46 cause incidents or are rolled back. After introducing automated testing and peer review, the next quarter has 510 changes with 28 failures. Calculate the change success rate for each quarter and the change in failed changes.
Show solution
- Quarter 1 success rate: (420 − 46) ÷ 420 = 374 ÷ 420 ≈ 89.0 %.
- Quarter 2 success rate: (510 − 28) ÷ 510 = 482 ÷ 510 ≈ 94.5 %.
- Failure rate fell from about 11.0 % to about 5.5 %, roughly halving.
- Despite 90 more changes, there were 18 fewer failures, showing that speed and stability improved together.
Answer: Change success rate rose from about 89.0 % to about 94.5 %, with 18 fewer failures despite 21 % more changes.
Mean time to restore service
Mean time to restore service (MTTR, sometimes called mean time to recover) is the average time from the start of a service interruption to its restoration. It reflects how well detection, diagnosis and recovery work together, which makes it a holistic measure (lesson 6). Because averages can hide outliers, many organizations also report the share of incidents restored within a target time.
Worked problem
Measuring an MTTR improvement
Before improvements, 30 major incidents in six months had a total restoration time of 75 hours. After adding automated diagnostics and swarming, the next six months had 26 major incidents with a total restoration time of 39 hours. If each hour of major outage costs $12,000, what is the MTTR before and after, and the outage cost saved?
Show solution
- MTTR before: 75 ÷ 30 = 2.5 hours. MTTR after: 39 ÷ 26 = 1.5 hours.
- MTTR improved by 1.0 hour, or 40 %.
- Outage hours fell from 75 to 39, a reduction of 36 hours.
- Cost saved: 36 × $12,000 = $432,000 over six months.
Answer: MTTR fell from 2.5 to 1.5 hours (40 %), and outage costs fell by about $432,000 over six months, helped by fewer incidents as well as faster recovery.
Did we get there, and keeping momentum
The sixth step checks results honestly. If the target was not reached, the organization asks why and decides whether to continue, adjust or stop. Partial success is common and still valuable. The seventh step, keeping momentum, is often neglected. Improvements fade if new ways of working are not embedded through training, documentation, updated measures and recognition. Communicating results, including what did not work, builds support for the next improvement and feeds the register with new ideas.
Running an improvement review
Many organizations hold a regular improvement review, monthly or quarterly, to keep the model and the register alive. A typical agenda covers five items: new ideas added to the register since the last review and their initial scores; progress on improvements in progress against their targets; results of completed improvements, including those that did not succeed; changes to priorities in the light of new objectives or risks; and decisions on which ideas to start next, given the capacity available.
Keeping the review short and focused on decisions matters more than its format. A review that only lists activity soon becomes a ritual. A review that decides what to start, continue, adjust or stop, and records why, keeps improvement connected to value and gives the governing body confidence that improvement effort is well directed.
Key point to remember
Improvement without measurement is guesswork, and measurement without improvement is bookkeeping. The model, the register and a small set of well-chosen measures together turn good intentions into demonstrable progress.
Common mistakes
MistakeStarting improvement without a measured baseline.
InsteadMeasure the current state first so progress can be shown.
MistakeLeaving improvement ideas in emails and meeting notes.
InsteadRecord them in a continual improvement register with owners and priorities.
MistakeTracking dozens of KPIs.
InsteadChoose a few KPIs linked to critical success factors.
MistakeReporting only the average restoration time.
InsteadReport MTTR alongside the share of incidents restored within target to reveal outliers.
MistakeStopping once the target is reached.
InsteadEmbed the change and keep momentum by identifying the next improvement.
Summary and key terms
- Continual improvement is a recurring activity at all levels, and everyone's responsibility.
- The model asks seven questions, from "What is the vision?" to "How do we keep the momentum going?"
- The model reflects the guiding principles, especially start where you are and progress iteratively.
- The continual improvement register captures, prioritizes and tracks improvement ideas.
- Baselines and targets define the gap; progress is the share of the gap closed.
- CSFs state what must go well; KPIs measure whether it does.
- Change success rate and MTTR are widely used measures of stability and recovery.
- Continual improvement
- A recurring organizational activity performed at all levels to ensure performance continually meets stakeholders' expectations.
- Continual improvement model
- A seven-step sequence of questions for structuring improvements.
- Continual improvement register
- A database or structured document to track and manage improvement ideas from identification to final action.
- Target
- A measured goal for a future state.
- Critical success factor
- A necessary precondition for achieving intended results.
- Key performance indicator
- An important metric used to evaluate success in meeting an objective.
- Change success rate
- The share of changes implemented without causing incidents or needing rollback.
- Change failure rate
- The share of changes that cause incidents or need remediation or rollback.
- Mean time to restore service
- The average time from the start of an interruption to restoration of service.
- Momentum
- The continuing energy and support that sustains improvement over time.
Practice problems
Work each problem on paper first, then reveal the answer to check.
List the seven steps of the continual improvement model.
Show answer
What is the vision; where are we now; where do we want to be; how do we get there; take action; did we get there; how do we keep the momentum going.
Which step corresponds most closely to start where you are?
Show answer
Where are we now?
What does a continual improvement register record?
Show answer
Ideas, source, benefit, effort, priority, owner, status and results.
Baseline 40 %, target 60 %, current 50 %. Share of gap closed?
Show answer
50 %.
Distinguish a CSF from a KPI.
Show answer
A CSF is what must go well; a KPI measures whether it does.
300 changes, 15 failed. Change success rate?
Show answer
95 %.
20 incidents with 50 hours total restoration. MTTR?
Show answer
2.5 hours.
Why report the share restored within target as well as MTTR?
Show answer
Averages can hide long outliers.
Why is keeping momentum important?
Show answer
Improvements fade unless embedded and followed by further improvement.
Name the four DevOps key measures.
Show answer
Deployment frequency, lead time for changes, change failure rate and time to restore service.
Lesson quiz · 5 questions
Score 60% or more to complete this lesson.
Create a free account to save your progress, take quizzes and earn a certificate.