
HSE-311 · Lesson 7 of 12 · 25 min
Risk assessment: LOPA, fault trees, event trees and bow-ties
A HAZOP tells you what could go wrong and what safeguards exist. It does not always tell you whether those safeguards are enough. For the most serious scenarios, process safety teams use semi-quantitative and quantitative methods to estimate how often a scenario could lead to harm and to compare that with a tolerable level. This lesson covers the four tools you will meet most often: layer of protection analysis (LOPA), fault trees, event trees and bow-tie diagrams. It also explains how organizations decide what level of risk is tolerable. We continue with the loss-of-cooling scenario for reactor R-101 from Lesson 6.
Frequency, probability and risk
Two kinds of number appear in these methods. A frequency is how often something happens, expressed per year: a cooling water pump might trip about once every 10 years, a frequency of 0.1 per year. A probability has no units and describes the chance that something happens when it is called upon: a high-temperature trip that fails on one demand in 100 has a probability of failure on demand (PFD) of 0.01. Multiplying an initiating event frequency by the probabilities that each safeguard fails gives the frequency of the unwanted outcome. Risk combines that frequency with the severity of the outcome.
Layer of protection analysis
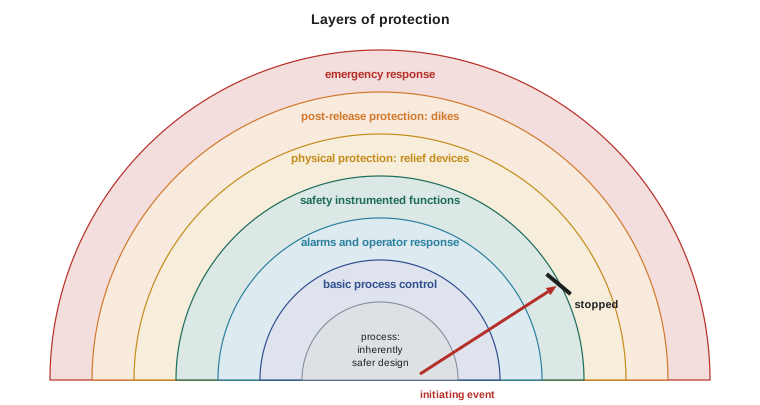
LOPA is a simplified, semi-quantitative method developed by CCPS and widely used in Canada and the United States. It takes one scenario at a time, typically from a HAZOP: a single initiating event leading to a single consequence. It credits only safeguards that qualify as independent protection layers (IPLs) and uses order-of-magnitude values for frequencies and failure probabilities. The mitigated frequency is then compared with a target frequency set by company risk criteria.
To count as an IPL, a safeguard must meet four tests. It must be independent of the initiating event and of the other IPLs credited. It must be effective, able to prevent the consequence on its own if it works. It must be dependable, with a known probability of failure. And it must be auditable, so its performance can be tested and checked. Training, general procedures and the basic process control system that caused the problem usually do not qualify.
| Protection layer | Typical PFD used in LOPA | Notes |
|---|---|---|
| Operator response to an alarm | 0.1 | Only if there is enough time (often 10 minutes or more), a clear alarm and trained response |
| Basic process control system loop | 0.1 | Only if independent of the initiating cause; usually only one BPCS layer credited |
| Safety instrumented function, SIL 1 | 0.1 to 0.01 | Designed and tested to IEC 61511 |
| Safety instrumented function, SIL 2 | 0.01 to 0.001 | Higher integrity design and testing |
| Pressure relief valve | 0.01 | Sized for the scenario, discharging to a safe place, maintained and tested |
| Rupture disc | 0.01 | Sized for the scenario |
| Dike or bund | 0.01 | Reduces the consequence of a spill rather than preventing it |
| Initiating event | Typical frequency used in LOPA (per year) |
|---|---|
| Control loop failure | 0.1 |
| Pump or compressor trip | 0.1 |
| Loss of cooling water utility | 0.1 |
| Operator error in a routine task done once a month | 0.1 (about 1 in 100 per task × 12 tasks) |
| Small leak from a pipe flange or seal | 0.01 to 0.1 |
| Pressure vessel catastrophic failure | 0.000001 (1 × 10⁻⁶) |
Worked problem
LOPA for loss of cooling on reactor R-101
Scenario: cooling water pump trips during acid chloride feed, leading to a runaway and vessel rupture with a possible fatality. Initiating event frequency 0.1 per year. The batch is in the feed step about 50 percent of the time. Proposed IPLs: operator response to the high-temperature alarm (PFD 0.1); high-temperature trip on an independent sensor closing the feed valve (PFD 0.1, SIL 1); rupture disc sized for the runaway (PFD 0.01). Probability of fatality given rupture: 0.5. The company target for a single-fatality scenario is 1 × 10⁻⁵ per year. Is protection adequate?
Show solution
- Unmitigated frequency including the time at risk: 0.1 × 0.5 = 0.05 per year.
- Multiply by each IPL: 0.05 × 0.1 (operator) × 0.1 (trip) × 0.01 (rupture disc) = 5 × 10⁻⁶ per year for rupture.
- Apply the conditional probability of fatality: 5 × 10⁻⁶ × 0.5 = 2.5 × 10⁻⁶ per year.
- Compare with the target: 2.5 × 10⁻⁶ is below 1 × 10⁻⁵, so the scenario meets the target with these IPLs.
- Check the assumptions: the operator layer needs enough time between alarm and runaway; the trip must not share a sensor or valve with the control loop; the rupture disc must be sized for two-phase runaway flow. If any IPL fails the tests, the result is wrong.
Answer: With three valid IPLs the mitigated frequency is about 2.5 × 10⁻⁶ per year, meeting the 1 × 10⁻⁵ target, provided each IPL truly meets the independence and sizing requirements.
# LOPA calculation for the R-101 loss-of-cooling scenario.
ie_freq = 0.1          # cooling water pump trip, per year
time_at_risk = 0.5     # fraction of time in the feed step
ipls = {"operator response to alarm": 0.1,
        "SIL 1 high-temperature trip": 0.1,
        "rupture disc (runaway sized)": 0.01}
p_fatality = 0.5
target = 1e-5

f = ie_freq * time_at_risk
print(f"Initiating frequency at risk: {f:.2e} /yr")
for name, pfd in ipls.items():
    f *= pfd
    print(f"  after {name:<30} {f:.2e} /yr")
f *= p_fatality
print(f"Mitigated fatality frequency: {f:.2e} /yr (target {target:.0e})")
print("Meets target" if f <= target else f"Gap: needs a further factor of {f / target:.0f}")

# What if the trip shares the controller's sensor and cannot be credited?
f2 = ie_freq * time_at_risk * 0.1 * 0.01 * p_fatality
print(f"Without the trip credit: {f2:.2e} /yr -> "
+ ("meets target" if f2 <= target else f"gap factor {f2 / target:.1f}"))Initiating frequency at risk: 5.00e-02 /yr after operator response to alarm 5.00e-03 /yr after SIL 1 high-temperature trip 5.00e-04 /yr after rupture disc (runaway sized) 5.00e-06 /yr Mitigated fatality frequency: 2.50e-06 /yr (target 1e-05) Meets target Without the trip credit: 2.50e-05 /yr -> gap factor 2.5
The second result shows how sensitive LOPA is to the independence rule. If the trip cannot be credited because it uses the same sensor as the control loop, the scenario misses the target by a factor of 2.5, and a properly independent trip or other layer is needed. LOPA's simplicity is a strength, but it also makes it easy to over-credit safeguards. Good LOPA practice uses a written rule book, conservative values and peer review.
Fault trees
A fault tree starts with an undesired top event and works backwards to find combinations of causes. Events are linked by logic gates. An OR gate means the event above happens if any of the events below happens; for small probabilities, the probabilities add. An AND gate means all events below must happen together; their probabilities multiply. Fault trees are good for complex systems with redundancy and shared causes, and for finding minimal cut sets: the smallest combinations of failures that cause the top event.
# A small fault tree for "no effective cooling during feed" (probabilities per demand).
def OR(*p):
    q = 1.0
    for x in p:
        q *= (1 - x)
    return 1 - q

def AND(*p):
    r = 1.0
    for x in p:
        r *= x
    return r

pump_A_fails = 0.05
pump_B_fails_to_start = 0.1        # standby pump
valve_fails_closed = 0.01
strainer_blocked = 0.005
no_pumping = AND(pump_A_fails, pump_B_fails_to_start)
top = OR(no_pumping, valve_fails_closed, strainer_blocked)
print(f"P(both pumps unavailable) = {no_pumping:.4f}")
print(f"P(no effective cooling)   = {top:.4f}")
print(f"Contribution of the control valve: {valve_fails_closed / top:.0%}")P(both pumps unavailable) = 0.0050 P(no effective cooling) = 0.0199 Contribution of the control valve: 50%
The result shows something a simple glance might miss. The standby pump makes pumping failure rare, so the single control valve and the strainer dominate the result. Adding a third pump would hardly help; a bypass around the control valve, a duplex strainer or a differential pressure alarm would help more. This is the main practical value of fault trees: they show where to put effort.
Event trees
An event tree works forwards from an initiating event through the success or failure of each safeguard or condition, such as ignition, detection or isolation. Each branch has a probability, and the frequency of each final outcome is the initiating frequency multiplied by the branch probabilities along its path. Event trees are used to estimate how often a release becomes a jet fire, a flash fire, an explosion or a harmless dispersion (Lesson 4).
# Event tree for a flammable gas leak (frequencies per year, probabilities illustrative).
leak = 1e-3                       # leak frequency per year
p_immediate = 0.1                 # immediate ignition
p_delayed = 0.3                   # delayed ignition, given no immediate ignition
p_vce = 0.4                       # explosion rather than flash fire, given delayed ignition (congested area)
outcomes = {
    "jet fire":                leak * p_immediate,
    "cloud explosion (VCE)":   leak * (1 - p_immediate) * p_delayed * p_vce,
    "flash fire":              leak * (1 - p_immediate) * p_delayed * (1 - p_vce),
    "safe dispersion":         leak * (1 - p_immediate) * (1 - p_delayed),
}
for k, v in outcomes.items():
    print(f"{k:<24} {v:.2e} /yr")
print(f"check sum: {sum(outcomes.values()):.2e} /yr")jet fire 1.00e-04 /yr cloud explosion (VCE) 1.08e-04 /yr flash fire 1.62e-04 /yr safe dispersion 6.30e-04 /yr check sum: 1.00e-03 /yr
Bow-tie diagrams
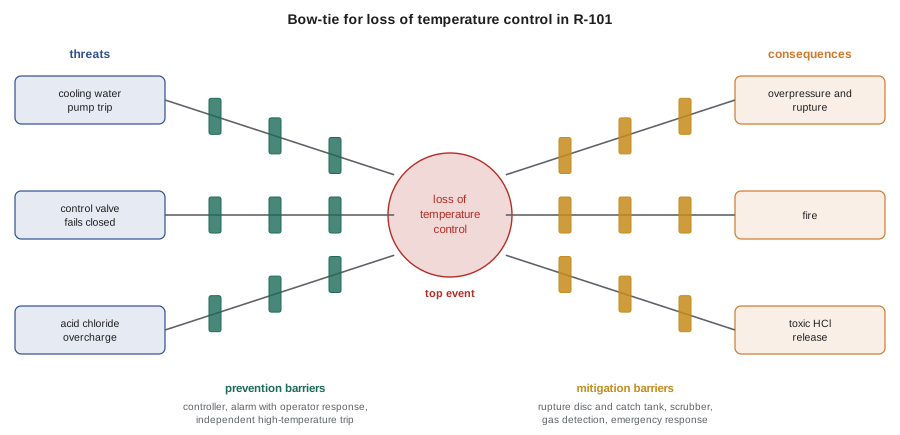
A bow-tie combines a simplified fault tree and event tree around a central top event, usually the loss of control or loss of containment. Threats on the left lead to the top event, with prevention barriers in between. Consequences on the right follow from it, with mitigation barriers in between. Escalation factors are conditions that can weaken a barrier, such as a bypassed trip, and they have their own controls. Bow-ties are easy to read and are popular for communicating major hazards to operators, managers and regulators, and for linking each barrier to the people and maintenance tasks that keep it working.
Deciding what is tolerable
Risk assessment needs a yardstick. Many companies define tolerable risk in terms of individual risk, the annual chance that a particular person is killed, and societal risk, the relationship between the number of people who could be harmed and the frequency of such events, often shown as an F–N curve. In Canada, guidelines published by MIACC and maintained by CSChE suggest land-use criteria based on individual risk around hazardous facilities, such as no restriction beyond the 1-in-a-million (10⁻⁶) per year contour. There is no national legal limit; each company sets criteria consistent with these guidelines and with what courts would consider reasonable.
| Risk level (individual, per year) | Common interpretation (illustrative) |
|---|---|
| 10⁻³ or more for workers | Intolerable; must be reduced whatever the cost |
| 10⁻⁴ for the public | Often treated as the upper limit of tolerability for the public |
| 10⁻⁴ to 10⁻⁶ | Tolerable only if reduced as low as reasonably practicable |
| 10⁻⁶ or less | Broadly acceptable; often used as a land-use boundary for sensitive development |
Common mistakes
MistakeCrediting every safeguard listed in the HAZOP as an IPL.
InsteadCredit only safeguards that are independent, effective, dependable and auditable.
MistakeCounting operator response when there are only two minutes to act.
InsteadCredit operator response only with enough time, a clear alarm and a trained, practised response.
MistakeAdding more of an already redundant component.
InsteadUse fault trees to find the single points of failure that dominate the result.
MistakeTreating LOPA numbers as precise.
InsteadUse them as order-of-magnitude estimates, with conservative values and peer review.
MistakeDrawing a bow-tie and filing it.
InsteadLink each barrier to an owner, test schedule and performance indicator.
Summary and key terms
- Frequencies are events per year; probabilities of failure on demand are unitless chances that a safeguard fails.
- LOPA multiplies an initiating frequency by the PFDs of independent protection layers and compares the result with a target.
- An IPL must be independent, effective, dependable and auditable.
- Fault trees work back from a top event using AND and OR gates and reveal dominant causes.
- Event trees work forward from an initiating event to estimate the frequency of each outcome.
- Bow-ties show threats, prevention barriers, the top event, mitigation barriers and consequences in one picture.
- Tolerable risk criteria use individual and societal risk, often with ALARP between upper and lower bounds.
- LOPA
- Layer of protection analysis, a semi-quantitative method for one scenario at a time.
- Independent protection layer
- A safeguard that is independent, effective, dependable and auditable.
- Probability of failure on demand
- The chance that a safeguard fails to work when it is needed.
- Initiating event
- The failure or error that starts a scenario.
- Mitigated frequency
- The frequency of a consequence after credit for protection layers.
- Fault tree
- A logic diagram working back from a top event to combinations of causes.
- Minimal cut set
- The smallest combination of failures that causes the top event.
- Event tree
- A diagram working forward from an initiating event through safeguard outcomes.
- Bow-tie diagram
- A picture of threats, barriers, a top event and consequences.
- ALARP
- As low as reasonably practicable; reducing risk until further reduction is grossly disproportionate.
Practice problems
Work each problem on paper first, then reveal the answer to check.
What is the difference between a frequency and a PFD?
Show answer
A frequency is events per year; a PFD is a unitless probability that a safeguard fails on demand.
List the four tests an IPL must pass.
Show answer
Independent, effective, dependable, auditable.
An initiating event occurs 0.1 times a year and two IPLs have PFDs of 0.1 and 0.01. What is the mitigated frequency?
Show answer
0.1 × 0.1 × 0.01 = 1 × 10⁻⁴ per year.
Why is general training not usually credited as an IPL?
Show answer
It is not specific to the scenario and its effect cannot be quantified or audited like an IPL.
In a fault tree, how are probabilities combined at an AND gate?
Show answer
They are multiplied.
Two independent pumps each fail with probability 0.05. What is the probability both fail?
Show answer
0.0025.
A leak occurs 0.01 times a year; immediate ignition probability is 0.2. What is the jet fire frequency?
Show answer
0.002 per year.
What sits in the centre of a bow-tie?
Show answer
The top event, usually loss of control or loss of containment.
What is an escalation factor?
Show answer
A condition that weakens a barrier, such as a bypassed trip or overdue test.
What does ALARP require?
Show answer
Reducing risk until further reduction would be grossly disproportionate to the benefit.
Lesson quiz · 5 questions
Score 60% or more to complete this lesson.
Create a free account to save your progress, take quizzes and earn a certificate.