
HSE-311 · Lesson 1 of 12 · 28 min
Process safety versus personal safety
A plant can go years without a single lost-time injury and still be one bad shift away from a disaster. That is the central lesson of process safety. Personal safety deals with slips, trips, cuts, strains and falls: frequent events that usually hurt one person. Process safety deals with the loss of containment of hazardous materials and energy: fires, explosions and toxic releases that are rare but can kill many people, destroy a plant and harm the surrounding community. HSE-310 introduced chemical and process hazards at the plant level. This course goes deeper into how process plants prevent major accidents, and this first lesson explains why process safety needs its own methods, its own metrics and its own attention from leaders.
Two different kinds of risk
Personal safety hazards are mostly visible and local. A trailing cable, a missing guard or an oily floor can be seen and fixed by the people who work there. The consequences are usually limited to the person doing the task. Process safety hazards are often invisible and systemic. A corroded pipe wall, a bypassed trip, a relief valve that was never sized for a new reaction or a level transmitter that has drifted out of calibration may give no sign at all until the day containment is lost. The consequences can reach far beyond the person who made the last mistake.
| Feature | Personal (occupational) safety | Process safety |
|---|---|---|
| Typical events | Slips, trips, cuts, strains, falls, struck-by | Fires, explosions, toxic releases, runaway reactions |
| Frequency | Relatively frequent | Rare at any single site |
| Consequences | Usually one person | Many people, the plant, the community, the environment |
| Visibility of hazard | Often visible on the shop floor | Often hidden in design, equipment condition and systems |
| Main causes | Unsafe conditions and acts at the task level | Failures of design, integrity, procedures, management systems |
| Typical measures | Injury rates, behaviour observations | Loss of containment events, safeguard demands, barrier health |
| Who controls it | Workers and front-line supervisors, largely | Engineers, operators, maintenance and managers together |
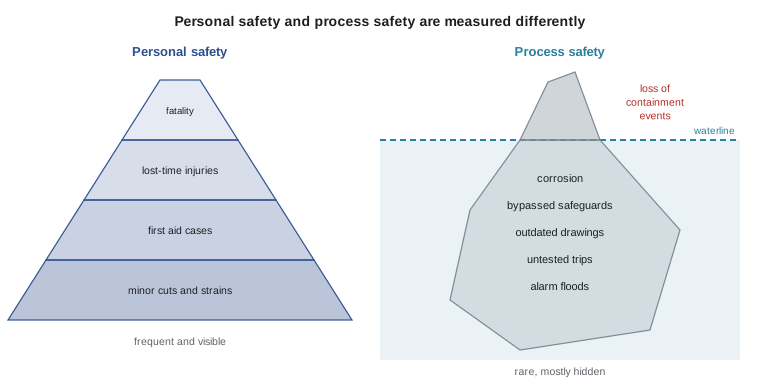
Why good injury rates can mislead
Many organizations measure safety with injury frequency rates such as total recordable injuries per 200,000 hours. These numbers matter, but they say almost nothing about process safety. A refinery can have an excellent injury rate because its contractors wear their glasses and hold the handrail, while its relief system is undersized, its alarms flood the control room every upset and its inspection program is years behind. When leaders celebrate injury rates and assume the plant is safe, they can miss the warning signs of a major accident.
The best-known example is the 2005 explosion at the BP Texas City refinery, which killed 15 people and injured about 180. In the years before the explosion the site's personal injury rate had improved, and managers were rewarded for it. Meanwhile, maintenance budgets had been cut, the raffinate splitter tower's level instruments were unreliable, operators were fatigued, and trailers for contractors had been placed close to process units. The US Chemical Safety and Hazard Investigation Board (CSB) and an independent panel led by James Baker both concluded that the company had confused personal safety performance with process safety performance. Lesson 2 looks at this accident in more detail.
What process safety is
Process safety is a disciplined framework for managing the integrity of operating systems and processes that handle hazardous substances. It relies on good design, sound engineering, operating and maintenance practices, and management systems that keep all of these working over decades. The Center for Chemical Process Safety (CCPS), part of the American Institute of Chemical Engineers, and the Canadian Society for Chemical Engineering (CSChE) both publish widely used guidance. The core idea is simple: keep the hazardous material inside the pipes and vessels, keep the energy under control, and have reliable barriers ready in case something goes wrong.
The vocabulary of process safety
A few terms come up again and again in this course. A hazard is something with the potential to cause harm, such as a tank of flammable liquid or a reactor that can run away. Risk combines how likely a harmful event is with how bad it would be. A loss of primary containment (LOPC) is an unplanned or uncontrolled release of material from its normal container, such as a pipe, vessel or tank. A safeguard or barrier is anything that prevents an event or reduces its consequences: a relief valve, a high-level trip, a dike, an operating procedure, a gas detector. A major accident is a loss of containment with serious consequences: fatalities, serious injuries, significant community or environmental harm or major asset damage.
| Term | Plain meaning | Plant example |
|---|---|---|
| Hazard | Potential to cause harm | 30 m³ of toluene in a storage tank |
| Initiating event | The first thing that goes wrong | Cooling water pump trips |
| Loss of containment | Material escapes its normal container | Flange gasket fails on a hot oil line |
| Safeguard (barrier) | Prevents or limits the harm | High-temperature trip that stops the reactor feed |
| Consequence | What happens if barriers fail | Pool fire, toxic cloud, explosion |
| Risk | Likelihood combined with severity | One fire in 10,000 years with up to 2 fatalities |
Measuring process safety
Because injury rates do not measure process safety, industry developed separate indicators. The most widely used is API Recommended Practice 754, Process Safety Performance Indicators for the Refining and Petrochemical Industries, first published after the Texas City inquiry and now in its fourth edition (published August 2026). Many Canadian operators report against it, and CSChE's process safety guidance uses a similar tiered approach. It classifies events and measures in four tiers. Tier 1 and Tier 2 are lagging indicators: process safety events (PSEs) of greater and lesser consequence, defined by thresholds such as release quantity, injuries, fires and direct cost. Tier 3 covers challenges to safety systems, such as demands on relief devices or trips and excursions beyond safe operating limits. Tier 4 covers the health of the management system, such as overdue inspections, training completion and procedure reviews.
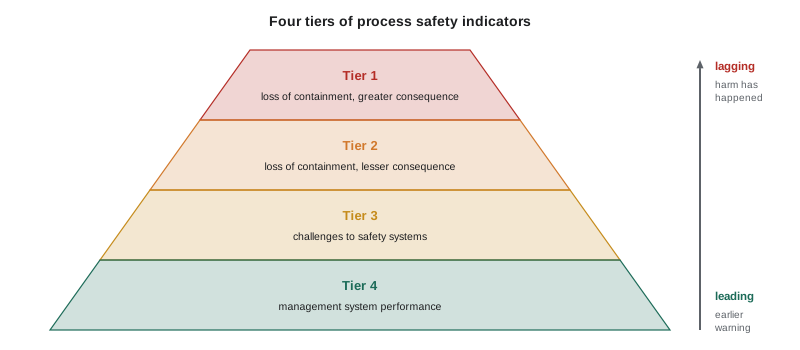
Tier 1 and Tier 2 events are counted and normalized per 200,000 hours worked, the same base used for injury rates, so that sites of different sizes can be compared. The normalization is the same, but the events counted are completely different. A site with no injuries can still have a high Tier 2 rate if it keeps having small flange leaks and minor fires.
# Compare personal injury rates with process safety event (PSE) rates for two sites.
# Illustrative numbers only.
sites = {
    "Site A": {"hours": 1_400_000, "recordables": 3, "tier1": 2, "tier2": 9},
    "Site B": {"hours": 900_000, "recordables": 7, "tier1": 0, "tier2": 2},
}
for name, d in sites.items():
    trir = d["recordables"] * 200_000 / d["hours"]
    t1 = d["tier1"] * 200_000 / d["hours"]
    t2 = d["tier2"] * 200_000 / d["hours"]
print(f"{name}: recordable rate {trir:.2f}, Tier 1 rate {t1:.2f}, Tier 2 rate {t2:.2f}")Site A: recordable rate 0.43, Tier 1 rate 0.29, Tier 2 rate 1.29 Site B: recordable rate 1.56, Tier 1 rate 0.00, Tier 2 rate 0.44
Site A has the better injury rate but the worse process safety record. If its leaders looked only at recordables, they would think it was the safer site. The two Tier 1 events at Site A deserve investigation as possible precursors of something worse, and the nine Tier 2 events suggest a pattern of small losses of containment that the management system is not catching.
Worked problem
Classifying events
During one quarter a chemical plant records: a worker cuts a hand on sheet metal; a pump seal leaks 40 kg of a flammable solvent that is contained in a curbed area and does not ignite; a high-pressure trip on a reactor activates twice; three operator procedure reviews are overdue. Which are personal safety events and which are process safety indicators?
Show solution
- The hand cut is a personal safety event. It is counted in injury rates, not in PSE rates.
- The seal leak is a loss of primary containment of a hazardous material. Whether it is Tier 1 or Tier 2 depends on the material category and the threshold quantity in API RP 754; a release of this size of a flammable liquid is likely at least Tier 2.
- The two trip activations are demands on a safety system. They are Tier 3 indicators: the barrier worked, but the process reached a point where it was needed.
- The overdue procedure reviews are Tier 4 indicators of management system health.
Answer: One personal safety event, one likely Tier 2 process safety event, two Tier 3 challenges to safety systems and three Tier 4 management system indicators.
Who is responsible
Personal safety is often framed as everyone looking after themselves and their co-workers. Process safety needs that too, but it depends just as heavily on decisions made far from the hazard: the engineer who sizes a relief valve, the manager who approves a change, the planner who defers an inspection, the executive who sets a maintenance budget. That is why process safety frameworks put so much weight on management systems, competence and leadership. The operator who catches a rising temperature is the last line of defence, not the first.
Where process safety applies
Process safety began in refineries and chemical plants, but the same principles apply wherever large amounts of hazardous material or energy are stored or processed: pulp and paper mills, mining and mineral processing, fertilizer plants, ammonia refrigeration in food plants and arenas, water treatment plants using chlorine, pharmaceutical manufacturing, battery plants, LNG and hydrogen facilities, and oil and gas production (covered in HSE-330 to HSE-333). Even a small brewery with an ammonia chiller or a metal finisher with acid tanks has process safety hazards. Lesson 5 explains how the law decides which sites must have a formal process safety management program.
Worked problem
Spotting a process safety hazard in an unexpected place
A community arena has a refrigeration plant charged with about 900 kg of ammonia to keep the ice frozen. The manager says the arena is not an industrial site and safety means keeping the rink clean and the bleachers in good repair. Is that complete?
Show solution
- Identify the hazardous material: ammonia is toxic and, in some concentration ranges, flammable.
- Ask what loss of containment could do: a leak in the machine room could expose workers, and a large release could reach the public in the arena.
- Note the history: in 2017 three workers died after an ammonia leak at an arena refrigeration plant in Fernie, British Columbia.
- Conclude that the arena needs process safety thinking: leak detection, ventilation, emergency shutdown, trained operators, inspection of the refrigeration system and an emergency response plan.
Answer: No. Ammonia refrigeration is a process safety hazard, and the arena needs process safety controls in addition to ordinary facility safety.
A preview of the course
The rest of this course follows the logic of preventing major accidents. Lesson 2 looks at what history teaches. Lessons 3 and 4 explain how process materials burn, react and poison, and what fires, explosions and toxic releases do. Lesson 5 covers process safety management systems and the law in Canada and the United States. Lessons 6 to 8 deal with identifying hazards, assessing risk and choosing safeguards. Lessons 9 to 11 cover the disciplines that keep safeguards working over time: management of change, mechanical integrity, procedures, alarms and human factors. Lesson 12 brings it together with process safety culture and a capstone review of an invented chemical unit.
Common mistakes
MistakeUsing a low injury rate as proof that a process plant is safe.
InsteadTrack process safety indicators such as Tier 1 to Tier 4 events separately from injury rates.
MistakeTreating every small leak as a housekeeping issue.
InsteadRecord and investigate losses of containment as process safety events; small leaks are precursors.
MistakeAssuming process safety is only for refineries and chemical plants.
InsteadApply it wherever hazardous materials or energy are stored or processed, including ammonia refrigeration and chlorine systems.
MistakeCounting a trip activation as a success with nothing to learn.
InsteadTreat demands on safety systems as Tier 3 indicators and ask why the process reached that point.
MistakeLeaving process safety to the operators on shift.
InsteadRecognize that design, maintenance, management of change and budget decisions control most process risk.
Summary and key terms
- Personal safety deals with frequent, mostly visible, single-person events; process safety deals with rare loss of containment events that can harm many people.
- A good injury rate says little about process safety, as the 2005 Texas City explosion showed.
- Process safety keeps hazardous materials contained and energy controlled, with reliable barriers in case something fails.
- API RP 754 defines four tiers of indicators: Tiers 1 and 2 are lagging event counts, Tiers 3 and 4 are leading indicators.
- PSE rates use the same 200,000-hour base as injury rates but count different events.
- Process safety depends on decisions by engineers, planners and managers as much as on front-line workers.
- Process safety applies wherever large amounts of hazardous material or energy are present, including outside traditional chemical plants.
- Process safety
- The management of hazards that can lead to loss of containment of hazardous materials or energy.
- Personal safety
- The prevention of injuries such as slips, cuts and strains that usually affect one person.
- Loss of primary containment
- An unplanned or uncontrolled release of material from its normal pipe, vessel or tank.
- Process safety event
- A loss of containment that meets defined consequence thresholds.
- Tier 1 event
- A process safety event of greater consequence under API RP 754.
- Tier 2 event
- A process safety event of lesser consequence under API RP 754.
- Tier 3 indicator
- A challenge to a safety system, such as a relief valve lift or a safe operating limit excursion.
- Tier 4 indicator
- A measure of management system health, such as overdue inspections or training.
- Safeguard
- Any measure that prevents a hazardous event or reduces its consequences; also called a barrier.
- Major accident
- A loss of containment with serious consequences for people, the community, the environment or assets.
Practice problems
Work each problem on paper first, then reveal the answer to check.
Give two differences between personal safety and process safety.
Show answer
Frequency (frequent vs rare), consequences (one person vs many), visibility (visible vs hidden), causes (task level vs design and systems).
Why can an excellent injury rate be misleading at a refinery?
Show answer
It measures slips and strains, not the condition of equipment, safeguards and systems that prevent fires and explosions.
What is a loss of primary containment?
Show answer
An unplanned or uncontrolled release of material from its normal container.
Which API RP 754 tiers are lagging indicators?
Show answer
Tiers 1 and 2.
A relief valve lifts during an upset with no release to atmosphere beyond design. Which tier is it?
Show answer
A Tier 3 challenge to a safety system.
A site has 4 Tier 2 events and 800,000 work hours. What is its Tier 2 rate?
Show answer
4 × 200,000 / 800,000 = 1.0.
Name three decisions made away from the hazard that affect process safety.
Show answer
Relief valve sizing, approving changes, deferring inspections, setting maintenance budgets, staffing levels.
Why is ammonia refrigeration a process safety hazard?
Show answer
A loss of containment releases a toxic gas that can harm workers and the public.
What did investigators conclude about BP Texas City?
Show answer
The company confused personal safety performance with process safety performance and neglected the latter.
What is the purpose of a safeguard?
Show answer
To prevent a hazardous event or reduce its consequences.
Lesson quiz · 5 questions
Score 60% or more to complete this lesson.
Create a free account to save your progress, take quizzes and earn a certificate.