
DCT-330 · Lesson 2 of 12 · 20 min
Building management and electrical power monitoring systems
Two monitoring systems do most of the watching at Stonebridge: the building management system for everything mechanical and environmental, and the electrical power monitoring system for everything electrical. They look similar on screen, with lists of points, graphics, alarms and trends, but they collect different data, at different speeds, for different reasons. This lesson explains how each one gets its data, what it stores, and what a technician can and cannot learn from it.
Points: the basic unit of monitoring
Every reading or status a monitoring system collects is called a point. A point has a name, a value, a unit, a time stamp and a quality flag that says whether the value is fresh and trusted. 'CRAH-A07 supply air temperature' is a point; so are 'CRAH-A07 fan status', 'UPS-B2 output kW' and 'Leak cable D3-04 alarm'. A large site has tens of thousands of points: YUL-2's BMS holds about 38,000 and its EPMS about 21,000.
Points come in a few kinds, and the kind matters when reading a screen:
- Analog inputs: measured values that vary, such as temperature, pressure, flow, current or kW.
- Binary or digital inputs: two-state statuses, such as on/off, open/closed, alarm/normal.
- Outputs: values the system sends to equipment, such as a CRAH's supply setpoint or a valve's commanded position. A point that the BMS commands is often different from the point that reports what actually happened: 'valve command 100 %' and 'valve position feedback 12 %' disagreeing is exactly how the stuck actuator in lesson 1 shows up.
- Calculated points: values the software works out from others, such as a hall's total IT load or a CRAH's delta-T.
Each point's name follows a naming convention, so that anyone can tell from the name what and where it is. Stonebridge uses site, building, system, equipment and point, for example YUL2.A.CRAH.A07.SAT for the supply air temperature of CRAH-A07 in Hall A (YUL2 on the other campus). Naming conventions matter more than they seem: a point named 'TEMP-3' in a list of 38,000 is no help at three in the morning.
How the BMS gets its data
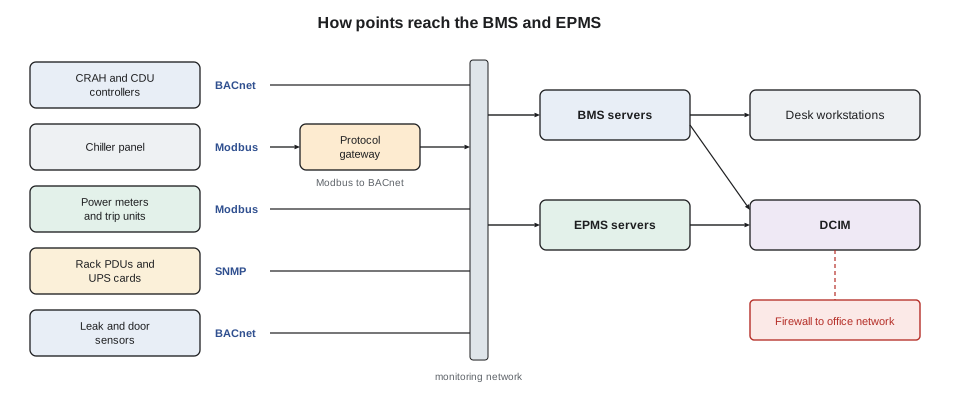
The BMS is a network of controllers. Each piece of mechanical equipment has its own controller: a CRAH's onboard controller, a CDU's controller, a chiller's panel. Field controllers in each room collect the loose sensors: temperature and humidity sensors on rack doors, differential pressure sensors under the floor, leak detection cables. The controllers talk to BMS servers in the operations room over a dedicated network, using one of a few standard protocols:
- BACnet, the building automation protocol defined by ASHRAE and ISO, used by most building controllers. BACnet devices describe their own points as objects (analog input, binary value and so on), which makes them easy to add to a BMS.
- Modbus, an older and simpler protocol widely used by industrial and electrical equipment. A Modbus device holds its values in numbered registers; the BMS must be told which register means what, from the device's register map.
- SNMP, the network management protocol, used by IT-style equipment such as rack PDUs, some UPS network cards and environmental monitors.
Many devices speak only one of these, so sites use gateways that translate, for example from a CRAH's Modbus registers to BACnet objects. Each extra translation is another place for a mistake: a register mapped to the wrong point, a value scaled wrongly (a temperature in tenths of a degree read as whole degrees), or a gateway that freezes and keeps reporting its last value.
Polling, trending and stale data
Most monitoring systems poll: they ask each device for its values at a fixed interval, or the device reports a change. A typical BMS poll interval is a few seconds to a minute. Values are stored as trends, with a time stamp, so that any point can be graphed over hours or months. Stonebridge keeps most trends at one-minute resolution for 13 months and hourly averages for seven years, long enough to compare one summer with the next.
Polling has two consequences a technician must understand. First, the screen is never quite live: a value may be up to one poll interval old, and events shorter than the interval can be missed entirely. Second, if a device stops answering, the system may keep showing its last value. Good systems flag this with a quality marker, a grey value or a 'stale' or 'comm fail' alarm, but a technician should always check the time stamp on a value that seems too steady. A temperature that has not changed by a single tenth of a degree for six hours is more likely a frozen gateway than a perfectly stable room.
# Spot stale points: a value that has not changed for too long is suspect
from datetime import datetime, timedelta
now = datetime(2027, 3, 9, 3, 0)
points = [  # (point, last value, time of last change)
    ("YUL2.A.CRAH.A07.SAT", 22.1, now - timedelta(minutes=3)),
    ("YUL2.A.RACK.A17-04.INLET", 23.4, now - timedelta(minutes=12)),
    ("YUL2.D.CDU.D2B.SUPPLY", 30.0, now - timedelta(hours=6, minutes=40)),
    ("YUL2.B.PDU.B05.KW", 212.6, now - timedelta(seconds=40)),
]
limit = timedelta(hours=1)
for name, value, changed in points:
    age = now - changed
    flag = "STALE? check comms" if age > limit else "ok"
print(f"{name:28s} {value:7.1f} unchanged for {str(age):>8s} {flag}")YUL2.A.CRAH.A07.SAT 22.1 unchanged for 0:03:00 ok YUL2.A.RACK.A17-04.INLET 23.4 unchanged for 0:12:00 ok YUL2.D.CDU.D2B.SUPPLY 30.0 unchanged for 6:40:00 STALE? check comms YUL2.B.PDU.B05.KW 212.6 unchanged for 0:00:40 ok
The CDU point is the one to check. In this case it was real: the gateway serving CDU-D2B's controller had locked up after a firmware update, and the BMS was still showing the last value it received. The CDU itself was fine, and its own panel in the gallery showed correct, varying readings. The fix was a gateway restart by the controls contractor, ticketed as a change.
What the BMS does beyond watching
The BMS also controls. It can command CRAH setpoints, start and stop equipment, sequence chillers and dry coolers, and run automatic routines such as starting a standby CRAH when another fails. Much of the cooling plant's automatic behaviour described in DCT-230 lives in the BMS or in the equipment controllers it supervises. Because the BMS can control, access to it is split: the desk staff can view everything and acknowledge alarms; only named controls engineers and critical facilities staff can change setpoints, schedules or programs, and every change is logged with the user name.
A technician should know where control lives for each system. If the BMS server fails, the equipment controllers keep running on their last settings, which is why sites put the critical logic in the controllers and not only in the central software. The desk loses visibility, not cooling; but losing visibility is itself an abnormal state, and the desk falls back to more frequent walking rounds until it is restored.
The electrical power monitoring system
The EPMS is built from power meters and the electronic trip units of breakers, UPS and generator controllers, and transfer switch controllers. Meters are installed at every important point in the power chain: the utility incoming lines, each switchboard main and feeder, each UPS input and output, each floor PDU and RPP, and often each branch circuit. They measure voltage, current, real and apparent power, power factor, energy, frequency and harmonics.
The EPMS differs from the BMS in two important ways. It is faster and more detailed: good power meters capture events lasting a few milliseconds, and record waveforms of the voltage and current before, during and after a disturbance. And it records the state of every breaker, which is how the one-line overview on the desk wall shows which paths are carrying load.
The EPMS is what made the DCT-220 storm night reconstructable afterwards. The utility line loss at 02:41:07 was recorded by the incoming meters to the millisecond, along with the voltage sag that preceded it, the UPS transfer to battery, the generator breakers closing and the frequency swings on generator. The incident report's timeline came straight from the EPMS event log.
| BMS | EPMS | |
|---|---|---|
| Watches | Mechanical and environmental equipment | The power chain |
| Typical data | Temperatures, humidity, pressures, flows, fan and pump status, leaks | Voltage, current, kW, energy, power factor, harmonics, breaker status |
| Typical speed | Seconds to a minute | Continuous metering; events captured in milliseconds |
| Special records | Long trends of slow-moving values | Waveform captures and sequence-of-events logs |
| Controls equipment? | Yes, many mechanical systems | Usually monitoring only; breakers operated at the equipment |
| Main protocols | BACnet, Modbus | Modbus, IEC 61850 in some newer sites |
Power quality records
Power meters with power quality functions record events against limits: sags (voltage dips), swells, interruptions, transients and harmonic distortion. Each event is stored with its start time, duration, depth and a waveform. A technician on the desk reads these to answer simple questions: did a sag reach the equipment, how deep and how long was it, and did the UPS go to battery? DCT-220 lesson 2 covered how sags are judged against an equipment tolerance curve.
The EPMS also matters for billing and capacity. The energy meters on each customer's branch circuits are the source of the power figures in monthly reports and the readings that capacity planning uses (lesson 6). A meter that has drifted or been wired with a current transformer the wrong way round gives wrong figures for months unless someone notices. A negative kW reading on a load that cannot export power is the classic sign of a reversed current transformer.
import math
# Checking EPMS readings for a three-phase feeder: do V, I and kW agree?
v_ll = 600          # line-to-line volts
amps = [412, 405, 418]
pf = 0.97
kw_reported = 410.5
kw_calc = math.sqrt(3) * v_ll * (sum(amps) / 3) * pf / 1000
print(f"Calculated from volts, amps and PF: {kw_calc:6.1f} kW")
print(f"Reported by the meter            : {kw_reported:6.1f} kW")
diff = (kw_reported - kw_calc) / kw_calc * 100
print(f"Difference: {diff:+.1f} % ->", "consistent" if abs(diff) < 5 else "check the meter or its current transformers")Calculated from volts, amps and PF: 415.0 kW Reported by the meter : 410.5 kW Difference: -1.1 % -> consistent
Integration with DCIM and tickets
Neither the BMS nor the EPMS knows which customer owns a rack, or what a point means in business terms. That is the job of DCIM, which reads selected points from both systems and attaches them to assets: the rack's inlet temperature, its branch circuit loads, the CRAHs that cool its row. When Corvid's team asks what the inlet temperatures were in row 3 overnight, the desk answers from DCIM, which takes its data from the BMS. Some alarms also create tickets automatically; others are turned into tickets by the desk. Lessons 5 and 7 return to both links.
Worked problem
A voltage sag on Hall B
At 14:22 on a clear afternoon, the EPMS logs a sag on the utility incoming Line 2 and several UPS systems in Halls B and C report 'on battery' for under a second. The cloud tenant's team calls asking if anything happened. What can Jamal tell them, and where does he get it?
Show solution
- In the EPMS event log he finds the sag: 14:22:31.418, all three phases, depth to 78 % of nominal, duration 140 ms.
- The waveform capture shows a clean recovery; the UPS event log shows UPS-B1 to B4 on battery for 0.3 to 0.6 s and back to normal; the static bypass was not used.
- The redundancy board stayed green and no IT equipment lost power: UPS outputs were steady throughout.
- He opens a ticket, attaches the EPMS event and tells the tenant: a short utility voltage dip occurred at 14:22, the UPS systems carried the load as designed, no interruption to their power.
- Dmitri asks the utility account contact whether there was a known event; the utility later reports a fault cleared on a nearby circuit.
Answer: Jamal answered within ten minutes, from records, with times and figures, and without speculating about causes the utility had not yet confirmed.
Common mistakes
MistakeTrusting a value that has not changed for hours.
InsteadCheck the time stamp and quality flag; frozen gateways keep showing the last value.
MistakeConfusing a commanded value with the actual value.
InsteadCompare command points with feedback points; disagreement is often the fault.
MistakeLooking for a millisecond voltage event in the BMS.
InsteadUse the EPMS event log and waveform captures.
MistakeAssuming a negative kW reading on a server feeder is a strange load.
InsteadSuspect a reversed current transformer and report it.
MistakeTreating a BMS server failure as harmless because cooling keeps running.
InsteadLost visibility is an abnormal state; increase walking rounds and get it restored.
Summary and key terms
- A point is one reading or status, with a value, unit, time stamp and quality; naming conventions make points readable.
- The BMS gathers points from equipment controllers over BACnet, Modbus or SNMP, often through gateways, and also controls much mechanical equipment.
- Polled data is never quite live; stale values and frozen gateways are a common trap.
- The EPMS records the power chain in detail, including millisecond events, waveforms and breaker states, and is the main source for electrical incident timelines.
- Power meter readings drive billing and capacity figures, so wrong or reversed meters matter.
- DCIM attaches BMS and EPMS data to assets and customers; tickets turn alarms into work.
- Point
- A single monitored value or status, such as a temperature or a breaker position.
- BACnet
- A standard protocol for building automation controllers.
- Modbus
- A simple register-based protocol common in industrial and electrical devices.
- SNMP
- Simple Network Management Protocol, used by IT and network equipment.
- Gateway
- A device that translates between protocols.
- Stale value
- A reading that is no longer being updated but is still displayed.
- Waveform capture
- A recording of voltage and current shapes around an electrical event.
Practice problems
Work each problem on paper first, then reveal the answer to check.
A CRAH valve command reads 100 % but its position feedback reads 10 %. What does that suggest?
Show answer
The actuator or valve is not responding: a stuck valve or failed actuator.
Why might a 50 ms voltage sag not appear in the BMS?
Show answer
The BMS polls every few seconds or more and is not designed for fast electrical events; the EPMS records them.
Name the three common monitoring protocols in this lesson.
Show answer
BACnet, Modbus and SNMP.
A feeder's meter reports 328 kW while volts, amps and power factor give 330 kW. Is that a concern?
Show answer
No; under 1 % difference is consistent.
Lesson quiz · 5 questions
Score 60% or more to complete this lesson.
Create a free account to save your progress, take quizzes and earn a certificate.