
DCE-499 · Lesson 12 of 12 · 24 min
Sustainability, design review and the final presentation
The final stage of the capstone tests the design as a whole. Does it meet the client's sustainability goals, not only for efficiency but for carbon, water and the wider community? Do the disciplines fit together without conflicts? Can the team explain and defend its decisions to a client panel that will be asking hard questions about cost, risk and performance? This lesson covers carbon accounting for data centres, including the difference between annual and hourly matching of clean electricity, embodied carbon, heat reuse and water stewardship, then turns to the design review process, coordination checks, and how to structure and deliver the final presentation. It ends with a checklist of capstone deliverables and a reflection on what the project teaches about data centre engineering as a profession.
Operational carbon
Greenhouse gas accounting under the GHG Protocol divides emissions into Scope 1 (direct, such as diesel burned in generators and refrigerant leaks), Scope 2 (purchased electricity) and Scope 3 (indirect, such as manufacturing of equipment and construction materials). For a data centre, Scope 2 dominates operational emissions. It can be reported two ways: location-based, using the average emissions intensity of the grid where the electricity is consumed, and market-based, reflecting contracts for clean electricity such as power purchase agreements (PPAs) and energy attribute certificates.
A common corporate approach has been annual matching: buying as much renewable electricity over a year as the facility consumes. But wind and solar generation do not match a data centre's steady demand hour by hour, so on calm nights the facility still draws fossil-heavy grid power. Hourly matching (often called 24/7 carbon-free energy) measures the share of each hour's consumption met by clean electricity on the same grid at the same time, which better reflects real emissions impact. Standards bodies have been reviewing Scope 2 guidance with hourly matching proposals, and several large operators have adopted 24/7 goals.
import numpy as np
# Carbon accounting for phase 1: annual versus hourly matching, and heat reuse
rng = np.random.default_rng(12)
h = np.arange(8760)
load = 24 * 1.18 + rng.normal(0, 0.4, 8760)                 # facility demand, MW (PUE about 1.18)
grid_ci = 0.30 + 0.12 * np.sin(2 * np.pi * (h % 24 - 6) / 24) + rng.normal(0, 0.03, 8760)  # t CO2 per MWh
wind = np.clip(rng.gamma(1.6, 1.0, 8760) / 1.6 * 34 * (1 + 0.25 * np.cos(2 * np.pi * h / 8760)), 0, 110)  # MW from contracted wind

energy = load.sum()
location = (load * grid_ci).sum()
print(f"facility energy {energy / 1000:.0f} GWh; location-based emissions {location / 1000:.0f} kt CO2")
print(f"contracted wind {wind.sum() / 1000:.0f} GWh = {wind.sum() / energy:.0%} of annual demand")
matched = np.minimum(load, wind)
cfe = matched.sum() / energy
print(f"hourly carbon-free matching {cfe:.0%}")
residual = ((load - matched) * grid_ci).sum()
print(f"emissions from unmatched hours {residual / 1000:.0f} kt CO2 ({residual / location:.0%} of location-based)")

# Heat reuse: liquid loop heat raised by heat pumps for district heating
heat_mw = 12.9
cop = 4.0
delivered = heat_mw * cop / (cop - 1)       # heat out = source heat + compressor work
heating_hours = 5000
print(f"heat pump output {delivered:.1f} MW; {delivered * heating_hours / 1000:.0f} GWh of heat in {heating_hours} heating hours")facility energy 248 GWh; location-based emissions 74 kt CO2 contracted wind 294 GWh = 119% of annual demand hourly carbon-free matching 75% emissions from unmatched hours 19 kt CO2 (25% of location-based) heat pump output 17.2 MW; 86 GWh of heat in 5000 heating hours
The analysis shows the gap between the two measures. A wind PPA that delivers 119 % of the facility's annual energy would let the client claim 100 % renewable electricity on an annual basis, yet hourly matching reaches only about 75 %, and the unmatched hours still produce about a quarter of the location-based emissions. Closing that gap requires a portfolio: combining wind with solar, which peaks at different times, adding firm clean resources such as hydro, nuclear or geothermal where available, using battery storage to shift clean energy, and shifting flexible workloads in time where customers allow. The capstone sustainability assessment should report location-based, market-based and hourly matching results and propose a pathway toward the client's later 24/7 goal.
Embodied carbon
Construction materials and equipment carry embodied carbon from their manufacture and transport. For data centres, concrete and steel in the building, and the large amounts of copper, aluminium and steel in electrical equipment, are major contributors, along with IT equipment itself (which is outside the facility design scope but often the largest Scope 3 item for operators). Embodied carbon of the building and infrastructure is commonly estimated with life cycle assessment (LCA) tools using environmental product declarations (EPDs). Reduction strategies include lower-carbon concrete mixes using supplementary cementitious materials, steel with high recycled content from electric arc furnaces, efficient structural design that uses less material, durable designs that avoid early replacement, and timber for non-critical support buildings where codes allow.
In Canada, the federal Standard on Embodied Carbon in Construction requires embodied carbon reporting and reductions for federal government projects, and some provinces and municipalities are developing similar requirements; private data centre clients increasingly request whole-building LCAs to support their own targets.
Heat reuse
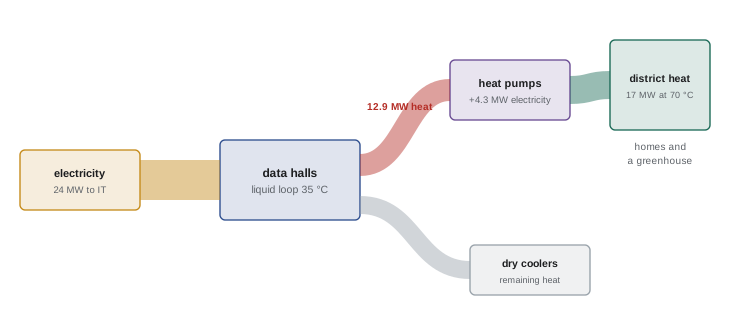
A data centre rejects nearly all of its electricity as heat. Liquid-cooled halls make that heat more useful because it leaves at higher temperatures, typically 35 to 45 °C in the facility loop. Heat pumps can raise it to 60 to 80 °C for district heating networks, greenhouses, aquaculture, industrial processes or nearby buildings. The C12 analysis shows that the phase 1 liquid loop could supply around 17 MW of heat through heat pumps, about 86 GWh per heating season, enough for thousands of homes on a district heating network. Energy reuse effectiveness (ERE) credits exported heat against total facility energy. Heat reuse depends on a nearby heat user willing to sign a long-term agreement and on the economics of the heat network, so the design typically provides connection points and space for heat pumps even if the reuse project comes later. Site C's location near a regional city makes a district heating partnership worth exploring.
Water and community
The sustainability assessment also reports water use (WUE and total annual litres), water sources (for example reclaimed water at Site C), and how water use varies with weather and design options (Lesson 6). Community benefits and impacts belong in the assessment too: noise, traffic, visual impact, local employment, tax revenue, and any community commitments made during permitting (Lesson 3). A credible sustainability case acknowledges trade-offs openly, for example that dry cooling saves water but uses more electricity, and explains how the design balances them according to the client's priorities.
The design review process
Before the final presentation, the design goes through review. In practice, reviews occur at each stage and include:
- Internal discipline reviews: each discipline's work checked by a senior engineer for technical correctness and code compliance.
- Interdisciplinary coordination review: checking that disciplines agree, using the basis of design, drawings and models. Typical checks include: do electrical loads include all mechanical equipment? Do generator and UPS sizes match? Are fire compartments aligned with power blocks? Do cable trays, busways and liquid cooling pipes fit in the same ceiling space without clashes? Are floor loads consistent with rack weights?
- Clash detection: using a federated 3D model (building information modelling, BIM) to find physical conflicts between systems automatically.
- Constructability and commissioning reviews: by contractors and the commissioning authority, checking that the design can be built and tested.
- Client and peer reviews: the client's technical team and sometimes an independent peer reviewer check the design against the brief.
Comments are recorded in a review log with a response from the responsible discipline and a status (accepted, rejected with reason, or under discussion). For the capstone, each team reviews another team's design and responds formally to the comments it receives.
The final presentation
The final presentation is the team's opportunity to show the client that the design meets the brief and to persuade them to proceed. A clear structure for a 30- to 40-minute presentation is:
- The brief and the team's understanding of the client's priorities, including any conflicts resolved.
- Site selection and the reasons for choosing Site C.
- Capacity and load definition, including the air and liquid mix and AI load dynamics.
- Electrical concept and reliability.
- Mechanical concept, efficiency and water.
- Civil, structural, architectural and fire protection concepts.
- Network, controls, security and operations.
- Cost, schedule and risk, with ranges and the critical path.
- Sustainability: carbon, water and heat reuse.
- Key decisions for the client and recommended next steps.
Strong presentations focus on decisions and trade-offs rather than describing every component. Each section should answer: what did we decide, why, what are the alternatives and trade-offs, and what does it mean for cost, schedule, risk and performance? Visuals (one-line diagrams, site plans, charts of PUE and cost) should be simple enough to read from the back of the room. Every team member should present part of the design, and the team should prepare for questions on weak points such as utility schedule risk, floodplain concerns and the uncertain AI share.
Worked problem
Answering a tough client question
The client asks: "Your schedule shows the utility substation on the critical path at 32 months, but our target is 30. Why should we accept your design?" Prepare an answer.
Show solution
- Acknowledge the issue directly: the substation is the critical path, and the current plan is two months over the target.
- Explain the cause: utility design and transformer procurement times quoted by the utility.
- Present options with costs and risks: owner pre-purchase of substation transformers to save about three months; phased energization of the first two power blocks; temporary power for commissioning.
- Recommend an option: owner pre-purchase plus phased energization, bringing phase 1 to about 29 months with modest additional cost.
- Identify the decision needed: client approval to commit funds for transformer pre-purchase within the next month.
Answer: A strong answer acknowledges the problem, explains it, offers costed options, recommends one, and asks for a specific decision.
Capstone deliverables checklist
Before submission, confirm that the package includes: the basis of design; site selection report and permitting plan; capacity and energy model; electrical one-lines, reliability analysis and equipment schedules; mechanical schematics, plant sizing and economizer analysis; site plan, building layout and structural criteria; fire protection and life safety concept; network and cabling concept; controls, security, commissioning and operations concept; cost estimate, schedule and risk register; sustainability assessment; the review log with responses; and the presentation slides. Check that numbers are consistent across documents (the same IT load, PUE, generator count and cost everywhere), since inconsistencies undermine credibility.
Reflection
Close the capstone with a short individual reflection: which decisions were hardest, where disciplines conflicted and how you resolved it, what you would do differently, and which skills you want to develop next. Data centre engineering rewards people who can work across disciplines, communicate with clients and contractors, quantify trade-offs and keep learning as technology changes. The capstone is a rehearsal for that professional practice.
Common mistakes
MistakeClaiming 100 % renewable on annual matching alone.
InsteadReport location-based, market-based and hourly matching.
MistakeIgnoring embodied carbon.
InsteadEstimate it with LCA and propose material reductions.
MistakeTreating heat reuse as an afterthought.
InsteadProvide connection points and space, and seek partners early.
MistakePresenting every component instead of decisions.
InsteadFocus on decisions, trade-offs and what the client must approve.
MistakeSubmitting documents with inconsistent numbers.
InsteadCross-check loads, counts and costs across all deliverables.
Summary and key terms
- Scope 2 dominates operational carbon; report location-based, market-based and hourly matching.
- Annual matching can claim 100 % renewable while hourly matching is far lower.
- Embodied carbon in concrete, steel and equipment can be reduced through material choices and LCA.
- Liquid cooling makes heat reuse via heat pumps and district heating practical.
- Design reviews check disciplines, coordination, clashes, constructability and the brief.
- Final presentations focus on decisions, trade-offs, risks and next steps.
- Consistent, complete deliverables and honest reflection complete the capstone.
- Scope 2 emissions
- Emissions from purchased electricity.
- Location-based method
- Scope 2 using average grid emissions intensity.
- Market-based method
- Scope 2 reflecting contracts for clean electricity.
- Power purchase agreement
- A long-term contract to buy electricity from a generator.
- Hourly matching
- Matching consumption with clean supply in each hour.
- Embodied carbon
- Emissions from manufacturing and transporting materials.
- Environmental product declaration
- A verified report of a product's environmental impacts.
- Energy reuse effectiveness
- A metric crediting exported heat against facility energy.
- Clash detection
- Finding physical conflicts between systems in a 3D model.
- Review log
- A record of review comments, responses and status.
Practice problems
Work each problem on paper first, then reveal the answer to check.
Distinguish Scopes 1, 2 and 3.
Show answer
Direct emissions, purchased electricity, and other indirect emissions.
What is the difference between location-based and market-based Scope 2?
Show answer
Average grid intensity versus contracted clean electricity.
Why can annual matching overstate clean energy use?
Show answer
Generation and demand do not coincide hour by hour.
Name three ways to raise hourly matching.
Show answer
Add solar, firm clean resources, storage, workload shifting.
Name two ways to reduce embodied carbon.
Show answer
Lower-carbon concrete, recycled steel, efficient structure.
A heat pump with COP 4 upgrades 10 MW of source heat. How much heat does it deliver?
Show answer
10 × 4 ÷ 3 ≈ 13.3 MW.
List three interdisciplinary coordination checks.
Show answer
Loads include mechanical, generator and UPS sizes match, compartments align with blocks, no clashes.
What does a review log record?
Show answer
Comments, responses and status.
What should each presentation section answer?
Show answer
What was decided, why, alternatives, and implications.
Why cross-check numbers across deliverables?
Show answer
Inconsistencies undermine credibility.
Lesson quiz · 5 questions
Score 60% or more to complete this lesson.
Create a free account to save your progress, take quizzes and earn a certificate.