
DCE-450 · Lesson 8 of 12 · 25 min
Maintenance strategies
A data centre that is well designed and thoroughly commissioned will still fail if it is poorly maintained. Breakers that are never exercised stick, batteries age, filters clog, connections loosen, fuel degrades and firmware becomes outdated. Yet maintenance itself is risky: a large share of data centre outages happen while equipment is being maintained, through switching errors, procedures that do not match the plant, or a second failure while redundancy is reduced. This lesson describes the main maintenance strategies, from reactive to reliability-centred, the techniques of condition monitoring, the standards that set maintenance requirements, how to choose replacement intervals, and how to perform maintenance safely on a live facility.
Four strategies
Maintenance strategies differ in when work is triggered:
- Reactive (run to failure): fix things when they break. Acceptable for cheap, non-critical items whose failure has no effect on the IT load, such as an office light, and wasteful or dangerous for anything critical.
- Preventive (time-based): perform tasks at fixed intervals, such as annual breaker servicing, quarterly filter changes or replacing UPS capacitors every few years, regardless of condition. Simple to plan and effective for wear-out failures with predictable timing, but it can replace healthy parts and, by disturbing equipment, introduce new faults.
- Predictive (condition-based): monitor the condition of equipment and intervene when the measurements show degradation. Thermography, oil analysis, vibration analysis, battery monitoring and partial discharge testing are typical techniques. It avoids unnecessary work but needs instruments, data and skilled interpretation.
- Reliability-centred maintenance (RCM): a structured process that chooses the right strategy for each failure mode of each asset, based on its consequences and how it can be detected. RCM builds on the FMEA of Lesson 7.
A mature data centre uses all four: run to failure for trivial items, time-based tasks where wear-out is predictable or the standards require them, condition monitoring for major electrical and rotating equipment, and RCM to decide which is which.
Condition monitoring techniques
| Technique | What it detects | Typical equipment |
|---|---|---|
| Infrared thermography | Loose or overloaded connections, unbalanced loads | Switchgear, busway, panels, PDUs |
| Battery monitoring | Rising internal resistance, weak jars, temperature | UPS batteries |
| Vibration analysis | Bearing wear, imbalance, misalignment | Pumps, fans, chillers, generators |
| Oil analysis | Wear metals, contamination, degradation | Generator engines, transformers, chillers |
| Dissolved gas analysis | Internal arcing or overheating | Liquid-filled transformers |
| Partial discharge testing | Insulation breakdown | Medium-voltage switchgear and cables |
| Fuel testing | Water, microbial growth, degradation | Generator fuel storage |
| Trend analysis | Gradual drifts in efficiency, temperature, current | All monitored equipment |
The baseline from commissioning (Lesson 3) is what gives these measurements meaning: an insulation resistance of 800 MΩ means little alone, but a fall from 5,000 MΩ at acceptance to 800 MΩ over three years is a clear warning. Monitoring systems that continuously record battery resistance, breaker operations, temperatures and power quality allow trends to be watched without a technician visiting.
Maintenance standards
In Canada, CSA Z463, Maintenance of electrical systems, sets out an electrical maintenance programme: planning, inspection, testing, and maintenance intervals based on equipment condition and criticality. Emergency generators are inspected and tested to CSA C282, which sets a schedule of inspections and operating tests under load, from weekly and monthly checks to annual tests. Workplace safety during maintenance follows CSA Z462.
Both electrical maintenance standards tie the maintenance interval to equipment condition, assessed from its physical state, its criticality and its operating environment, and they expect results to be recorded and trended. Manufacturers' instructions, the NETA MTS testing standard and the owner's insurer add further requirements. Mechanical maintenance draws on manufacturers' recommendations and standards such as ASHRAE 180, Standard Practice for Inspection and Maintenance of Commercial Building HVAC Systems.
Choosing a replacement interval
For components that wear out, such as UPS DC capacitors and fans, generator starter batteries, and bearings, the question is when to replace them before they fail. Replacing too early wastes money and introduces disturbance; replacing too late lets failures occur in service, where they are far more costly. The Weibull distribution models wear-out well. Its shape parameter β describes the failure pattern: β < 1 means early failures, β = 1 means a constant rate (random failures), and β > 1 means wear-out, with failures concentrated around the characteristic life η.
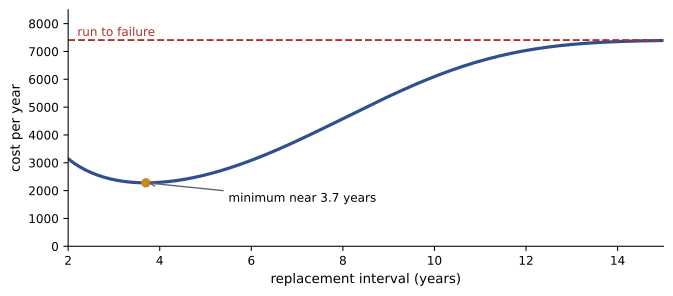
An age replacement policy replaces a component at age T or on failure, whichever comes first. The best T minimizes the long-run cost per year: the expected cost of a cycle (a planned replacement if the part survives to T, a failure replacement if it does not) divided by the expected length of a cycle.
import numpy as np
from scipy.integrate import quad

# Age replacement of UPS DC capacitors: replace at age T, or on failure if sooner
eta, beta = 9.0, 3.5          # Weibull scale (years) and shape: wear-out failures
cost_planned = 6000           # planned replacement during a maintenance window
cost_failure = 60000          # failure in service: emergency call-out plus risk to the load

def R(t):
    return np.exp(-(t / eta) ** beta)

def cost_rate(T):
    expected_cycle = quad(R, 0, T)[0]           # mean time per replacement cycle
    expected_cost = cost_planned * R(T) + cost_failure * (1 - R(T))
    return expected_cost / expected_cycle

for T in (3, 4, 5, 6, 7, 8, 10, 15):
    print(f"Replace every {T:>2} years: {cost_rate(T):7.0f} per year, P(fail first) = {1 - R(T):.3f}")

grid = np.arange(2, 15.01, 0.1)
best = grid[np.argmin([cost_rate(T) for T in grid])]
print(f"Lowest cost interval: about {best:.1f} years ({cost_rate(best):.0f} per year)")
print(f"Run to failure only: {cost_failure / quad(R, 0, np.inf)[0]:.0f} per year")Replace every 3 years: 2392 per year, P(fail first) = 0.021 Replace every 4 years: 2297 per year, P(fail first) = 0.057 Replace every 5 years: 2566 per year, P(fail first) = 0.120 Replace every 6 years: 3089 per year, P(fail first) = 0.215 Replace every 7 years: 3789 per year, P(fail first) = 0.340 Replace every 8 years: 4585 per year, P(fail first) = 0.484 Replace every 10 years: 6098 per year, P(fail first) = 0.764 Replace every 15 years: 7394 per year, P(fail first) = 0.997 Lowest cost interval: about 3.7 years (2280 per year) Run to failure only: 7409 per year
With illustrative data for UPS capacitors (characteristic life 9 years, β = 3.5, a failure in service costing ten times a planned replacement), replacing every 3.7 years minimizes cost at about 2,280 a year, roughly a third of the cost of running to failure. The curve is flat near the optimum, so a round 4-year interval costs almost the same and is easier to schedule. Notice that at the optimum, about 5 % of capacitors still fail before replacement: preventive maintenance reduces failures but does not eliminate them, which is why redundancy is still needed. The analysis only makes sense for β > 1; for random failures, replacing a working part on a schedule does nothing to reduce the failure rate.
Maintenance risk and the method of procedure
Every maintenance task on critical infrastructure changes the plant's configuration, and configuration changes are where outages happen. Data centre operators control this with a written method of procedure (MOP) for every task that affects critical systems, and a site-specific emergency operating procedure (EOP) for responding if something goes wrong. A good MOP includes:
- Scope, the equipment affected and the risk assessment, including the effect on redundancy (for example, the facility will be at N rather than N+1 for four hours).
- Prerequisites: approvals, notification to customers or IT teams, spare parts on hand, weather and other work checked, no conflicting maintenance.
- Step-by-step switching and work instructions, with expected indications at each step and space to initial each step as completed.
- Back-out steps: how to return to a safe configuration at any point if something goes wrong.
- Restoration and verification steps, and sign-off.
The MOP is reviewed by a second qualified person, rehearsed for complex tasks, and executed with one person reading each step aloud and another performing it (sometimes called the challenge-and-response method). Many outages begin with a technician working from memory or from a generic manufacturer procedure that does not match the site's switching arrangement.
Worked problem
Planning maintenance on a redundant UPS
A 2N facility has two UPS systems, A and B, each able to carry the full load. UPS A needs a four-hour annual service that requires transferring it to maintenance bypass. Each UPS has an availability of 0.99995 when in service, and the utility has a 1 % chance of an outage in any four-hour window during storm season. How should the work be planned?
Show solution
- During the service, UPS A is on maintenance bypass, so its loads are on raw utility power (or generator) with no UPS protection on the A side. The IT load is protected only by UPS B: the facility is at N, not 2N.
- The risk during the window is dominated by a utility event combined with any problem on the B side, or by an error during switching.
- Plan the work outside storm season, confirm that UPS B, its batteries and the generators have been recently tested, avoid any other work on the B side, notify customers, and have the UPS vendor and a spare parts kit on site. Execute with a MOP and challenge-and-response.
Answer: Maintenance deliberately reduces redundancy, so it should be scheduled when the external risk is lowest and the remaining path is known to be healthy, and it should be executed with the same rigour as a commissioning test. Concurrent maintainability (Lesson 5) is what makes the work possible without an outage, but it does not make the window risk-free.
Spare parts and the CMMS
Spares directly reduce MTTR (Lesson 6). A spares strategy identifies critical parts with long lead times, such as UPS power modules, breaker trip units, control boards, generator starters and pump seals, and holds them on site or under vendor agreements with guaranteed delivery times. A computerized maintenance management system (CMMS) records every asset, its maintenance plan, work orders, results, parts used and failure history. The CMMS turns maintenance into data: failure records improve the reliability models, trends show deteriorating assets, and compliance reports show auditors and customers that required tasks were done.
Measuring maintenance
Useful key performance indicators include the percentage of scheduled preventive tasks completed on time, the ratio of planned to reactive work (a high reactive share signals poor maintenance), the backlog of outstanding work orders, mean time to repair by equipment class, repeat failures, and incidents caused by maintenance. These are reviewed regularly by operations management and feed back into the maintenance plan.
Common mistakes
MistakeRunning critical equipment to failure.
InsteadUse preventive or predictive maintenance for anything whose failure affects the load.
MistakeReplacing parts with random failures on a schedule.
InsteadSchedule replacement only for wear-out (β > 1); monitor condition otherwise.
MistakeWorking from memory or a generic vendor procedure.
InsteadUse a site-specific, reviewed MOP with challenge-and-response.
MistakeScheduling maintenance without considering reduced redundancy.
InsteadAssess the risk window, confirm the remaining path is healthy and avoid conflicting work.
MistakeRecording maintenance only on paper.
InsteadUse a CMMS to trend results and feed reliability analysis.
Summary and key terms
- Strategies are reactive, preventive, predictive and reliability-centred; mature sites use all four.
- Condition monitoring compares measurements against commissioning baselines and trends.
- Electrical maintenance standards tie intervals to condition, criticality and environment.
- Weibull models with β > 1 support age replacement; the cost curve has a flat minimum.
- Maintenance reduces redundancy and is a leading cause of outages.
- MOPs, EOPs, peer review and challenge-and-response control maintenance risk.
- Spares, a CMMS and KPIs reduce MTTR and drive continuous improvement.
- Preventive maintenance
- Tasks performed at fixed intervals regardless of condition.
- Predictive maintenance
- Intervention based on measured condition.
- Reliability-centred maintenance
- A process choosing the strategy for each failure mode by its consequences.
- Thermography
- Infrared imaging to detect hot components.
- Weibull distribution
- A life distribution whose shape parameter describes the failure pattern.
- Age replacement
- Replacing a component at a set age or on failure.
- MOP
- Method of procedure: step-by-step instructions for a maintenance task.
- EOP
- Emergency operating procedure for responding to failures.
- Challenge-and-response
- One person reads each step aloud and another performs and confirms it.
- CMMS
- Computerized maintenance management system.
Practice problems
Work each problem on paper first, then reveal the answer to check.
When is run-to-failure acceptable?
Show answer
For cheap, non-critical items whose failure does not affect the IT load.
What does a Weibull shape parameter of 1 mean?
Show answer
A constant failure rate, random failures.
Why does scheduled replacement not help for random failures?
Show answer
A new part is no less likely to fail than a working old one.
From the output, what interval minimizes cost and what is the cost?
Show answer
About 3.7 years, about 2,280 per year.
From the output, what fraction of capacitors fail before a 4-year replacement?
Show answer
About 5.7 %.
Name four condition monitoring techniques.
Show answer
For example: thermography, battery monitoring, vibration analysis, oil analysis, dissolved gas analysis, partial discharge, fuel testing.
Why is the commissioning baseline important for maintenance?
Show answer
Trends against it reveal deterioration that single readings cannot.
List four elements of a MOP.
Show answer
Scope and risk assessment, prerequisites, step-by-step instructions with expected indications, back-out steps, restoration and sign-off.
What redundancy level does a 2N facility have while one UPS is on maintenance bypass?
Show answer
N.
Give two maintenance KPIs.
Show answer
For example: preventive tasks completed on time, planned-to-reactive ratio, backlog, MTTR, repeat failures, maintenance-caused incidents.
Lesson quiz · 5 questions
Score 60% or more to complete this lesson.
Create a free account to save your progress, take quizzes and earn a certificate.