
DCE-450 · Lesson 12 of 12 · 26 min
Case study and course project
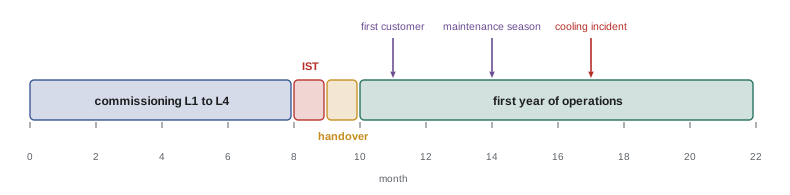
This final lesson brings the course together in a single case study that follows a data centre from the end of construction through its first year of operation. Each stage draws on earlier lessons: planning and executing commissioning, testing the facility as an integrated whole, assessing reliability and choosing improvements, preparing operations, and responding to and learning from the first serious incident. The lesson ends with the course project, in which you prepare the same set of deliverables for a facility of your own choosing.
The facility
The case study facility is a new colocation building with 12 MW of IT capacity in four data halls of 3 MW each, located in a city with cold winters and warm, humid summers. Its design features are:
- Electrical: two utility feeds; medium-voltage switchgear; a 2N UPS architecture in which each hall is served by an A-side and a B-side UPS system, each with four 1,000 kW modules in a 3-of-4 arrangement; lithium-ion batteries with 5 minutes of autonomy; eight 3 MW diesel generators in two paralleled groups with N+1 redundancy in each group.
- Mechanical: an air-cooled chiller plant with integrated free cooling, N+1 chillers per hall, a 300 m³ chilled water storage tank, fan walls in the halls with hot aisle containment, and provision for direct-to-chip liquid cooling in one hall.
- Controls and monitoring: a BMS for the mechanical plant, an EPMS with waveform capture, and a DCIM platform.
- Design intent: concurrently maintainable throughout, with fault tolerance for the electrical distribution to the racks.
Stage 1: the commissioning plan
The owner appointed a commissioning authority during design (Lesson 1), who reviewed the owner's project requirements, the basis of design and the drawings, and raised 140 design review comments, among them a shared controller for both UPS systems' battery breakers in hall 3, the kind of hidden single point of failure described in Lesson 7. The commissioning plan set out the five levels (Lesson 2), with:
- Factory witness tests for UPS modules, medium-voltage switchgear, generators and chillers.
- 100 % pre-functional checklists for all equipment, and 100 % functional testing of every UPS, generator, chiller, fan wall and switchboard. Rack PDUs were functionally tested on a sample, expanded to 100 % after the first sample of 24 found a firmware version error (a systematic defect, which sampling finds well).
- Electrical acceptance testing to NETA ATS and settings verification against the coordination study (Lesson 3), which found 31 breakers with factory default settings.
- Plant tests including a power interruption at design load, which showed that the chillers took four minutes to restart; the storage tank carried the halls with a peak supply temperature rise of 2.1 K (Lesson 4).
Stage 2: integrated systems testing
IST took three weeks, hall by hall and then for the whole site, with load banks simulating the full 12 MW. The script included 46 scenarios: utility failures with and without a generator failing, every maintenance isolation in the concurrent maintainability list, controls failures, fire alarm events in each hall, and fault tolerance tests in which UPS and distribution components were failed without warning to the systems (Lesson 5).
Two scenarios failed on first attempt. In the first, the simultaneous walk-in of all eight UPS systems and the mechanical transfer caused a generator frequency dip that made two UPS systems reject their input, as in the Lesson 5 example; the controls were changed to stagger the loads, and the scenario and two related ones were repeated successfully. In the second, a fire alarm in hall 2 shut down the fan walls in hall 1 because of a wiring error in the fire alarm interface; this was corrected and the full fire integrated test was repeated under the provincial or state integrated testing standard. The IST report documented all 46 scenarios passing in their final configuration.
Stage 3: reliability assessment and improvement
Before the first customers moved in, the owner commissioned a reliability study to decide where improvement money would do the most good. Two options were on the table: adding a fifth UPS module on each side (option A, to make each UPS system 3-of-5), or separating the controls of the A and B systems throughout the facility, removing the remaining shared elements found in the study and reducing the estimated common-cause factor from 5 % to 2 % (option B).
from math import comb

HOURS_MIN = 8760 * 60

def k_of_n(a, k, n):
    return sum(comb(n, i) * a**i * (1 - a)**(n - i) for i in range(k, n + 1))

ups_module = 50000 / (50000 + 8)
other_series = 0.99993                 # source, switchgear and distribution on one path

def path_unavail(k, n):
    return 1 - k_of_n(ups_module, k, n) * other_series

def two_paths(u_path, beta):
    return u_path**2 + beta * u_path

options = {
    "Base: 2N, 3-of-4 modules, beta 5 %": (3, 4, 0.05, 0),
    "A: add a fifth module per side":      (3, 5, 0.05, 1.6e6),
    "B: independent controls, beta 2 %":   (3, 4, 0.02, 0.3e6),
    "C: both A and B":                     (3, 5, 0.02, 1.9e6),
}
cost_per_outage_min = 25000            # contractual credits and lost business per minute of outage
base_u = two_paths(path_unavail(3, 4), 0.05)
print("Option".ljust(38) + "min/yr".rjust(8) + "saving/yr".rjust(12) + "payback yr".rjust(12))
for name, (k, n, beta, capex) in options.items():
    u = two_paths(path_unavail(k, n), beta)
    saving = (base_u - u) * HOURS_MIN * cost_per_outage_min
    payback = f"{capex / saving:12.1f}" if saving > 0 else "-".rjust(12)
print(f"{name:<38}{u * HOURS_MIN:8.2f}{saving:12,.0f}{payback}")Option min/yr saving/yr payback yr Base: 2N, 3-of-4 modules, beta 5 % 1.85 0 - A: add a fifth module per side 1.84 101 15824.3 B: independent controls, beta 2 % 0.74 27,655 10.8 C: both A and B 0.74 27,695 68.6
The result is striking. Adding a fifth module per side almost doesn't change expected downtime, because with 3-of-4 redundancy and two independent paths, module failures are already a negligible contributor. Separating the controls cuts expected downtime by 60 %, from 1.85 to 0.74 minutes a year, and at an assumed outage cost of 25,000 per minute pays back in about 11 years, while option A would never pay back. The owner chose option B. The numbers are estimates, as Lesson 6 warns, but the comparison is robust: whatever the exact failure rates, common cause dominates in a 2N design, so reducing it is the effective investment.
Stage 4: operations readiness
Operations readiness began six months before handover. The operations team, hired early, took part in functional testing and IST, so that they learned the plant while it was being proven. Key preparations were:
- Staffing: a minimum crew of a shift lead, two electrical technicians and one mechanical technician on every shift, needing about 20 people at five per post (Lesson 9), plus day-shift engineering, maintenance planning and controls specialists.
- Procedures: 180 SOPs, 95 MOPs, 60 EOPs and alarm response procedures for all priority 1 and 2 alarms, each validated on the real plant during commissioning.
- Maintenance: a CMMS loaded with every asset from the commissioning records, with maintenance plans based on the electrical maintenance standard, manufacturers' requirements and condition monitoring (Lesson 8), and baselines from the acceptance tests.
- Monitoring: an alarm rationalization workshop that reduced 14,000 configured alarm points to 2,300 alarms with defined responses and priorities (Lesson 10).
- Capacity management: a DCIM model of space, power and cooling for every rack position, with 2N-aware thresholds.
- Drills: tabletop exercises for the ten most serious EOP scenarios before the first customer arrived.
Stage 5: the first-year incident
Seven months after handover, during a summer heat wave, a chiller in hall 3 tripped on high condenser pressure. The standby chiller started, but ten minutes later a second chiller tripped for the same reason, leaving the hall below N. Rack inlet temperatures rose to 29 °C, inside the ASHRAE allowable range but above the customers' contractual 27 °C limit, for 35 minutes.
The response followed the plan. The shift lead became incident commander, assigned a communications lead who notified the affected customers within 8 minutes, and directed the mechanical technician to the EOP for loss of cooling, which included opening the chilled water storage tank to supplement the remaining chillers. A chiller vendor technician arrived within an hour.
Worked problem
Analysing the incident
The investigation found: the chillers' condensers were partly blocked by cottonwood seed fluff drawn in during early summer; the condenser coil cleaning task was scheduled annually in autumn; the BMS showed rising condenser pressure trends for three weeks before the incident, but no alarm was configured for the trend; and the chillers had been selected for a design outdoor temperature that the heat wave exceeded by 2 °C. Identify the contributing causes and propose corrective actions, ranked by strength.
Show solution
- Contributing causes: (1) blocked condenser coils, a maintenance timing issue; (2) no alarm on the rising condenser pressure trend, a monitoring gap; (3) chillers sized for a design temperature that a heat wave exceeded, a design margin issue; (4) common cause, since all chillers shared the same fouling and the same weather.
- Engineering actions (stronger): add adiabatic pre-cooling or extra condenser capacity for extreme heat; install screens on the condenser intakes that can be cleaned without stopping the chillers.
- Monitoring and maintenance actions: add a condenser approach temperature trend alarm; move coil cleaning to early summer after the seed season and add an inspection during heat warnings (condition-based rather than calendar-based).
- Procedural actions: add a heat wave readiness checklist to the seasonal operations plan, including pre-cooling the storage tank.
Answer: No one made an error in the usual sense; the incident arose from a common cause (fouling plus extreme heat) that defeated N+1 redundancy, aided by a maintenance schedule that did not match local conditions and a trend that no one was alerted to. The corrective actions combine engineering changes, condition-based maintenance and better monitoring, and each was assigned an owner and verified the following summer.
The incident illustrates nearly every theme of the course: redundancy defeated by common cause (Lesson 6), the value of thermal storage (Lesson 4), maintenance timing (Lesson 8), drilled emergency procedures (Lesson 9), trends that monitoring could have flagged (Lesson 10), and blameless, multi-cause analysis (Lesson 11).
Course project
For the course project, choose a data centre: a real facility you have access to, a published case, or a realistic hypothetical facility of at least 2 MW of IT load. Prepare the following deliverables:
- A one-page description of the facility, its design, its redundancy claims and its owner's project requirements.
- A commissioning plan summary: the levels, the equipment covered at each, the sampling policy with a statistical justification (Lesson 2), and a list of at least ten integrated systems test scenarios with acceptance criteria.
- A reliability assessment of the critical power path to a rack: a reliability block diagram, a fault tree for loss of power to a rack with its minimal cut sets ranked, an availability estimate, and an evaluation of at least two improvement options, including common cause.
- A maintenance plan for one major system (UPS, generators or chiller plant), stating the strategy for each main failure mode, the condition monitoring used, the applicable standards for your country, and an age replacement analysis for one wear-out component.
- An operations readiness summary: staffing calculation, procedure list, alarm philosophy and capacity management thresholds.
- An incident analysis: a credible incident scenario for your facility, the response, a root cause analysis with at least three contributing causes, and ranked corrective actions.
Use the Canadian standards that apply to your facility, such as CSA Z463 for electrical maintenance, CSA C282 for emergency generators, CSA Z462 for electrical safety, CSA B52 for refrigeration and CAN/ULC-S1001 for integrated fire and life safety testing, together with the industry standards that apply in both countries (NETA, IEEE, ASHRAE and ISO/IEC).
The project is assessed on technical correctness, on whether the deliverables are consistent with each other (the IST scenarios should test the failures your reliability analysis identifies, and your maintenance plan should address the failure modes in your FMEA), and on the quality of your reasoning when data are uncertain. State your assumptions clearly, and show how sensitive your conclusions are to them.
Common mistakes
MistakeTreating commissioning, reliability, maintenance and operations as separate topics.
InsteadLink them: tests target analysed failures, maintenance addresses failure modes, operations learn from both.
MistakeSpending improvement money where the redundancy is already strong.
InsteadUse cut sets and option analysis to find where risk concentrates.
MistakeHiring operations staff at handover.
InsteadInvolve them in functional testing and IST.
MistakeScheduling maintenance by calendar without regard to local conditions.
InsteadMatch maintenance timing to conditions and monitor trends.
MistakeHiding uncertainty in a project analysis.
InsteadState assumptions and test the sensitivity of conclusions.
Summary and key terms
- Commissioning planning starts in design and catches hidden single points of failure.
- Statistical sampling works for systematic defects; critical equipment is tested 100 %.
- IST proves interactions; failed scenarios are fixed and repeated with related ones.
- Reliability option analysis showed that reducing common cause beats adding modules.
- Operations readiness covers staffing, procedures, maintenance, alarms, capacity and drills.
- The first-year incident showed common cause defeating N+1 and the value of trends and storage.
- The course project integrates all of these for a facility of your choice.
- Commissioning authority
- The independent party leading the commissioning process.
- Operations readiness
- Preparing staff, procedures and systems to operate a facility from handover.
- Option analysis
- Comparing improvement options by their effect on risk and their cost.
- Payback period
- The time for savings to repay an investment.
- Condenser approach
- The difference between condensing temperature and outdoor air temperature.
- Adiabatic pre-cooling
- Cooling incoming condenser air by evaporating water.
- Heat wave readiness
- Seasonal preparations for extreme outdoor temperatures.
- Seasonal testing
- Testing performed in the season whose conditions it needs.
- Sensitivity analysis
- Testing how conclusions change with assumptions.
- Deliverable
- A defined output of a project.
Practice problems
Work each problem on paper first, then reveal the answer to check.
Why did the case study expand rack PDU testing to 100 % after the first sample?
Show answer
The sample found a firmware error, a systematic defect likely to affect every unit.
What did the power interruption test at design load show?
Show answer
Chillers took four minutes to restart; the storage tank limited the supply temperature rise to 2.1 K.
Why did the IST team repeat related scenarios after fixing the UPS walk-in problem?
Show answer
The controls change could affect other scenarios that had passed.
From the output, why does a fifth UPS module barely help?
Show answer
Module failures already contribute almost nothing with 3-of-4 modules and two paths; common cause dominates.
From the output, what are the expected downtime and payback of option B?
Show answer
0.74 minutes a year; about 11 years.
How many people did the minimum crew of four per shift need?
Show answer
About 20.
Name two operations readiness activities.
Show answer
For example: procedure validation, CMMS loading, alarm rationalization, DCIM model, tabletop drills.
What common cause defeated N+1 cooling in the incident?
Show answer
Condenser fouling combined with a heat wave affected all chillers.
Give one engineering and one monitoring corrective action from the incident.
Show answer
Engineering: adiabatic pre-cooling or intake screens. Monitoring: a condenser approach trend alarm.
What makes project deliverables consistent?
Show answer
IST scenarios test the failures identified by the reliability analysis, and maintenance addresses the FMEA failure modes.
Lesson quiz · 5 questions
Score 60% or more to complete this lesson.
Create a free account to save your progress, take quizzes and earn a certificate.