
DCE-410 · Lesson 6 of 12 · 26 min
Noise, visual and traffic impact studies
Lesson 3 introduced noise as the most frequent complaint from neighbours of data centres. This lesson goes further into the technical studies that support land use approvals and community engagement: how environmental noise is measured and regulated, how a noise impact study is carried out and mitigation designed, how visual and lighting impacts are assessed, and how traffic impact studies treat a data centre's distinctive pattern of heavy construction traffic followed by modest operating traffic. These studies are often decisive at public hearings, where a credible, independently reviewed study is worth more than any assurance from the developer.
Environmental noise basics
Sound levels are measured in decibels on a logarithmic scale. The A-weighting (dBA) adjusts the spectrum to approximate the ear's sensitivity, which is low at low frequencies. Because levels vary over time, regulations use time-averaged quantities:
- The equivalent continuous level \(L_{eq}\) over a period, such as one hour or the night, is the steady level with the same total sound energy. Data centre cooling equipment is nearly steady, so its \(L_{eq}\) is close to its typical level.
- Percentile levels, such as \(L_{90}\) (the level exceeded 90% of the time), describe background sound without passing events.
- Day-night or day-evening-night levels add penalties for evening and night sound, reflecting greater annoyance.
Several characteristics make a sound more annoying than its dBA level suggests. Tonal sounds, such as the hum of transformers at 120 Hz and its harmonics or the blade-pass tone of fans, stand out against background; many regulations add a penalty of about 5 dB for clearly audible tones. Low-frequency sound from large fans, chillers and generator exhaust travels farther, penetrates walls more easily, and is underweighted by the A-scale, so complaints can arise even when dBA limits are met. Studies increasingly report C-weighted or octave-band levels in addition to dBA.
In Ontario, stationary sources are assessed under the provincial noise guideline NPC-300, which sets sound level limits at points of reception according to the area class: for a Class 1 urban area, 50 dBA by day and 45 dBA at night, or the background level if higher; for a Class 3 rural area, 45 dBA by day and 40 dBA at night. Facilities whose noise sources require an Environmental Compliance Approval must show compliance with these limits, and municipalities may impose additional requirements through zoning and site plan conditions. Other provinces have their own guidelines, and many municipalities have noise bylaws covering construction hours.
The noise impact study
A noise impact study predicts the sound levels the facility will create at nearby sensitive receptors (homes, schools, hospitals, places of worship) and compares them with the limits. The steps are:
- Measure existing background levels at representative receptors, ideally over several days and nights including quiet periods.
- Inventory the sources and their sound power levels, ideally from manufacturer data or measurements of identical equipment: dry coolers and chillers, cooling tower fans, air handlers on roofs, transformers, generators during testing and outages, exhaust fans, and construction equipment.
- Model propagation to the receptors, using standard methods such as ISO 9613-2, which account for geometric spreading, atmospheric absorption (which increases with frequency), ground effects, barriers formed by buildings, walls and berms, and reflections.
- Compare predicted levels with limits for each period, including tonal penalties, and identify which sources dominate at each receptor.
- Design mitigation and repeat the analysis until compliance is shown with margin.
For a source of sound power level \(L_W\) on reflecting ground, the sound pressure level at distance \(r\) is approximately \(L_p = L_W - 20\log_{10} r - 8 - A_{\text{atm}} - A_{\text{bar}}\), and the contributions of multiple sources add on an energy basis.
import numpy as np

# Sources: (name, sound power level Lw in dBA, x, y in metres, number of units, runs at night?)
sources = [("dry cooler bank", 98, 100, 50, 24, True), ("generator test", 112, 160, 20, 1, False), ("transformer", 85, 60, 30, 4, True)]
receptors = {"house R1": (420, 60), "house R2": (150, 380)}
barrier = {"house R1": 10, "house R2": 0}               # insertion loss of a noise wall toward R1 only (dB)
alpha = 0.005                                          # atmospheric absorption, dB per metre (mid frequencies)

def level(lw, r, n):
    # spherical spreading from a point source above reflecting ground: Lp = Lw - 20 log r - 8, plus n identical units
    return lw - 20 * np.log10(r) - 8 + 10 * np.log10(n) - alpha * r

for name, (xr, yr) in receptors.items():
    night, day = [], []
    for s, lw, xs, ys, n, at_night in sources:
        r = np.hypot(xr - xs, yr - ys)
        L = level(lw, r, n) - barrier[name]
        day.append(L)
        if at_night: night.append(L)
        print(f"  {name} <- {s:16s}: {r:5.0f} m, {L:5.1f} dBA")
    tot = lambda ls: 10 * np.log10(sum(10 ** (l / 10) for l in ls))
print(f"{name}: night {tot(night):.1f} dBA against a 45 dBA limit; day with a generator test {tot(day):.1f} dBA against 50 dBA")house R1 <- dry cooler bank : 320 m, 42.1 dBA house R1 <- generator test : 263 m, 44.3 dBA house R1 <- transformer : 361 m, 20.1 dBA house R1: night 42.1 dBA against a 45 dBA limit; day with a generator test 46.3 dBA against 50 dBA house R2 <- dry cooler bank : 334 m, 51.7 dBA house R2 <- generator test : 360 m, 51.1 dBA house R2 <- transformer : 361 m, 30.1 dBA house R2: night 51.7 dBA against a 45 dBA limit; day with a generator test 54.4 dBA against 50 dBA
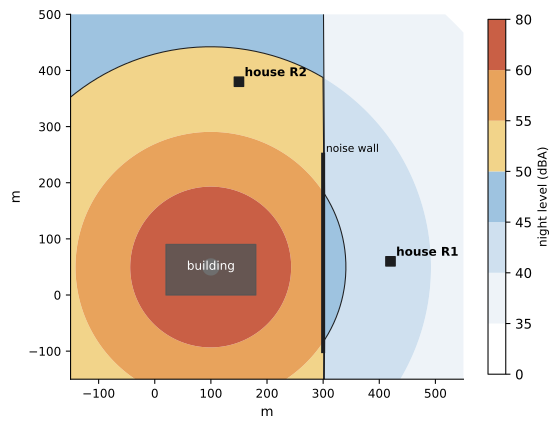
House R1, shielded by the noise wall, meets both limits. House R2 exceeds the night limit by almost 7 dB because of the cooling equipment, and the daytime limit during generator tests. Reducing a source by 7 dB means cutting its acoustic energy by a factor of five. Possible measures, roughly in order of cost-effectiveness:
- Layout: put cooling equipment on the side of the building away from homes, and use the building itself as a barrier.
- Equipment selection: low-noise fans running at lower speeds (fan noise falls by about 50 log of the speed ratio, so a 20% speed reduction gives about 5 dB), larger coolers with more fans at lower speed, and quieter transformers.
- Barriers and enclosures: acoustic screens around rooftop equipment, berms and noise walls, which give 5 to 15 dB when they break the line of sight.
- Silencers: on generator intakes, discharges and exhausts, and on building air intakes.
- Operations: generator testing in daytime hours, one unit at a time, and on load banks inside enclosures (DCE-340).
Approvals often require post-construction noise monitoring to confirm compliance, sometimes continuous monitoring with public reporting. Designing with margin, typically 3 to 5 dB below the limit, protects against prediction uncertainty and equipment that turns out noisier than its data sheet.
Worked problem
How much quieter must the coolers be?
At a receptor, the night level is 51.7 dBA, almost all from 24 dry coolers, and the target is 42 dBA (3 dB below a 45 dBA limit). How much must the coolers be reduced? If quieter fans give 6 dB, what else is needed?
Show solution
- Required reduction: \(51.7 - 42 = 9.7\) dB, roughly 10 dB.
- Quieter fans give 6 dB, leaving about 4 dB.
- An acoustic screen around the cooler bank giving 5 to 8 dB would close the gap.
Answer: About 10 dB, achievable with quieter, slower fans combined with a rooftop screen. Moving the cooler bank to the far side of the building, if decided early, might achieve the same at little cost, which is why noise belongs in the earliest layout decisions.
Visual impact and lighting
Data centre buildings are large, windowless boxes, often 15 to 25 m tall and hundreds of metres long, with rooftop equipment, generator stacks, substations and transmission lines. In rural and suburban settings they change the landscape, and visual impact is a common concern in approvals. Visual impact assessments typically:
- Map the zone of theoretical visibility from terrain and building heights to identify where the facility could be seen.
- Prepare photo simulations from representative viewpoints chosen with planners and the community: nearby homes, roads, trails and heritage sites.
- Assess the significance of changes and propose mitigation.
Mitigation includes setbacks, berms and landscaping with mature trees (and time for them to grow), building articulation and materials that break up long walls, colours that recede against the sky or landscape, screening of rooftop equipment and substations, and burying distribution lines where practical. Many municipalities now publish design guidelines for data centres requiring such measures.
Lighting for security must be balanced against light trespass and glare at neighbouring properties and the night sky. Good practice uses full-cutoff fixtures aimed downward, the lowest lighting levels that meet security needs, motion-activated lighting in rarely used areas, and warm colour temperatures (3,000 K or lower) where wildlife or dark-sky protection matters. Lighting plans showing illuminance at property lines are typically part of site plan approval.
Traffic impact studies
A data centre generates heavy traffic during construction and light traffic in operation. A large campus under construction can have 1,000 to 3,000 workers on site at peak, along with concrete trucks, steel deliveries and oversize loads, sustained for years as buildings are added in phases. In operation, a 100 MW building may employ only 30 to 60 people across shifts, plus vendors and deliveries. Traffic studies must therefore address both phases:
- Construction traffic management plans: haul routes away from residential streets and schools, delivery hours, worker parking and shuttles, temporary signals or turn lanes, road condition surveys before and after construction, and repair obligations.
- Oversize and overweight loads: power transformers of 150 to 300 tonnes and large generators need route surveys, bridge assessments, permits and sometimes temporary road modifications.
- Operations: trip generation for the completed campus, using local surveys or published rates where available, intersection capacity analysis for peak hours, and access design (turn lanes, sight distances, emergency access).
Worked problem
Construction peak traffic
At peak, 2,000 construction workers arrive in a 1-hour morning window with an average vehicle occupancy of 1.2. In addition, 150 truck deliveries arrive over the day, 15% of them in the same hour. How many vehicles arrive in the morning peak hour, and how might this be reduced?
Show solution
- Workers: \(2{,}000/1.2 = 1{,}667\) vehicles.
- Trucks: \(0.15 \times 150 = 23\) in the peak hour (each counting as two to three cars for capacity).
- Total: about 1,690 vehicles, equivalent to about 1,720 to 1,740 passenger cars.
Answer: About 1,700 vehicles in one hour, comparable to a busy arterial road. Staggered shifts, remote parking with shuttle buses (raising effective occupancy) and delivery windows outside peak hours can halve the peak, often avoiding permanent road widening for a temporary demand.
Road improvements are a frequent subject of negotiation with municipalities and road authorities (Lesson 10): developers may be required to fund turn lanes, signals, road widening or contributions to future upgrades. Agreeing the scope of the traffic study with the road authority before starting avoids costly rework.
Other impact studies
Depending on the site and jurisdiction, approvals may also require studies of:
- Air quality dispersion from generators, especially for testing schedules near homes (Lesson 5).
- Electromagnetic fields near substations and transmission lines, usually to show that levels at property lines are well below guideline values.
- Shadow and wind effects for tall buildings in urban settings.
- Socioeconomic effects, including employment, housing demand during construction and effects on local services (Lesson 11).
- Agricultural impact where farmland is converted, sometimes requiring analysis of alternatives on lower-quality land.
Common mistakes
MistakeUsing dBA predictions alone for large fans and transformers.
InsteadCheck tonal and low-frequency content, which drive complaints.
MistakeDesigning exactly to the noise limit.
InsteadLeave 3 to 5 dB of margin for prediction and equipment uncertainty.
MistakePlacing cooling equipment before noise is studied.
InsteadUse layout and the building as a barrier from the earliest concept.
MistakeIgnoring construction traffic because operations traffic is small.
InsteadPlan haul routes, shifts, shuttles and oversize loads for multi-year construction.
MistakeRelying on landscaping that takes decades to mature.
InsteadCombine berms, setbacks, materials and mature planting for early screening.
Summary and key terms
- Noise is assessed with A-weighted equivalent levels, with penalties for tonal sound and attention to low frequencies.
- Noise studies measure background, inventory sources, model propagation and design mitigation with margin.
- Layout, quieter equipment, barriers, silencers and testing schedules are the main mitigation tools.
- Visual impact assessments use visibility mapping and photo simulations, with landscaping, design and lighting controls.
- Traffic studies address multi-year construction peaks, oversize deliveries and modest operational traffic.
- Other studies cover air quality, electromagnetic fields, socioeconomic effects and farmland.
- dBA
- Sound level weighted to approximate human hearing.
- Leq
- Equivalent continuous sound level over a period.
- L90
- The level exceeded 90% of the time, used for background sound.
- Tonal penalty
- An adjustment added for clearly audible tones.
- Sound power level
- The total acoustic power emitted by a source, in dB.
- ISO 9613-2
- A standard method for outdoor sound propagation.
- Point of reception
- A location where noise limits apply, such as a home.
- Zone of theoretical visibility
- The area from which a structure could be seen, based on terrain.
- Full-cutoff fixture
- A light fixture emitting no light above the horizontal.
- Trip generation
- The number of vehicle trips a development produces.
Practice problems
Work each problem on paper first, then reveal the answer to check.
Two equal sources of 45 dBA combine to:
Show answer
48 dBA.
Ten equal sources of 40 dBA combine to:
Show answer
50 dBA.
Level at 200 m from a source of 50 dBA at 50 m (free field)?
Show answer
\(50 - 20\log_{10}4 = 38\) dBA.
Approximate noise reduction from reducing fan speed by 20%?
Show answer
\(50\log_{10}0.8 = -4.8\) dB.
Why are transformer hums particularly annoying?
Show answer
They are tonal and low-frequency.
What margin below the limit is good practice in design?
Show answer
3 to 5 dB.
Name two visual mitigation measures.
Show answer
Berms and landscaping, articulation, receding colours, equipment screens.
What lighting fixture type limits sky glow?
Show answer
Full-cutoff fixtures aimed downward.
1,500 workers at occupancy 1.25 arrive in one hour. Vehicles?
Show answer
1,200.
Why do transformer deliveries need route studies?
Show answer
They weigh 150 to 300 tonnes and need bridge and road assessments.
Lesson quiz · 5 questions
Score 60% or more to complete this lesson.
Create a free account to save your progress, take quizzes and earn a certificate.