
DCE-200 · Lesson 4 of 12 · 31 min
Electrical distribution, protection and power quality
Lesson 3 followed power along a single path from the grid to the chip. A real data centre has dozens of paths, arranged so that equipment can fail or be maintained without interrupting the IT load, and protected so that a fault anywhere is isolated quickly without spreading. This lesson looks at the electrical system as a whole: how engineers draw it in single-line diagrams, the main distribution architectures, how power is delivered across the white space, how faults are cleared and arc flash hazards controlled, what power quality problems occur, and how the system is monitored. These topics are developed further in DCE-310 and DCE-340.
Reading a single-line diagram
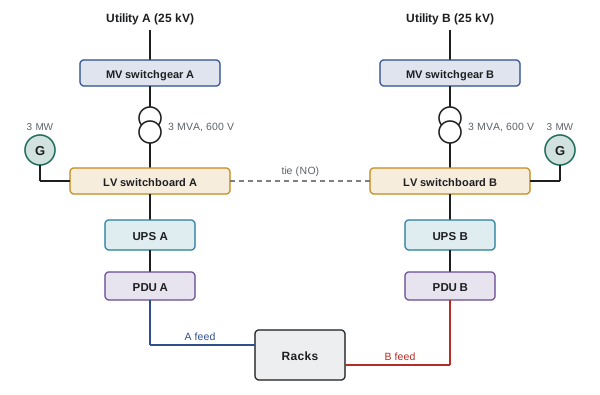
Three-phase systems have three or four conductors, but engineers draw them as a single line to keep diagrams readable. A single-line diagram (SLD) shows every source, transformer, breaker, switch, UPS and distribution board, with ratings, and the way they connect. It is the most important document for understanding, operating and maintaining an electrical system: operators use it to plan switching, maintenance staff to isolate equipment safely, and engineers to calculate fault currents and check coordination.
Common symbols include circles for transformers (two overlapping circles), squares or small rectangles for circuit breakers (labelled with their rating), a circle with a G for generators, and boxes for UPS units and PDUs. Normally open devices, such as tie breakers that connect two systems only when needed, are drawn open or labelled NO. Learning to read an SLD quickly is one of the first skills new data centre engineers and technicians develop.
Distribution architectures
Lesson 8 defines redundancy levels such as N+1 and 2N. In electrical systems these appear as a handful of standard architectures, each with a different balance of cost, utilization and resilience:
- 2N (system plus system): two complete, independent paths from utility or generator to the rack, A and B. Each path is sized for the full load, so each normally runs at no more than 50%. Simple to understand and highly resilient, but expensive and inefficient because half the capacity is always idle.
- Distributed redundant (sometimes called 3-to-make-2 or 4-to-make-3): several blocks, each loaded to a fraction of its capacity, with every rack fed from two different blocks. If any block fails, its load shifts to the others. For three blocks feeding pairs of racks, each block can be loaded to about 67%.
- Block redundant with a reserve (catcher): several active blocks each carry their own load, and one reserve block stands ready; static transfer switches or the generator and UPS paralleling arrangement move a failed block's load to the reserve.
- N+1 shared: a common bus fed by several UPS modules or generators plus one spare; cheaper, but the common bus is a single point of failure.
Hyperscale operators often use distributed or catcher schemes because they achieve high availability with utilization of 67% to 90% instead of 50%; enterprise and financial facilities more often use 2N for its simplicity and isolation.
Worked problem
Utilization of architectures
A 6 MW IT load is supplied with 2 MW UPS blocks. How many blocks are needed for (a) 2N, (b) distributed redundant 4-to-make-3, and (c) N+1 catcher? What is the normal loading of each block?
Show solution
- (a) 2N: each side needs 3 blocks, total 6 blocks; normal loading \(6/(6 \times 2) = 50\%\).
- (b) 4-to-make-3: the load must still be carried by 3 blocks if one fails, so 4 blocks of 2 MW are installed; normal loading \(6/8 = 75\%\).
- (c) Catcher: 3 active blocks plus 1 reserve = 4 blocks; active blocks run at 100% of their share, the reserve at 0%, average 75%.
Answer: 2N needs 6 blocks at 50% loading; the distributed and catcher schemes need 4 blocks at 75% average loading. The two schemes with fewer blocks save about a third of the UPS, generator and switchgear capital cost, at the price of more complex transfers and coordination.
Delivering power across the white space
From the UPS output, power reaches the racks through one of several distribution methods:
- PDUs and remote power panels (RPPs): a floor-standing PDU contains a transformer (where voltage must be stepped down) and panels of breakers; RPPs extend those panels closer to the racks; individual cables (whips) run to each rack overhead or under a raised floor.
- Overhead busway: a continuous enclosed busbar runs above each row, and plug-in tap-off boxes with breakers drop power to each rack. Busway is fast to reconfigure, avoids long cable runs and supports high densities, so it is common in modern facilities.
- Direct rack feeds: for very high-density AI racks, large dedicated circuits or busway tap-offs of 100 A to 400 A per rack, sometimes at higher voltage to rack-level power shelves.
Each method must provide the A and B feeds that dual-corded equipment expects, keep the two paths physically separated where possible, and allow circuits to be added without shutting down neighbours.
Worked problem
Busway capacity for a row
An overhead busway at 415 V three-phase, rated 400 A, feeds one side (A) of a row. Continuous load is limited to 80% of the rating. How many 17 kW racks can it serve if the B busway must be able to carry everything if A fails?
Show solution
- Capacity: \(\sqrt{3} \times 415 \times 400 \times 0.8 = 230\) kVA, about 230 kW at unity power factor.
- Racks: \(230/17 = 13.5\), so 13 racks per row.
Answer: Thirteen racks per row, because each busway must be able to carry the whole row alone. Raising rack density to 50 kW would allow only 4 racks per busway, so AI rows use larger busways (800 A to 1,600 A) or multiple runs.
Fault current and protection
A short circuit (fault) connects conductors at different voltages through a very low impedance, so a current far larger than normal flows, limited mainly by the impedance of the transformers and cables upstream. Every breaker must be able to interrupt the largest fault current that can flow through it (its interrupting rating), and every piece of equipment must withstand it until the breaker opens. A simple estimate of the maximum fault current at a transformer's secondary uses its percent impedance \(Z\%\), assuming an infinitely strong utility:
Worked problem
Fault current at a unit substation
A 3,000 kVA transformer with 5.75% impedance has a 600 V secondary. Estimate the full-load and maximum three-phase fault current, and compare with a 480 V secondary.
Show solution
- Full load at 600 V: \(3{,}000{,}000/(\sqrt{3} \times 600) = 2887\) A; fault current \(2887/0.0575 = 50.2\) kA.
- At 480 V: 3608 A full load and 62.8 kA fault current.
Answer: About 50 kA at 600 V (plus motor and generator contributions in practice), so the switchgear needs an interrupting rating of at least 65 kA. Lower voltages carry higher currents and higher fault levels for the same transformer, which is one reason why Canadian 600 V systems use smaller conductors and equipment than 480 V systems.
Protective devices are arranged in layers from the utility to the rack. Selective coordination means that for any fault, only the device immediately upstream of the fault opens, so a fault in one rack circuit trips only that circuit, not the PDU, UPS output or switchboard. In a data centre, poor coordination can turn a single failed power supply into the loss of a whole hall, so engineers check time-current curves for every device pair and set adjustable breakers carefully (ELEC-220 and ELE-480).
Arc flash
When a fault arcs through air inside energized equipment, it releases intense heat, light, pressure and molten metal in milliseconds. An arc flash can cause severe burns and other injuries several metres away. Because data centre equipment is rarely shut down, technicians may need to work near energized equipment, so arc flash hazard is a central safety issue.
In Canada, CSA Z462 (Workplace electrical safety) requires an arc flash risk assessment, labels on equipment showing the incident energy or required protective equipment, energized work permits and approach boundaries. Provincial occupational health and safety regulations make employers responsible for these controls.
The most effective control is to eliminate energized work: design for concurrent maintainability (Lesson 8) so equipment can be de-energized and locked out for maintenance. Where that is impossible, engineers reduce incident energy with faster protection, such as maintenance-mode settings that temporarily make breakers trip instantly, arc-flash relays that detect light, remote racking of breakers, and infrared windows for thermal inspection without opening panels.
Grounding and bonding
Grounding connects the electrical system and equipment enclosures to earth and to each other, so that faults cause enough current to trip protection quickly, touch voltages stay safe, and lightning and surges have a controlled path. Data centres also need a low-impedance bonding network linking racks, cable trays, raised floor supports and building steel, so that sensitive electronics and their signal cables share a common reference. Standards such as ANSI/TIA-607 (telecommunications bonding) and IEEE 1100 guide this work alongside the electrical code. Generators and UPS systems complicate grounding because the location of the neutral-to-ground bond determines whether ground fault protection operates correctly; designers decide between 3-pole and 4-pole transfer switching with this in mind.
Power quality
Utility power is never perfect. The main power quality issues in data centres are:
- Sags and swells: short drops or rises in voltage, often caused by faults elsewhere on the grid; UPS systems ride through them.
- Interruptions: complete loss of supply, from a fraction of a second to hours; UPS and generators cover them.
- Transients: very short spikes from lightning or switching; surge protective devices limit them.
- Harmonics: current distortion from rectifiers in UPS systems, server power supplies and drives (ELE-470); excessive harmonics overheat transformers and neutrals and interfere with generators.
- Frequency deviation: mainly a concern on generator power, where large load steps can cause frequency dips that make UPS units transfer to battery.
A data centre's own load can also affect the grid. AI training clusters can change their power draw by tens of megawatts within seconds as jobs start and stop, and in July 2024 about 1,500 MW of data centre load in Virginia disconnected simultaneously during a grid fault, a scale that grid operators had not planned for. Grid operators now set ride-through requirements for large loads (DCE-420).
Worked problem
Generator step loading
A 2.5 MW generator can accept a sudden load step of about 60% of its rating while keeping frequency within limits. After a utility failure, a UPS block of 1.8 MW transfers to the generator, plus 0.6 MW of cooling that restarts. Can the generator accept all of it at once?
Show solution
- Step capacity: \(0.6 \times 2.5 = 1.5\) MW.
- Total step: \(1.8 + 0.6 = 2.4\) MW, which exceeds 1.5 MW.
Answer: No. The load must be sequenced: modern UPS systems ramp their input onto the generator over 10 to 20 seconds (walk-in), while the batteries carry the difference, and cooling equipment restarts in stages. Getting this sequence right is a key part of commissioning (Lesson 12).
Monitoring and control
An electrical power monitoring system (EPMS) measures voltages, currents, power, energy, harmonics and breaker status throughout the facility, records events with precise time stamps, and alarms abnormal conditions. It shows operators the real loading of each path (essential for confirming that the redundancy design still holds as load grows), captures waveforms during disturbances for investigation, and supplies data for PUE and billing. Data centre infrastructure management (DCIM) software combines electrical, mechanical and IT data with an inventory of equipment and connections (Lesson 12). Because these systems connect to networks, they must be secured against cyberattack like any other operational technology.
Common mistakes
MistakeAssuming 2N is the only way to achieve high availability.
InsteadDistributed and catcher schemes reach high availability with higher utilization.
MistakeSelecting breakers by load current only.
InsteadCheck interrupting ratings against calculated fault current.
MistakeIgnoring coordination between UPS, PDU and rack breakers.
InsteadVerify selective coordination so faults stay local.
MistakeRelying on PPE as the main arc flash control.
InsteadDesign to de-energize for maintenance and reduce incident energy.
MistakeApplying all load to a generator in one step.
InsteadSequence UPS walk-in and cooling restart.
Summary and key terms
- Single-line diagrams show the whole electrical system and are essential for operation and safety.
- Architectures include 2N, distributed redundant, catcher and N+1; they trade cost, utilization and simplicity.
- Power reaches racks through PDUs, RPPs and whips, or overhead busway; AI racks need large dedicated feeds.
- Fault current ≈ full-load current ÷ per-unit impedance; breakers must interrupt it.
- Selective coordination keeps faults local; arc flash risk is controlled by design and procedures.
- Grounding and bonding protect people and equipment and give electronics a common reference.
- Power quality issues include sags, transients, harmonics and generator frequency dips; large AI loads affect the grid too.
- EPMS and DCIM monitor loading, events and energy.
- Single-line diagram
- A diagram showing a three-phase electrical system with one line per circuit.
- Distributed redundant
- An architecture where racks are fed from two of several shared blocks.
- Catcher (reserve) block
- A standby block that takes over the load of a failed active block.
- Busway
- An enclosed busbar distributing power along a row with plug-in tap-offs.
- Interrupting rating
- The maximum fault current a protective device can safely interrupt.
- Selective coordination
- Protection arranged so only the device nearest a fault opens.
- Arc flash
- The release of energy from an electrical arc through air.
- Bonding
- Connecting metal parts to give a continuous low-impedance path.
- Harmonics
- Current or voltage components at multiples of the supply frequency.
- EPMS
- Electrical power monitoring system.
Practice problems
Work each problem on paper first, then reveal the answer to check.
What does a normally open tie breaker do?
Show answer
Connects two systems only when needed, for example during maintenance.
9 MW load with 3 MW blocks. Blocks and loading for 2N?
Show answer
6 blocks at 50%.
Same load, distributed 4-to-make-3 with 3 MW blocks. Loading?
Show answer
9/12 = 75%.
415 V busway rated 630 A at 80%. Usable kW?
Show answer
√3 × 415 × 630 × 0.8 ≈ 362 kW.
2,500 kVA transformer, 6% impedance, 480 V. Fault current?
Show answer
3007 A / 0.06 ≈ 50 kA.
What is selective coordination?
Show answer
Only the device nearest the fault opens.
Name two engineering controls that reduce arc flash energy.
Show answer
Maintenance-mode instantaneous trips, arc-flash relays, remote racking.
Why must A and B paths be physically separated?
Show answer
So one event (fire, flood, damage) cannot take out both.
A 2 MW generator accepts 50% steps. Can it take a 1.2 MW step?
Show answer
No; maximum 1 MW.
What happened in Virginia in July 2024?
Show answer
About 1,500 MW of data centre load disconnected at once during a grid fault.
Lesson quiz · 5 questions
Score 60% or more to complete this lesson.
Create a free account to save your progress, take quizzes and earn a certificate.